. 2022 May 2;14(1):29.
doi: 10.1186/s11689-022-09441-1.

Characterization of cell-cell communication in autistic brains with single-cell transcriptomes

Affiliations

Characterization of cell-cell communication in autistic brains with single-cell transcriptomes

Maider Astorkia et al. J Neurodev Disord. .

Abstract

Background: Autism spectrum disorder is a neurodevelopmental disorder, affecting 1-2% of children. Studies have revealed genetic and cellular abnormalities in the brains of affected individuals, leading to both regional and distal cell communication deficits.

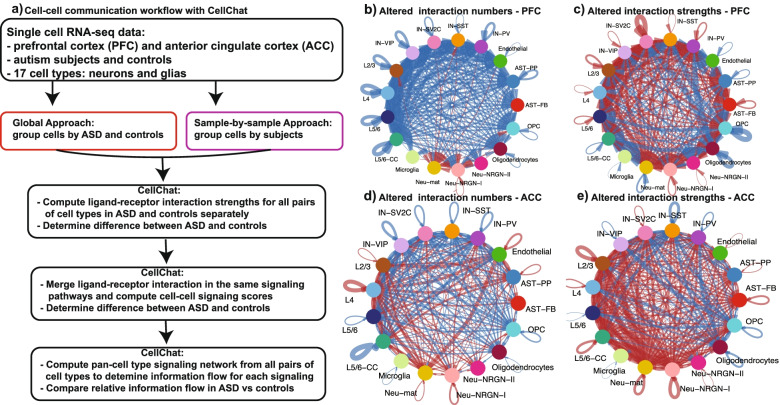
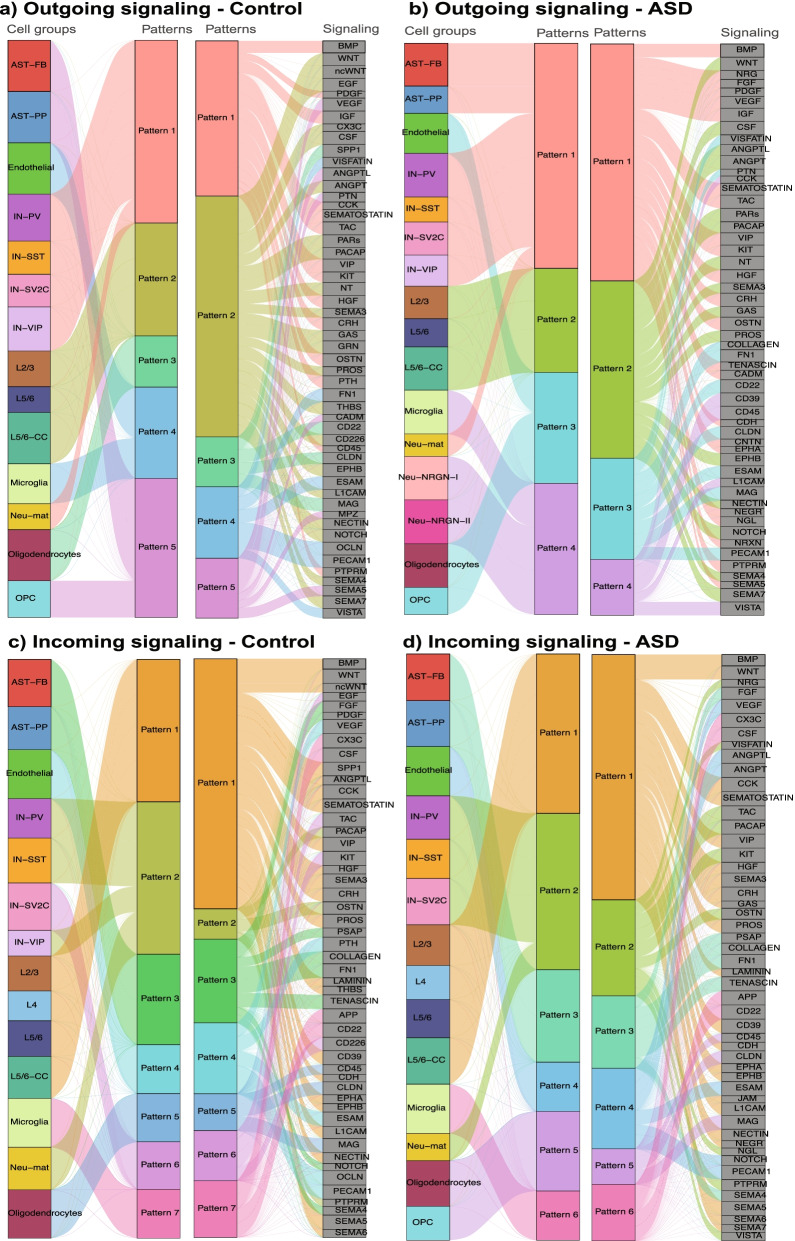
Methods: Recent application of single-cell technologies, especially single-cell transcriptomics, has significantly expanded our understanding of brain cell heterogeneity and further demonstrated that multiple cell types and brain layers or regions are perturbed in autism. The underlying high-dimensional single-cell data provides opportunities for multilevel computational analysis that collectively can better deconvolute the molecular and cellular events altered in autism. Here, we apply advanced computation and pattern recognition approaches on single-cell RNA-seq data to infer and compare inter-cell-type signaling communications in autism brains and controls.

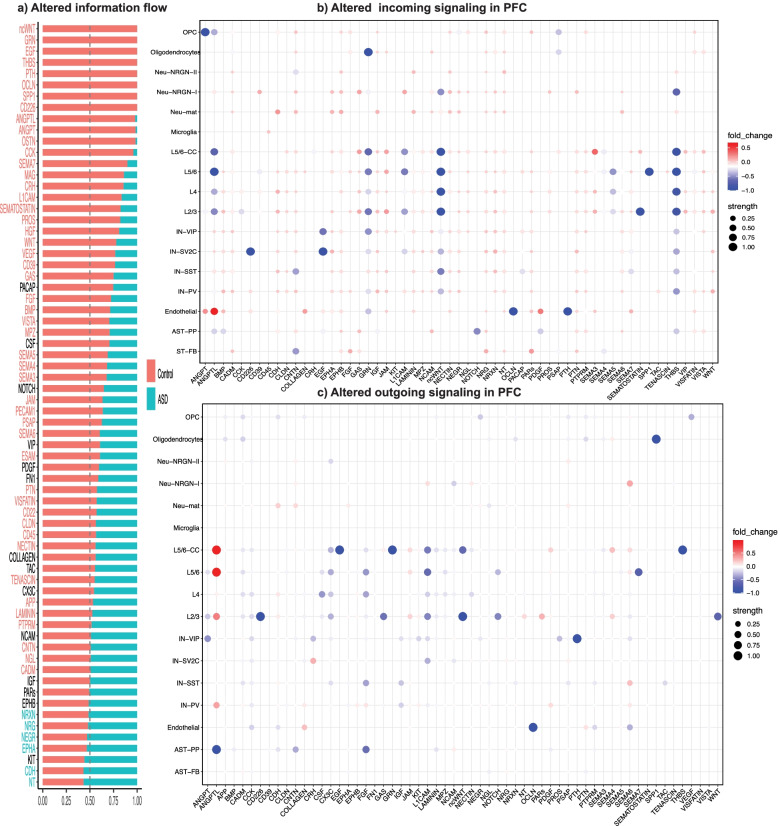
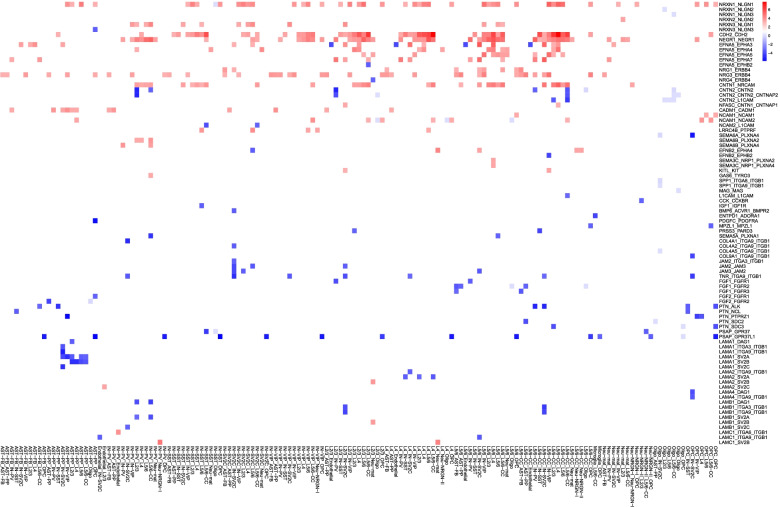
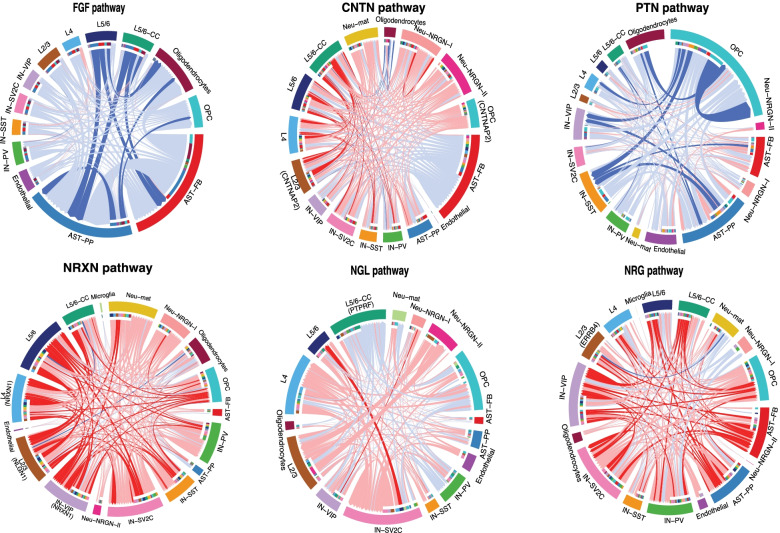
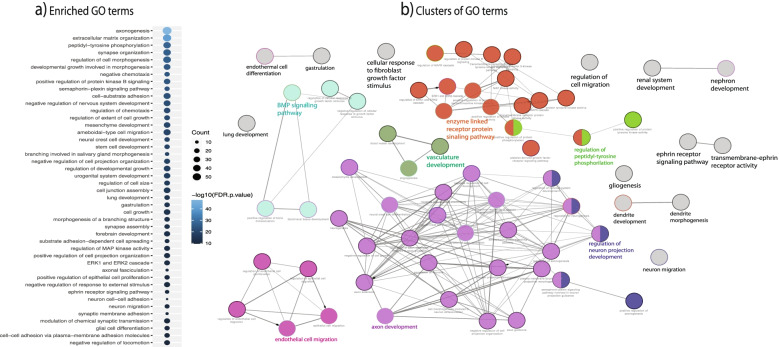
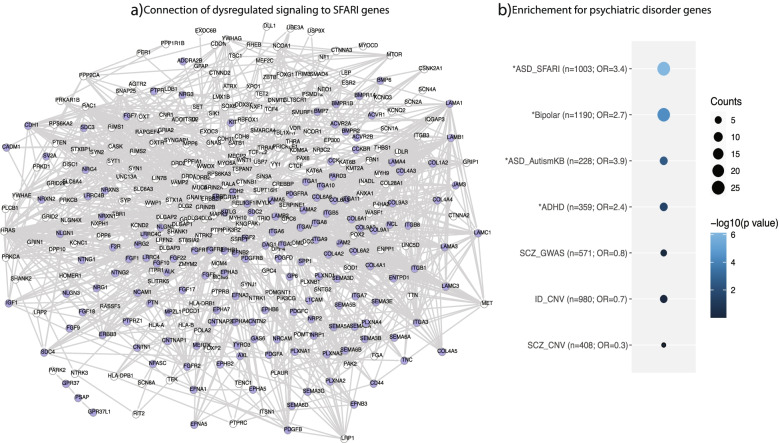
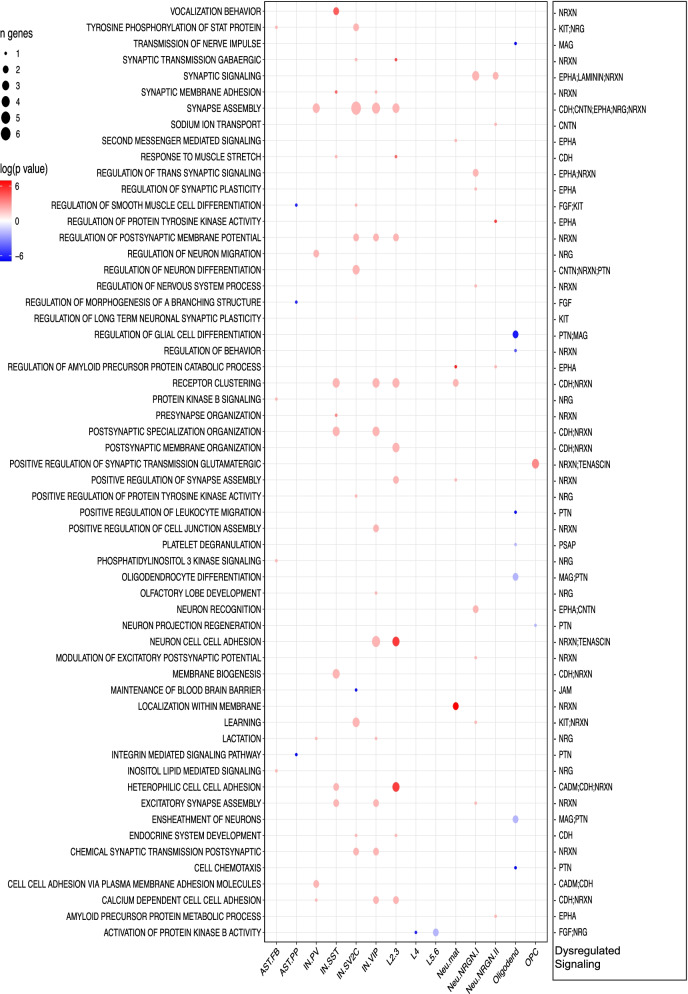
Results: Our results indicate that at a global level, there are cell-cell communication differences in autism in comparison with controls, largely involving neurons as both signaling senders and receivers, but glia also contribute to the communication disruption. Although the magnitude of changes is moderate, we find that excitatory and inhibitor neurons are involved in multiple intercellular signaling that exhibits increased strengths in autism, such as NRXN and CNTN signaling. Not all genes in the intercellular signaling pathways show differential expression, but genes in the affected pathways are enriched for axon guidance, synapse organization, neuron migration, and other critical cellular functions. Furthermore, those genes are highly connected to and enriched for genes previously associated with autism risks.

Conclusions: Overall, our proof-of-principle computational study using single-cell data uncovers key intercellular signaling pathways that are potentially disrupted in the autism brains, suggesting that more studies examining cross-cell type effects can be valuable for understanding autism pathogenesis.

Keywords: Autism; Brain; Cell-cell communication; Ligand-receptor; Network; Single-cell RNA-seq.


Conflict of interest statement

The authors declare that they have no competing interests.

Figures

Fig. 1
Fig. 1
Change in communication between individual pairs of cell types in ASD. a Computational workflow of key analytic steps. b Difference in the total numbers of L-R interactions in ASD vs control PFC. c Difference in the total strengths of L-R interactions in ASD vs control PFC. d Difference in the total numbers of L-R interactions in ASD vs control ACC. e Difference in the total strengths of L-R interactions in ASD vs control PFC. In be, lines indicate the changes in individual pairs of cell types, with red for increase and blue for decrease in ASD. The thickness of the lines represents the extent of changes, with the maximal corresponding to 28 in b/d and 0.36 in c/e
Fig. 2
Fig. 2
Cell-cell communication patterns in PFC. The networks show the CellChat inferred latent patterns connecting cell groups sharing similar signaling pathways. The thickness of the water flow represents the relative contribution of the cell group or signaling pathway to a latent pattern; outgoing patterns for secreting cells in control (a) and ASD (b); incoming patterns of receiving cells in control (c) and ASD (d). Note that CellChat only includes main contributors in these plots, and cell types (e.g., Neu-NRGN-I) making small contributions are thus omitted
Fig. 3
Fig. 3
Comparison of pan-cell type signaling networks in PFC. a Pan-cell type relative information flow showing signaling pathways identified in ASD PFC and controls. The pathways with greater information flow in ASD or controls were in cyan or red, respectively, with black indicating no significant differences. b and c Dot plots showing the difference in relative contribution of each cell type to outgoing (b) or incoming (c) signaling in ASD vs controls. Signaling on the left (a) with no difference was not included in (b) or (c)
Fig. 4
Fig. 4
Heatmap for differential L-R interactions (y-axis) identified for individual pairs of cell types (x-axis) from the sample-by-sample approach
Fig. 5
Fig. 5
Chord diagrams plotting signaling strength differences between ASD and control PFC. The lines represent changes in L-R interaction strengths, with the statistically significantly different ones colored as intense red or blue, for increase or decrease in ASD, respectively. Light red or light blue for small changes not reaching statistical significance. Gray lines for no changes. Genes identified as differentially expressed in Velmeshev et al. [23] study were indicated in the corresponding cell type(s). The color bars in the inner circles indicates targeting cell types of the outgoing signaling while noncolor part for incoming signaling
Fig. 6
Fig. 6
Function enrichment analysis of genes in the dysregulated CCC signaling. a Dot plot showing the enriched GO terms. b Network connecting GO terms with sharing genes. Nodes are enriched GO terms, while the edges represent the extents of genes shared between two terms
Fig. 7
Fig. 7
Connection between brain disorder risk genes and genes in the dysregulated CCC signaling. a Protein interaction network connecting dysregulated CCC signaling genes (blue) and ASD risk genes (white) in SFARI database. b Dot plot showing overlapping results of dysregulated signaling genes with lists of genes implicated in different brain disorders
Fig. 8
Fig. 8
Connection between cell-type ASD-enriched pathways and dysregulated CCC signaling. Dot plot showing enriched pathways from GSEA for individual cell types, with red and blue for higher activities in ASD and control PFC, respectively. The right column lists the corresponding dysregulated signaling from CCC analysis

Similar articles

Cited by

References

    1. American Psychiatric Association . Highlights of changes from DSM-IV-TR to DSM-5. 2013.
    1. Maenner MJ, Shaw KA, Baio J, Washington A, Patrick M, DiRienzo M, et al. Prevalence of autism spectrum disorder among children aged 8 years-autism and developmental disabilities monitoring network, 11 sites, United States, 2016. MMWR Surveill Summ. 2020;69:1–12. doi: 10.15585/mmwr.ss6904a1. - DOI - PMC - PubMed
    1. Banerjee-Basu S, Packer A. SFARI gene: an evolving database for the autism research community. DMM Dis Model Mech. 2010;3:133–135. doi: 10.1242/dmm.005439. - DOI - PubMed
    1. Chen JA, Peñagarikano O, Belgard TG, Swarup V, Geschwind DH. The emerging picture of autism spectrum disorder: genetics and pathology. Annu Rev Pathol Mech Dis. 2015;10:111–144. doi: 10.1146/annurev-pathol-012414-040405. - DOI - PubMed
    1. Hormozdiari F, Penn O, Borenstein E, Eichler EE. The discovery of integrated gene networks for autism and related disorders. Genome Res. 2015;25:142. doi: 10.1101/gr.178855.114. - DOI - PMC - PubMed

Publication types