

Single-cell transcriptomic and chromatin accessibility analyses of dairy cattle peripheral blood mononuclear cells and their responses to lipopolysaccharide
- PMID: 35501711
- PMCID: PMC9063233
- DOI: 10.1186/s12864-022-08562-0
Single-cell transcriptomic and chromatin accessibility analyses of dairy cattle peripheral blood mononuclear cells and their responses to lipopolysaccharide
Abstract
Background: Gram-negative bacteria are important pathogens in cattle, causing severe infectious diseases, including mastitis. Lipopolysaccharides (LPS) are components of the outer membrane of Gram-negative bacteria and crucial mediators of chronic inflammation in cattle. LPS modulations of bovine immune responses have been studied before. However, the single-cell transcriptomic and chromatin accessibility analyses of bovine peripheral blood mononuclear cells (PBMCs) and their responses to LPS stimulation were never reported.
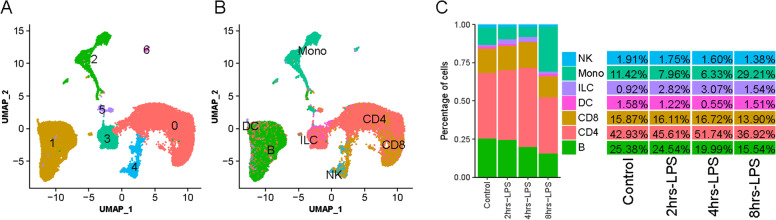
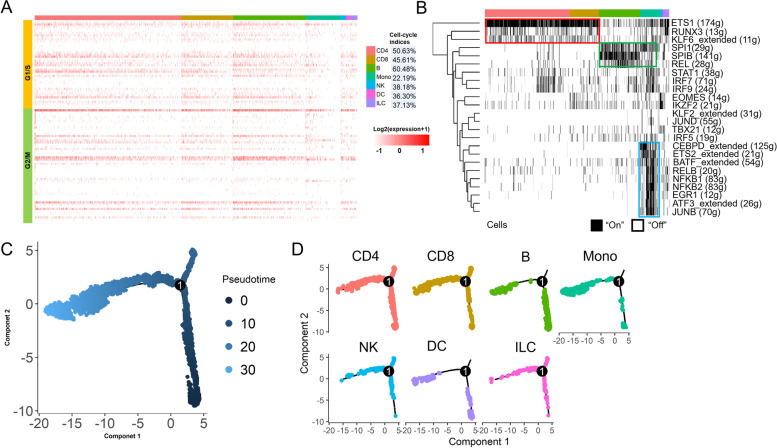
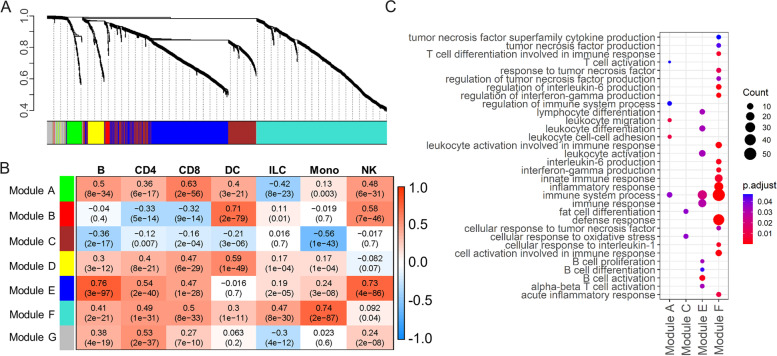
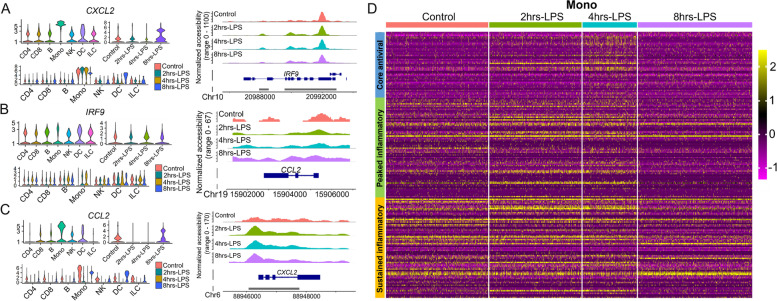
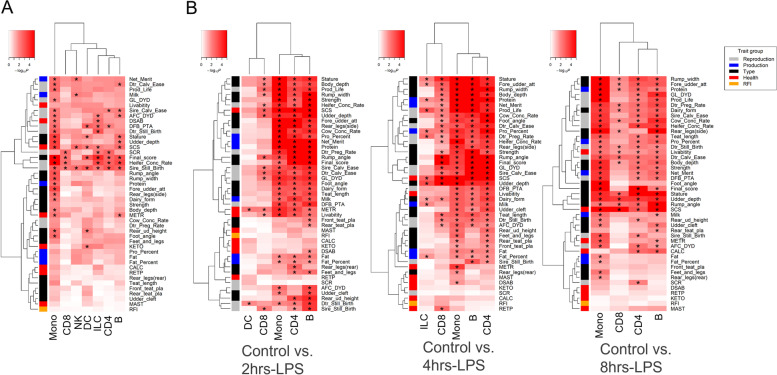
Results: We performed single-cell RNA sequencing (scRNA-seq) and single-cell sequencing assay for transposase-accessible chromatin (scATAC-seq) in bovine PBMCs before and after LPS treatment and demonstrated that seven major cell types, which included CD4 T cells, CD8 T cells, and B cells, monocytes, natural killer cells, innate lymphoid cells, and dendritic cells. Bioinformatic analyses indicated that LPS could increase PBMC cell cycle progression, cellular differentiation, and chromatin accessibility. Gene analyses further showed significant changes in differential expression, transcription factor binding site, gene ontology, and regulatory interactions during the PBMC responses to LPS. Consistent with the findings of previous studies, LPS induced activation of monocytes and dendritic cells, likely through their upregulated TLR4 receptor. NF-κB was observed to be activated by LPS and an increased transcription of an array of pro-inflammatory cytokines, in agreement that NF-κB is an LPS-responsive regulator of innate immune responses. In addition, by integrating LPS-induced differentially expressed genes (DEGs) with large-scale GWAS of 45 complex traits in Holstein, we detected trait-relevant cell types. We found that selected DEGs were significantly associated with immune-relevant health, milk production, and body conformation traits.
Conclusion: This study provided the first scRNAseq and scATAC-seq data for cattle PBMCs and their responses to the LPS stimulation to the best of our knowledge. These results should also serve as valuable resources for the future study of the bovine immune system and open the door for discoveries about immune cell roles in complex traits like mastitis at single-cell resolution.
Keywords: Cattle; Lipopolysaccharide; Peripheral blood mononuclear cell; Single-cell ATAC-seq; Single-cell RNA-seq.
© 2022. The Author(s).
Conflict of interest statement
All authors declare no potential conflict of interest.
Figures
Similar articles
-
The single-cell transcriptome and chromatin accessibility datasets of peripheral blood mononuclear cells in Chinese holstein cattle.BMC Genom Data. 2023 Aug 7;24(1):39. doi: 10.1186/s12863-023-01139-0. BMC Genom Data. 2023. PMID: 37550629 Free PMC article.
-
Epigenetic Landscapes of Single-Cell Chromatin Accessibility and Transcriptomic Immune Profiles of T Cells in COVID-19 Patients.Front Immunol. 2021 Feb 24;12:625881. doi: 10.3389/fimmu.2021.625881. eCollection 2021. Front Immunol. 2021. PMID: 33717140 Free PMC article.
-
Single-Cell RNA and ATAC Sequencing Reveal Hemodialysis-Related Immune Dysregulation of Circulating Immune Cell Subpopulations.Front Immunol. 2022 May 26;13:878226. doi: 10.3389/fimmu.2022.878226. eCollection 2022. Front Immunol. 2022. PMID: 35720370 Free PMC article.
-
Docosahexaenoic acid attenuates LPS-stimulated inflammatory response by regulating the PPARγ/NF-κB pathways in primary bovine mammary epithelial cells.Res Vet Sci. 2017 Jun;112:7-12. doi: 10.1016/j.rvsc.2016.12.011. Epub 2017 Jan 5. Res Vet Sci. 2017. PMID: 28095338 Review.
-
Probing infectious disease by single-cell RNA sequencing: Progresses and perspectives.Comput Struct Biotechnol J. 2020;18:2962-2971. doi: 10.1016/j.csbj.2020.10.016. Epub 2020 Oct 21. Comput Struct Biotechnol J. 2020. PMID: 33106757 Free PMC article. Review.
Cited by
-
Profiling the immune epigenome across global cattle breeds.Genome Biol. 2023 May 22;24(1):127. doi: 10.1186/s13059-023-02964-3. Genome Biol. 2023. PMID: 37218021 Free PMC article.
-
Alterations of the IKZF1-IKZF2 tandem in immune cells of schizophrenia patients regulate associated phenotypes.J Neuroinflammation. 2024 Dec 18;21(1):326. doi: 10.1186/s12974-024-03320-3. J Neuroinflammation. 2024. PMID: 39695786 Free PMC article.
-
PD-1 is conserved from sharks to humans: new insights into PD-1, PD-L1, PD-L2, and SHP-2 evolution.Front Immunol. 2025 May 28;16:1573492. doi: 10.3389/fimmu.2025.1573492. eCollection 2025. Front Immunol. 2025. PMID: 40503235 Free PMC article.
-
Comparative transcriptome analyses of immune responses to LPS in peripheral blood mononuclear cells from the giant panda, human, mouse, and monkey.Front Genet. 2023 Jan 6;13:1053655. doi: 10.3389/fgene.2022.1053655. eCollection 2022. Front Genet. 2023. PMID: 36685921 Free PMC article.
-
Gut microbiome is linked to functions of peripheral immune cells in transition cows during excessive lipolysis.Microbiome. 2023 Mar 3;11(1):40. doi: 10.1186/s40168-023-01492-3. Microbiome. 2023. PMID: 36869370 Free PMC article.
References
MeSH terms
Substances
Grants and funding
- 2019B10018/Agricultural Scientific and Technological Innovation Project of Shandong Academy of Agricultural Sciences (Cxgc2016A04)
- 801215/the Marie Skłodowska-Curie grant agreement
- HDR-9004/HDR-UK award
- US-4997-17/US-Israel Binational Agricultural Research and Development (BARD
- 2016-67015-24886 and 2019-67015-29321/USDA National Institute of Food and Agriculture (NIFA) Agriculture and Food Research Initiative
LinkOut - more resources
Full Text Sources
Molecular Biology Databases
Research Materials
