

Development of an objectively measured walkability index for the Netherlands
- PMID: 35501815
- PMCID: PMC9063284
- DOI: 10.1186/s12966-022-01270-8
Development of an objectively measured walkability index for the Netherlands
Abstract
Background: Walkability indices have been developed and linked to behavioural and health outcomes elsewhere in the world, but not comprehensively for Europe. We aimed to 1) develop a theory-based and evidence-informed Dutch walkability index, 2) examine its cross-sectional associations with total and purpose-specific walking behaviours of adults across socioeconomic (SES) and urbanisation strata, 3) explore which walkability components drive these associations.
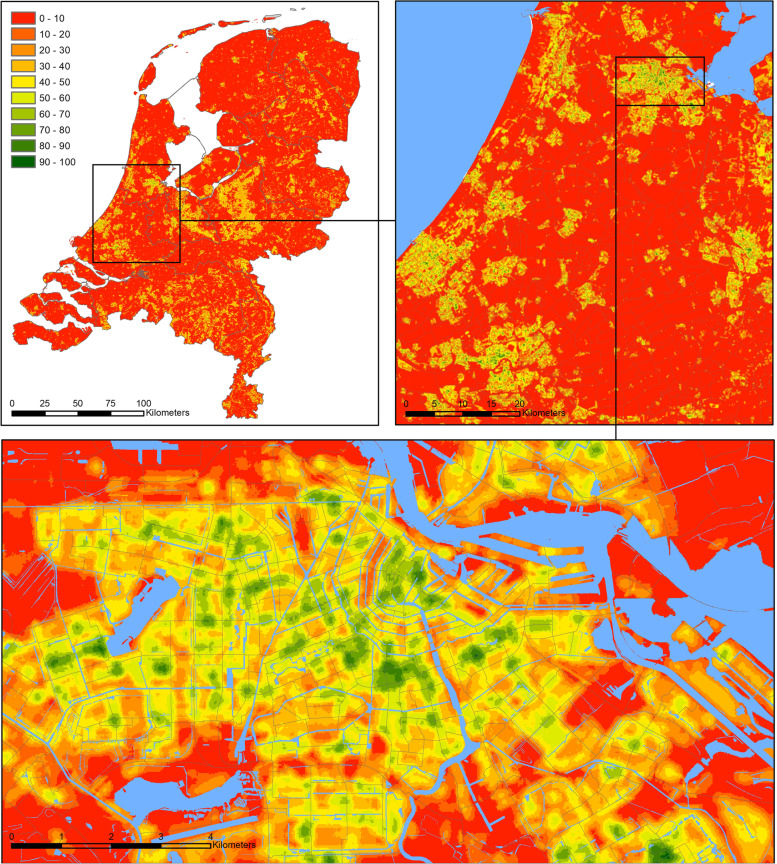
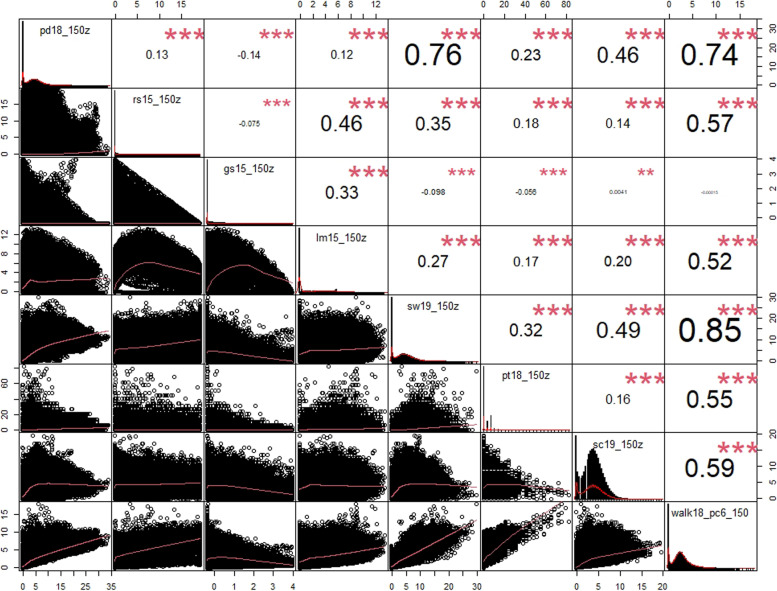
Methods: Components of the index included: population density, retail and service density, land use mix, street connectivity, green space, sidewalk density and public transport density. Each of the seven components was calculated for three Euclidean buffers: 150 m, 500 m and 1000 m around every 6-digit postal code location and for every administrative neighbourhood in GIS. Componential z-scores were averaged, and final indices normalized between 0 and 100. Data on self-reported demographic characteristics and walking behaviours of 16,055 adult respondents (aged 18-65) were extracted from the Dutch National Travel Survey 2017. Using Tobit regression modelling adjusted for individual- and household-level confounders, we assessed the associations between walkability and minutes walking in total, for non-discretionary and discretionary purposes. By assessing the attenuation in associations between partial indices and walking outcomes, we identified which of the seven components drive these associations. We also tested for effect modification by urbanization degree, SES, age and sex.
Results: In fully adjusted models, a 10% increase in walkability was associated with a maximum increase of 8.5 min of total walking per day (95%CI: 7.1-9.9). This association was consistent across buffer sizes and purposes of walking. Public transport density was driving the index's association with walking outcomes. Stratified results showed that associations with minutes of non-discretionary walking were stronger in rural compared to very urban areas, in neighbourhoods with low SES compared to high SES, and in middle-aged (36-49 years) compared to young (18-35 years old) and older adults (50-65 years old).
Conclusions: The walkability index was cross-sectionally associated with Dutch adult's walking behaviours, indicating its validity for further use in research.
Keywords: Built environment; Physical activity; Transport; Validation; Walkability.
© 2022. The Author(s).
Conflict of interest statement
The authors declare that they have no competing interests.
Figures
Similar articles
-
Associations of changes in neighbourhood walkability with changes in walking activity in older adults: a fixed effects analysis.BMC Public Health. 2021 Jul 6;21(1):1323. doi: 10.1186/s12889-021-11368-6. BMC Public Health. 2021. PMID: 34225681 Free PMC article.
-
Neighbourhood walkability, daily steps and utilitarian walking in Canadian adults.BMJ Open. 2015 Nov 24;5(11):e008964. doi: 10.1136/bmjopen-2015-008964. BMJ Open. 2015. PMID: 26603246 Free PMC article.
-
Cross-sectional and longitudinal associations between the built environment and walking: effect modification by socioeconomic status.BMC Public Health. 2022 Jun 21;22(1):1233. doi: 10.1186/s12889-022-13611-0. BMC Public Health. 2022. PMID: 35729509 Free PMC article.
-
How different are objective operationalizations of walkability for older adults compared to the general population? A systematic review.BMC Geriatr. 2022 Aug 15;22(1):673. doi: 10.1186/s12877-022-03233-x. BMC Geriatr. 2022. PMID: 35971086 Free PMC article.
-
Evidence synthesis - A systematized literature review on the associations between neighbourhood built characteristics and walking among Canadian adults.Health Promot Chronic Dis Prev Can. 2019 Jan;39(1):1-14. doi: 10.24095/hpcdp.39.1.01. Health Promot Chronic Dis Prev Can. 2019. PMID: 30652838 Free PMC article.
Cited by
-
Health equity in urban and rural settings: implementation of the place standard tool in Spain.Front Public Health. 2024 May 9;12:1292032. doi: 10.3389/fpubh.2024.1292032. eCollection 2024. Front Public Health. 2024. PMID: 38803816 Free PMC article.
-
Physical Activity Friendliness of Neighborhoods: Do Subjective and Objective Measures Correspond Within a Mid-Sized Dutch Town?Int J Environ Res Public Health. 2025 Apr 1;22(4):536. doi: 10.3390/ijerph22040536. Int J Environ Res Public Health. 2025. PMID: 40283761 Free PMC article.
-
Associations of neighborhood social cohesion and changes in BMI-The Maastricht Study.Eur J Public Health. 2024 Oct 1;34(5):949-954. doi: 10.1093/eurpub/ckae109. Eur J Public Health. 2024. PMID: 38942603 Free PMC article.
-
The impact of interventions in the built environment on physical activity levels: a systematic umbrella review.Int J Behav Nutr Phys Act. 2022 Dec 20;19(1):156. doi: 10.1186/s12966-022-01399-6. Int J Behav Nutr Phys Act. 2022. PMID: 36550583 Free PMC article.
-
Is Walk Score a useful tool for measuring walkability in rural communities?J Rural Health. 2025 Mar;41(2):e12895. doi: 10.1111/jrh.12895. Epub 2024 Nov 9. J Rural Health. 2025. PMID: 39520249 Free PMC article. No abstract available.
References
-
- Hamer M, Chida Y. Walking and primary prevention: a meta-analysis of prospective cohort studies. Br J Sports Med. 2008;42:238–43. Available from: http://bjsm.bmj.com/content/vol42/issue4. - PubMed
-
- Kelly P, Kahlmeier S, Götschi T, Orsini N, Richards J, Roberts N, et al. Systematic review and meta-analysis of reduction in all-cause mortality from walking and cycling and shape of dose response relationship. Int J Behav Nutr Phys Act. 2014;11(1). Available from: http://www.ijbnpa.org/content/11/1/132 - PMC - PubMed
-
- Giles-Corti B, Donovan RJ. The relative influence of individual, social and physical environment determinants of physical activity. Soc Sci Med. 2002;54(12):1793–812. Available from: https://pubmed.ncbi.nlm.nih.gov/12113436/. Accessed 19 May 2021. - PubMed
Publication types
MeSH terms
LinkOut - more resources
Full Text Sources
