

Enhancer transcription detected in the nascent transcriptomic landscape of bread wheat
- PMID: 35501845
- PMCID: PMC9063354
- DOI: 10.1186/s13059-022-02675-1
Enhancer transcription detected in the nascent transcriptomic landscape of bread wheat
Abstract
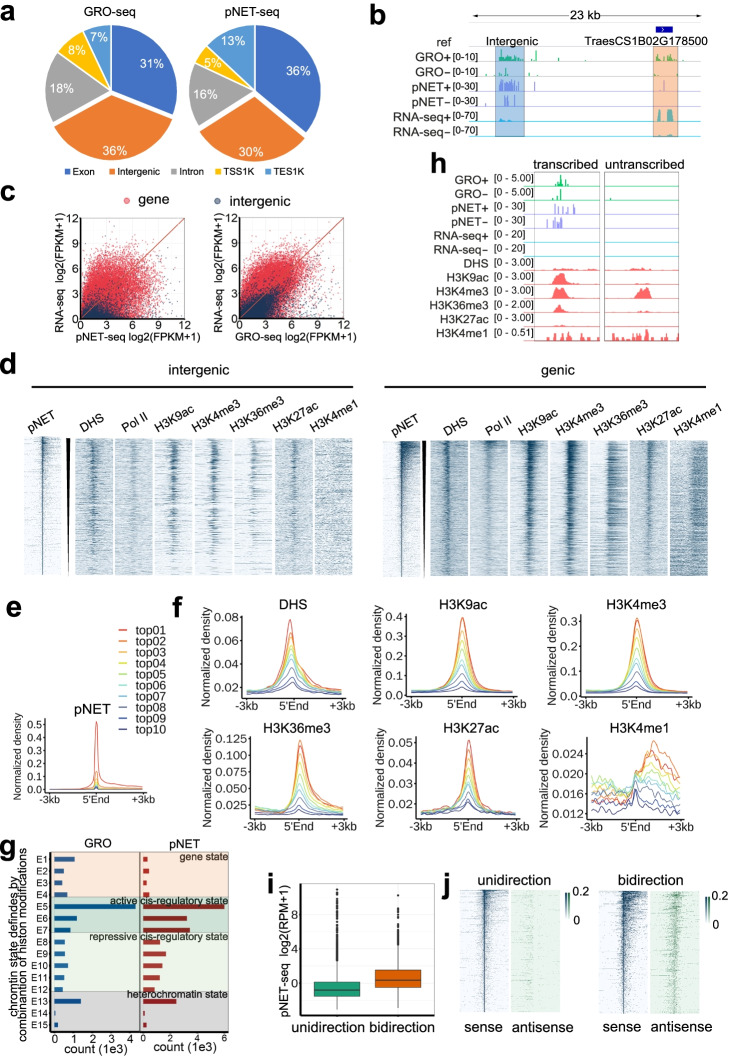
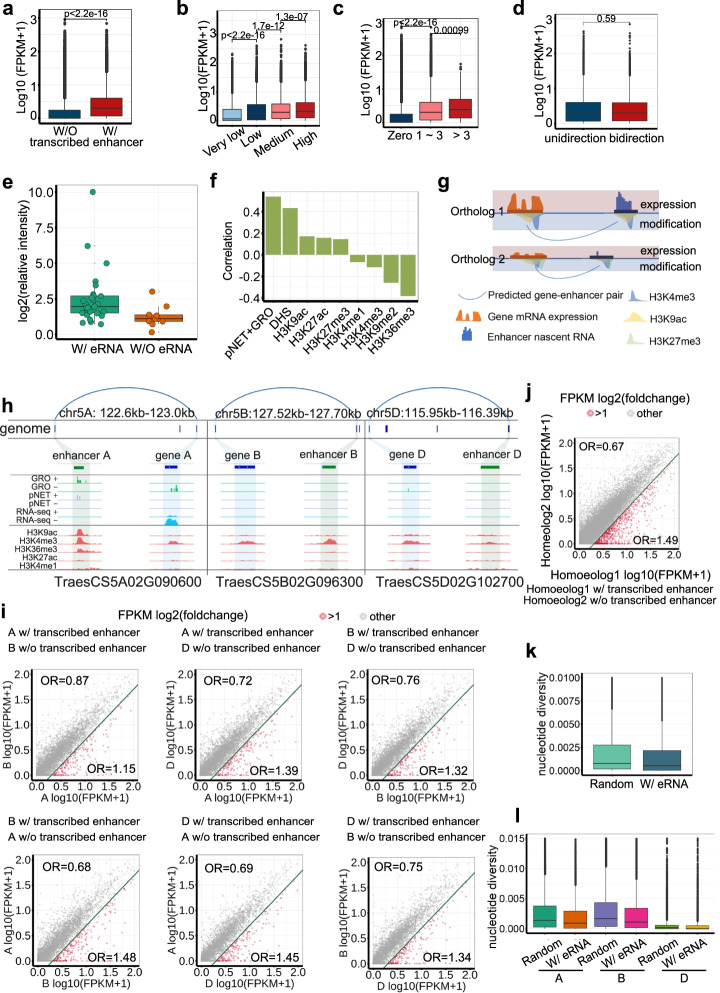
The precise spatiotemporal gene expression is orchestrated by enhancers that lack general sequence features and thus are difficult to be computationally identified. By nascent RNA sequencing combined with epigenome profiling, we detect active transcription of enhancers from the complex bread wheat genome. We find that genes associated with transcriptional enhancers are expressed at significantly higher levels, and enhancer RNA is more precise and robust in predicting enhancer activity compared to chromatin features. We demonstrate that sub-genome-biased enhancer transcription could drive sub-genome-biased gene expression. This study highlights enhancer transcription as a hallmark in regulating gene expression in wheat.
Keywords: Bread wheat; Enhancer; Nascent RNA; Subgenome-bias; eRNA.
© 2022. The Author(s).
Conflict of interest statement
The authors declare that they have no competing interests.
Figures
Similar articles
-
The bread wheat epigenomic map reveals distinct chromatin architectural and evolutionary features of functional genetic elements.Genome Biol. 2019 Jul 15;20(1):139. doi: 10.1186/s13059-019-1746-8. Genome Biol. 2019. PMID: 31307500 Free PMC article.
-
Protocol for affordable and efficient profiling of nascent RNAs in bread wheat using GRO-seq.STAR Protoc. 2022 Sep 16;3(3):101657. doi: 10.1016/j.xpro.2022.101657. Epub 2022 Sep 2. STAR Protoc. 2022. PMID: 36097381 Free PMC article.
-
Genome interplay in the grain transcriptome of hexaploid bread wheat.Science. 2014 Jul 18;345(6194):1250091. doi: 10.1126/science.1250091. Science. 2014. PMID: 25035498
-
Making the Bread: Insights from Newly Synthesized Allohexaploid Wheat.Mol Plant. 2015 Jun;8(6):847-59. doi: 10.1016/j.molp.2015.02.016. Epub 2015 Mar 5. Mol Plant. 2015. PMID: 25747845 Review.
-
Diversity and Emerging Roles of Enhancer RNA in Regulation of Gene Expression and Cell Fate.Front Cell Dev Biol. 2020 Jan 14;7:377. doi: 10.3389/fcell.2019.00377. eCollection 2019. Front Cell Dev Biol. 2020. PMID: 31993419 Free PMC article. Review.
Cited by
-
Interplay between coding and non-coding regulation drives the Arabidopsis seed-to-seedling transition.Nat Commun. 2024 Feb 26;15(1):1724. doi: 10.1038/s41467-024-46082-5. Nat Commun. 2024. PMID: 38409232 Free PMC article.
-
Comparison of transcriptional activity profiling by metabolic labeling or nuclear RNA sequencing.Plant J. 2025 Aug;123(3):e70401. doi: 10.1111/tpj.70401. Plant J. 2025. PMID: 40795170 Free PMC article.
-
The Enhancer-Promoter-Mediated Wnt8a Transcription During Neurite Regrowth of Injured Cortical Neurons.Cells. 2025 Feb 20;14(5):319. doi: 10.3390/cells14050319. Cells. 2025. PMID: 40072048 Free PMC article.
-
Transcriptional regulation mechanism of PARP1 and its application in disease treatment.Epigenetics Chromatin. 2024 Aug 8;17(1):26. doi: 10.1186/s13072-024-00550-w. Epigenetics Chromatin. 2024. PMID: 39118189 Free PMC article. Review.
-
Integrative Multi-Omics Approaches for Identifying and Characterizing Biological Elements in Crop Traits: Current Progress and Future Prospects.Int J Mol Sci. 2025 Feb 10;26(4):1466. doi: 10.3390/ijms26041466. Int J Mol Sci. 2025. PMID: 40003933 Free PMC article. Review.
References
-
- International Wheat Genome Sequencing C, investigators IRp. Appels R, Eversole K, Feuillet C, Keller B, Rogers J, Stein N, investigators Iw-gap. Pozniak CJ, et al. Shifting the limits in wheat research and breeding using a fully annotated reference genome. Science. 2018;361:eaar7191. doi: 10.1126/science.aar7191. - DOI - PubMed
Publication types
MeSH terms
Substances
LinkOut - more resources
Full Text Sources
Other Literature Sources
Molecular Biology Databases
