

Frequency of flash glucose monitoring and glucose metrics: real-world observational data from Saudi Arabia
- PMID: 35501880
- PMCID: PMC9063302
- DOI: 10.1186/s13098-022-00831-y
Frequency of flash glucose monitoring and glucose metrics: real-world observational data from Saudi Arabia
Abstract
Background: This real-world data study analyzed glucose metrics from FreeStyle Libre® flash glucose monitoring in relation to scanning frequency, time in range (TIR) and estimated A1c (eA1c) in Saudi Arabia.
Methods: Anonymized reader data were analyzed according to scanning frequency quartiles, eA1c categories (<7%,≥7%‒≤9% or>9%) and TIR categories (<50%,≥50%‒≤70% or>70%). Sensors, grouped by reader, were required to have≥120 h of operation. Differences in scanning frequency, eA1c, TIR, time in hypoglycemia and hyperglycemia, and glucose variability (standard deviation [SD] and coefficient of variation [CV]) were analyzed between groups.
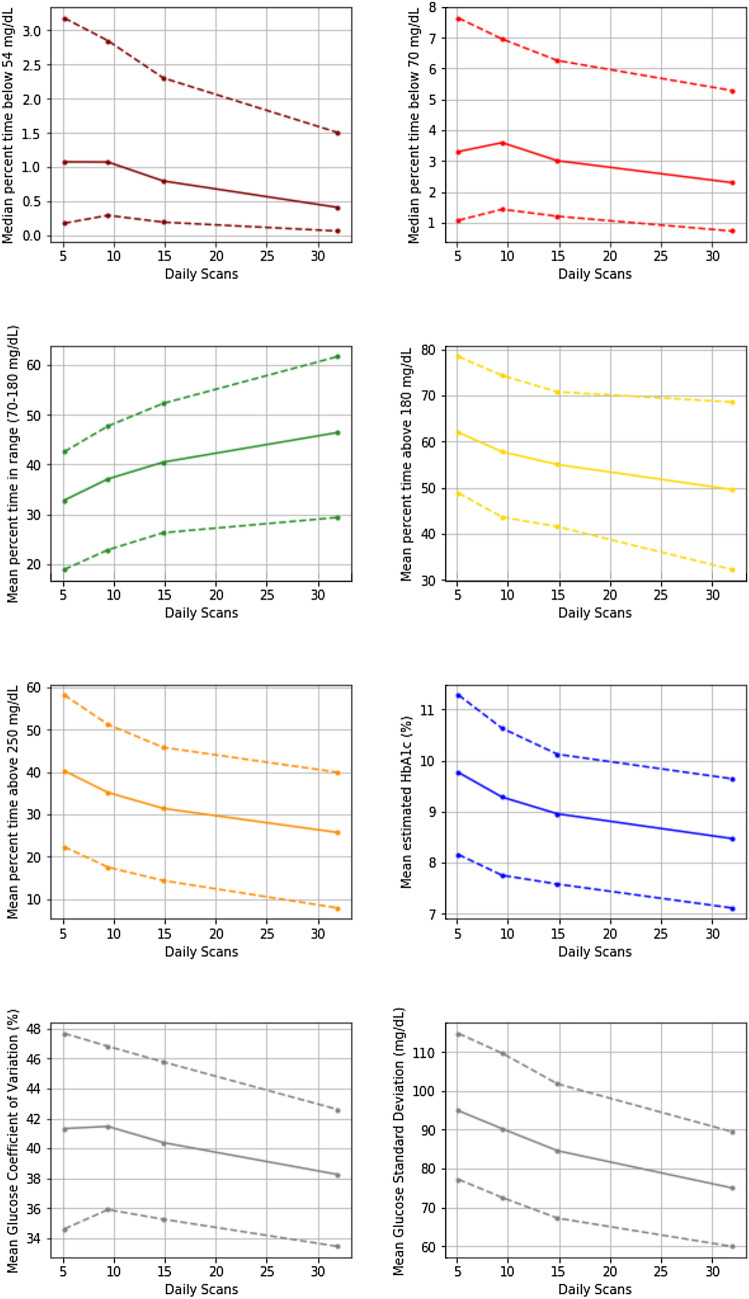
Results: 6097 readers, 35,747 sensors, and 40 million automatic glucose measurements were analyzed. Patients in the highest scanning frequency quartile (Q4, mean 32.0 scans/day) had lower eA1c (8.47%), greater TIR (46.4%) and lower glucose variation (SD 75.0 mg/dL, CV 38.2%) compared to the lowest quartile (Q1, mean 5.2 scans/day; eA1c 9.77%, TIR 32.8%, SD 94.9 mg/dL, CV 41.3%). Lower eA1c and higher TIR were associated with greater scanning frequency, lower glucose variability and less time in hyperglycemia.
Conclusions: Higher scanning frequency in flash glucose users from Saudi Arabia is associated with lower eA1c, higher TIR, lower glucose variability and less time in hypoglycemia or hyperglycemia.
Keywords: Flash glucose monitoring; FreeStyle Libre®; Real-world data.
© 2022. The Author(s).
Conflict of interest statement
Timothy C. Dunn, Kalvin Kao, Laura Brandner, and Manal El Jammal are employees of Abbott Diabetes Care. Mohammad Y. Al-Harbi, Abdulhameed Albunyan, and Ahmed Alnahari report no conflicts of interest.
Figures
Similar articles
-
Flash Glucose Monitoring in Israel: Understanding Real-World Associations between Self-Monitoring Frequency and Metrics of Glycemic Control.Endocr Pract. 2022 May;28(5):472-478. doi: 10.1016/j.eprac.2022.02.004. Epub 2022 Feb 12. Endocr Pract. 2022. PMID: 35167952
-
Real world hypoglycaemia related to glucose variability and Flash glucose scan frequency assessed from global FreeStyle Libre data.Diabetes Obes Metab. 2022 Nov;24(11):2102-2107. doi: 10.1111/dom.14795. Epub 2022 Jul 7. Diabetes Obes Metab. 2022. PMID: 35695037 Free PMC article.
-
Real-world flash glucose monitoring in Brazil: can sensors make a difference in diabetes management in developing countries?Diabetol Metab Syndr. 2020 Jan 7;12:3. doi: 10.1186/s13098-019-0513-z. eCollection 2020. Diabetol Metab Syndr. 2020. PMID: 31921360 Free PMC article.
-
Association between scanning frequency of flash glucose monitoring and continuous glucose monitoring-derived glycemic makers in children and adolescents with type 1 diabetes.Pediatr Int. 2021 Feb;63(2):154-159. doi: 10.1111/ped.14412. Epub 2021 Feb 15. Pediatr Int. 2021. PMID: 32744360
-
Approach to Using Trend Arrows in the FreeStyle Libre Flash Glucose Monitoring Systems in Adults.J Endocr Soc. 2018 Nov 14;2(12):1320-1337. doi: 10.1210/js.2018-00294. eCollection 2018 Dec 1. J Endocr Soc. 2018. PMID: 30474069 Free PMC article. Review.
Cited by
-
Association of scan frequency with CGM-derived metrics and influential factors in adults with type 1 diabetes mellitus.Diabetol Int. 2023 Sep 12;15(1):109-116. doi: 10.1007/s13340-023-00655-9. eCollection 2024 Jan. Diabetol Int. 2023. PMID: 38264231 Free PMC article.
-
Adherence to glucose monitoring with intermittently scanned continuous glucose monitoring in patients with type 1 diabetes.Endocrine. 2023 Mar;79(3):477-483. doi: 10.1007/s12020-022-03288-1. Epub 2022 Dec 27. Endocrine. 2023. PMID: 36574148 Free PMC article.
-
Assessment of Patient-reported Satisfaction and Metabolic Outcomes Following Initiation of the Second Generation of Flash Glucose Monitoring in Patients with Type 1 Diabetes.Curr Diabetes Rev. 2024;20(4):e100823219628. doi: 10.2174/1573399820666230810123504. Curr Diabetes Rev. 2024. PMID: 37563819
-
The Relationship Between Hemoglobin A1c, Time in Range, and Glycemic Management Indicator in Patients With Type 1 and Type 2 Diabetes in a Tertiary Care Hospital in Saudi Arabia.Cureus. 2024 Jul 6;16(7):e63947. doi: 10.7759/cureus.63947. eCollection 2024 Jul. Cureus. 2024. PMID: 39105008 Free PMC article.
References
-
- Mokdad AH, et al. Cost of diabetes in the Kingdom of Saudi Arabia, 2014. J Diabetes Metab. 2015;6(8):1000575.
-
- Fowler MJ. Microvascular and macrovascular complications of diabetes. Clinical Diabetes. 2008;26(2):77–82. doi: 10.2337/diaclin.26.2.77. - DOI
LinkOut - more resources
Full Text Sources
