. 2022 May 3;11(1):26.
doi: 10.1186/s40035-022-00300-6.

Parvalbumin neuroplasticity compensates for somatostatin impairment, maintaining cognitive function in Alzheimer's disease

Affiliations

Parvalbumin neuroplasticity compensates for somatostatin impairment, maintaining cognitive function in Alzheimer's disease

Christopher Daniel Morrone et al. Transl Neurodegener. .

Abstract

Background: Patient-to-patient variability in the degree to which β-amyloid, tau and neurodegeneration impact cognitive decline in Alzheimer's disease (AD) complicates disease modeling and treatment. However, the underlying mechanisms leading to cognitive resilience are not resolved. We hypothesize that the variability in cognitive function and loss relates to neuronal resilience of the hippocampal GABAergic network.

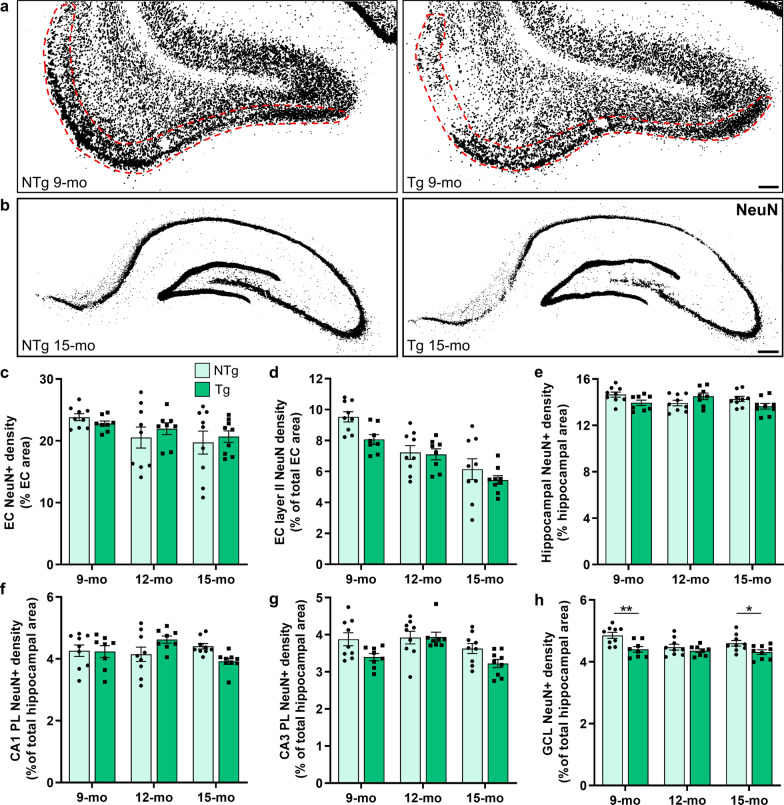
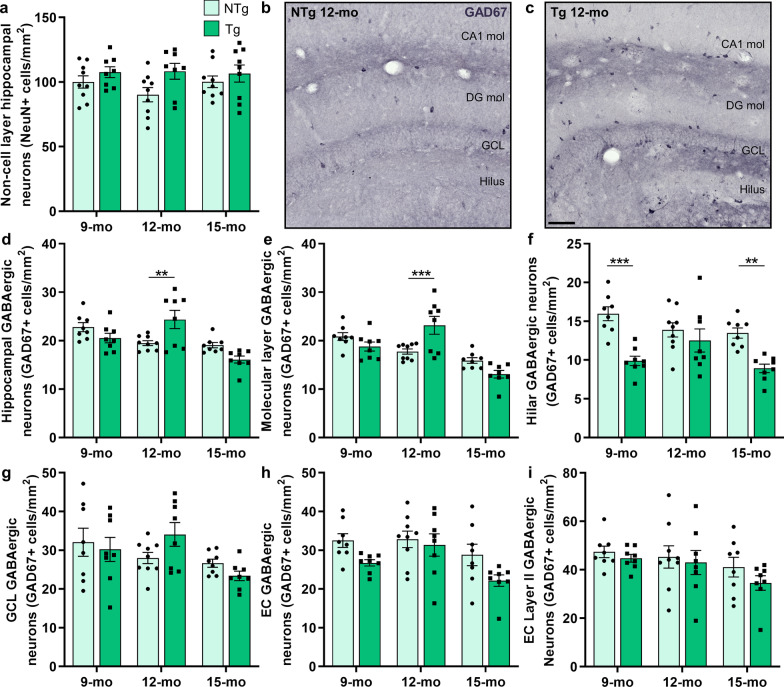
Methods: We compared TgF344-AD and non-transgenic littermate rats at 9, 12, and 15 months of age. Neurons, β-amyloid plaques and tau inclusions were quantified in hippocampus and entorhinal cortex. Somatostatin (SST) and parvalbumin (PVB) interneurons were traced to examine hippocampal neuroplasticity and cognition was tested in the Barnes maze.

Results: The 9-month-old TgF344-AD rats exhibited loss of neurons in the entorhinal cortex and hippocampus. Hippocampal neuronal compensation was observed in 12-month TgF344-AD rats, with upregulation of GABAergic interneuronal marker. By 15 months, the TgF344-AD rats had robust loss of excitatory and inhibitory neurons. β-Amyloid and tau pathology accumulated continuously across age. SST interneurons exhibited tau inclusions and atrophy from 9 months, whereas PVB interneurons were resilient until 15 months. The hippocampal PVB circuit underwent neuroplastic reorganization with increased dendritic length and complexity in 9- and 12-month-old TgF344-AD rats, before atrophy at 15 months. Strikingly, 12-month-old TgF344-AD rats were resilient in executive function and cognitive flexibility. Cognitive resilience in TgF344-AD rats occurred as maintenance of function between 9 and 12 months of age despite progressive spatial memory deficits, and was sustained by PVB neuroplasticity.

Conclusions: Our results demonstrate the inherent neuronal processes leading to cognitive maintenance, and describe a novel finding of endogenous cognitive resilience in an AD model.

Keywords: Alzheimer’s disease; Barnes maze; Cognitive resilience; GABAergic interneuron; Hippocampus; Neuronal compensation; Parvalbumin; Somatostatin; TgF344-AD rat.


Conflict of interest statement

The authors declare that they have no competing interests.

Figures

Fig. 1
Fig. 1
Early-stage neuronal loss precedes hippocampal neuronal compensation at 12 months, before robust decline. To assess neuronal loss in TgF344-AD rats, entorhinal cortical (EC) and hippocampal neurons were quantified by NeuN+ staining in NTg and TgF344-AD rats at 9, 12 and 15 months of age (n = 8–9 rats/genotype/age). a Representative NeuN+ staining in 9-month-old NTg and Tg rats demonstrates a loss of EC layer II neurons in TgF344-AD rats (red outline). b In the hippocampus, NeuN staining at 15 months demonstrates thinning of pyramidal and granular cell layers in Tg rats. c No significant genotype differences were detected at any age in the total EC neurons. d Tg rats exhibited a significant overall deficit (P = 0.03) in layer II EC neurons. e, f There were significant age × genotype interactive effects (both P = 0.02) on the total hippocampal neurons and the CA1 pyramidal layer (PL) neurons. The Tg rats exhibited an overall significant loss of g CA3 PL neurons (P = 0.02) and h DG granular cell layer (GCL) neurons (P = 0.0002), notably at 9 and 15 months. Scale bars, 200 μm (a) and 400 μm (b). Data are mean ± SEM; two-way ANOVA with correction for multiple comparisons with a Holm-Sidak post hoc test (see Table 1 for complete statistics); *P < 0.05, **P < 0.01
Fig. 2
Fig. 2
Resilience of GABAergic interneurons in TgF344-AD rats at 12 months of age. We probed neurons within the hippocampal molecular layers to determine if this population underlies the neuronal changes in TgF344-AD rats at 9, 12, and 15 months of age (n = 8–9 rats/genotype at each age). a Tg rats exhibited a significant overall genotype-related increase (P = 0.02) in non-cell layer NeuN+ neurons. To phenotype these cells, hippocampal GABAergic interneurons were assessed by GAD67 staining. b and c Representative hippocampal GAD67 staining in 12-month NTg and Tg rats demonstrates increased interneurons primarily in Tg hilus and molecular layers of CA1 and DG. Quantification of total hippocampal (d) and molecular-layer (e) GABAergic interneurons determined a significant increase in 12-month Tgs. f A large deficit was detected in hilar GABAergic interneurons in 9- and 15-month Tgs, but not at 12 months. g There were no significant genotype differences in GAD67 neurons in the granular cell layer (GCL). h Tg rats exhibited an overall significant loss of total EC GABAergic interneurons (P = 0.01) in the entorhinal cortex (EC), compared to NTgs. i Finally, there was no genotype-related loss of EC layer II GABAergic interneurons. Scale bar, 100 μm. Data are mean ± SEM; two-way ANOVA with correction for multiple comparisons with a Holm-Sidak post hoc test (see Table 2 for complete statistics); **P < 0.01, ***P < 0.001
Fig. 3
Fig. 3
Linear Aβ deposition and exponential tau accumulation across disease progression in TgF344-AD rats. Aβ and tau pathology were assessed in the hippocampus (HP) and entorhinal cortex (EC) of 9-, 12- and 15-month-old TgF344-AD rats (n = 5–6 rats/age). a Representative HP and EC images of 6F3D staining for Aβ demonstrate extensive plaque coverage at 15 months of age. b PHF1 staining indicates dystrophic neurites [plaque-associated (PA)] and tangle inclusions [non-plaque-associated (NPA); inset] of hyperphosphorylated tau. c Quantification of plaque coverage in HP and EC demonstrates linear accumulation of Aβ across age. NPA (d) and PA (e) tau inclusions also increased with age but in an exponential manner, notably between 12 and 15 months of age, and to a significantly greater degree in EC than HP. f Quantification of PA inclusions per plaque in CA1, DG and EC determined significant effects of age and region on plaque area covered by tau dystrophic neurites (n = 30 plaques/region in each cohort of 5 rats/age). Significantly greater plaque area was covered by tau inclusions in EC compared to DG and CA1 at all ages, and DG compared to CA1 at 9 and 12 months. g Linear relationship between plaque size and number of tau-positive dystrophic neurites, demonstrating significantly more neurites per plaque with age, most prominently at 15 months (9-month: Y = 0.003 X + 4.52; 12-month: Y = 0.004 X + 6.15; 15-month: Y = 0.009 X + 2.57; n = 90 plaques in each cohort of 5 rats/age). Scale bars, 200 μm (a) and 20 μm (b). Data are mean ± SEM (f) or 95% confidence intervals (c–e, g); two-way ANOVA with Holm-Sidak post hoc test (f), linear regression (c, g), non-linear exponential growth regression (d, e); *P < 0.05, **P < 0.01, ***P < 0.001
Fig. 4
Fig. 4
Early-stage tau and Aβ disrupt hippocampal somatostatin interneurons, while parvalbumin cells are spared until 15 months. We assessed the accumulation of tau pathology within hippocampal interneurons of 9-, 12- and 15-month-old TgF344-AD rats, by co-localization of PHF1 with GABAergic subtypes: PVB and SST (representative images from n = 6–12 sections/group). a No co-localization was detected between PHF1 and PVB at 9 and 12 months of age. At 15 months, hippocampal PVB neurons exhibited cytoplasmic tau accumulation (white arrows). b Conversely, hippocampal SST interneurons exhibited cytoplasmic (white arrows), and less commonly dendritic PHF1 staining at as early as 9 months of age. c Quantification of SST+/PHF1+ co-localization at 9, 12 and 15 months of age, and PVB+/PHF1+ co-localization at 15 months in Tg rats showed significant increases in SST-tau pathology over age, and more affected cells than PVB-tau at 15 months. d Compared to NTg, the 15-month-old Tg rats had a visually degenerative hippocampal SST network with stunted processes, and cell bodies that clustered around Aβ plaques (yellow arrowheads). e The percentage of dystrophic SST neurons (quantified as plaque-associated) significantly increases with age in Tg rats. f Quantification of dendritic length from SST neuronal traces showed overall significant genotype differences in CA1 (P = 0.02). g In the DG, Tg rats exhibited a significant loss in SST dendritic length at all 3 ages. Scale bars, 20 μm (a, b) and 100 μm (c). Data are mean ± SEM (c, e: n = 3 rats/age, 6 hippocampi/rat; f, g: from n = 16 cells/cohort, sampled across 4 rats/genotype at each age); one-way (c and e) and two-way (f and g) ANOVA with correction for multiple comparisons with a Holm-Sidak post hoc test; *P < 0.05; ***P < 0.001
Fig. 5
Fig. 5
Compensatory hippocampal parvalbumin remodeling in TgF344-AD rats. We hypothesized that the hippocampal PVB network would undergo neuroplastic reorganization in TgF344-AD rats, coinciding with GABAergic compensation. We assessed PVB (green) staining in 9-, 12- and 15-month-old NTg and Tg rats (representative images from n = 6 rats/genotype at each age). At 9 months, compared to NTgs (a), Tg (b) rats exhibited increased PVB staining, with greater complexity of processes. c, d At 12 months of age, the overall PVB staining density was decreased; however, the Tg (d) rats exhibited increased complexity in the DG. e, f At 15 months of age, there was a robust loss of PVB staining density and complexity in Tg rats throughout the hippocampus, compared to NTg rats and compared to younger ages. g Quantification of dendritic length from CA1 PVB neuronal traces showed significantly longer dendrites in Tg rats at 9 months, no differences at 12 months, and a loss at 15 months of age, compared to NTgs. h In the DG, Tg PVB neurons exhibited significantly increased dendritic length at 9 and 12 months of age and reduced dendritic length at 15 months compared to NTgs. Scale bars, 200 μm (whole hippocampus) and 50 μm (CA1/DG). Data are mean ± SEM (from n = 16 cells/cohort, sampled across 4 rats/genotype at each age); two-way ANOVA with correction for multiple comparisons with a Holm-Sidak post hoc test; **P < 0.01
Fig. 6
Fig. 6
Dense parvalbumin dendritic connective zone in TgF344-AD rats in contrast with atrophic somatostatin interneurons. We further probed the hippocampal GABAergic network in TgF344-AD rats through neuronal tracing with Sholl analyses to determine the dendritic complexity (branching intersections by distance from soma). SST and PVB neurons were assessed in CA1 and DG in NTgs and Tgs at 9, 12 and 15 months of age. No significant differences were detected in CA1 SST dendritic complexity at 9 (a, b) and 12 months (c), but there was a loss of complexity in 15-month-old Tgs (d). eh In the DG, Tg SST interneurons had decreased intersections at all ages, indicative of vast neuronal atrophy. il For CA1 PVB interneurons, increased dendritic complexity was detected in Tgs at 9 months (i and j) and 12 months (significant genotype × distance interaction: P = 0.03; k), but the dendritic complexity was decreased compared to NTgs at 15 months (l). Notably, the DG PVB neurons of Tg rats exhibited a large increase in dendritic complexity near cell somas at 9 (m and n) and 12 months (o), and a robust loss of complexity at 15 months (p), compared to NTgs. a, e, i, and m Representative neuronal traces at 9 months demonstrate no change in CA1 SST, decreased DG SST dendritic length and complexity in Tgs, and increased PVB dendritic length and complexity in the Tg CA1 and DG. Red arrows indicate cell soma. Scale bar, 50 μm. Abbreviations: corpus callosum (cc); dorsal/ventral molecular layer (d/v mol); granular cell layer (GCL); pyramidal layer (PL). Data are mean ± SEM (from n = 16 cells/cohort, sampled across 4 rats/genotype at each age); repeated measures ANOVA with Holm-Sidak post hoc test; *P < 0.05, **P < 0.01, ***P < 0.001
Fig. 7
Fig. 7
TgF344-AD rats exhibit cognitive resilience at 12 months of age and cognitive loss at 9 and 15 months. NTg and TgF344-AD rats were tested for spatial learning, memory and executive function in the Barnes maze at 9 (n = 13 and 17), 12 (n = 12 and 14) and 15 (n = 14 and 17) months of age. The latency to escape and the complexity of search strategies utilized were assessed in spatial memory probe test, and during 5 days of reversal learning. At 9 months, no differences were detected in the spatial memory latency to escape (a) or the search strategy complexity (b). Tg rats exhibited impaired executive function at 9 months, with significantly longer latency to escape (c) and less complex strategies (d) in reversal trials. The 12-month-old Tg rats had impaired spatial memory, with no deficits in the latency to escape (e), but significant deficits in search strategy complexity (f). g and h Despite prior deficits, the 12-month-old Tg rats exhibited cognitive maintenance in executive function, and cognitive flexibility, with no significant genotype effects. At 15 months of age, significant Tg deficits were detected in spatial memory latency to escape (i), but not search strategy complexity (j). (k and l) Robust deficits were detected in executive function and cognitive flexibility at 15 months. Data are mean ± SEM; unpaired t-test (a, e, and i), Mann–Whitney U test (b, f, and j), repeated measures ANOVA with Holm-Sidak post hoc test (c, d, g, h, k, and l); *P < 0.05, **P < 0.01, ***P < 0.001
Fig. 8
Fig. 8
Age affects spatial memory, executive function and cognitive flexibility in TgF344-AD and NTg rats. Barnes maze was conducted in NTg and TgF344-AD rats at 9 (n = 13 and 17), 12 (n = 12 and 14) and 15 (n = 14 and 17) months of age (see Fig. 7). a, b The latencies to escape in the probe trial and in the final reversal trial day were assessed to determine the effect of aging on spatial memory and executive function. a NTg rats did not show significant impairment in spatial memory with age; however, spatial memory dysfunction increased linearly with age in Tg rats. b NTg rats exhibited no significant age effect on executive function, despite slight increases in escape latency between 9 and 12 months of age. The Tg rats exhibited significantly increased executive function deficits with age, most prominently between 12 and 15 months. c–e Distribution of search strategies utilized in the reversal days demonstrates genotype and age effects on cognitive flexibility. c The 9-month-old NTg rats refined their search strategies to a greater degree than Tg rats. d At 12 months of age, NTg and Tg rats utilized a comparable distribution of search strategies, with an aging effect in the 9- vs 12-month comparison in NTg rats. e The 15-month-old NTg rats performed similarly to 12-month-old NTg rats, whereas the 15-month-old Tg rats had robust impairments and were cognitively inflexible, utilizing a majority of random search strategies in reversal trials. f A summary schematic demonstrating progressive Aβ and tau accumulation, somatostatin dysfunction and spatial memory deficits, as well as maintenance of executive function associated with a resilient hippocampal parvalbumin network, before robust loss at the endpoint. Data represent mean ± SEM (a and b; blue and green error bars) and ± 95% confidence intervals (a and b; blue and green shaded area) of trendline (a and b; black dashed); linear regression. *P < 0.05, **P < 0.01 for slopes significantly non-zero

Similar articles

Cited by

References

    1. Selkoe DJ, Hardy J. The amyloid hypothesis of Alzheimer’s disease at 25 years. EMBO Mol Med. 2016;8(6):595–608. doi: 10.15252/emmm.201606210. - DOI - PMC - PubMed
    1. Jacobs HIL, Hedden T, Schultz AP, et al. Structural tract alterations predict downstream tau accumulation in amyloid-positive older individuals. Nat Neurosci. 2018;21(3):424–431. doi: 10.1038/s41593-018-0070-z. - DOI - PMC - PubMed
    1. Hanseeuw BJ, Betensky RA, Jacobs HIL, et al. Association of amyloid and tau with cognition in preclinical Alzheimer disease: a longitudinal study. JAMA Neurol. 2019;76(8):915. doi: 10.1001/jamaneurol.2019.1424. - DOI - PMC - PubMed
    1. Buckner RL. Memory and executive function in aging and AD: multiple factors that cause decline and reserve factors that compensate. Neuron. 2004;44(1):195–208. doi: 10.1016/j.neuron.2004.09.006. - DOI - PubMed
    1. Maestú F, de Haan W, Busche MA, DeFelipe J. Neuronal excitation/inhibition imbalance: core element of a translational perspective on Alzheimer pathophysiology. Ageing Res Rev. 2021;69:101372. doi: 10.1016/j.arr.2021.101372. - DOI - PubMed

Publication types