. 2022 May 2;20(1):97.
doi: 10.1186/s12915-022-01298-z.

Transcriptomic underpinnings of high and low mirror aggression zebrafish behaviours

Affiliations

Transcriptomic underpinnings of high and low mirror aggression zebrafish behaviours

Florian Reichmann et al. BMC Biol. .

Abstract

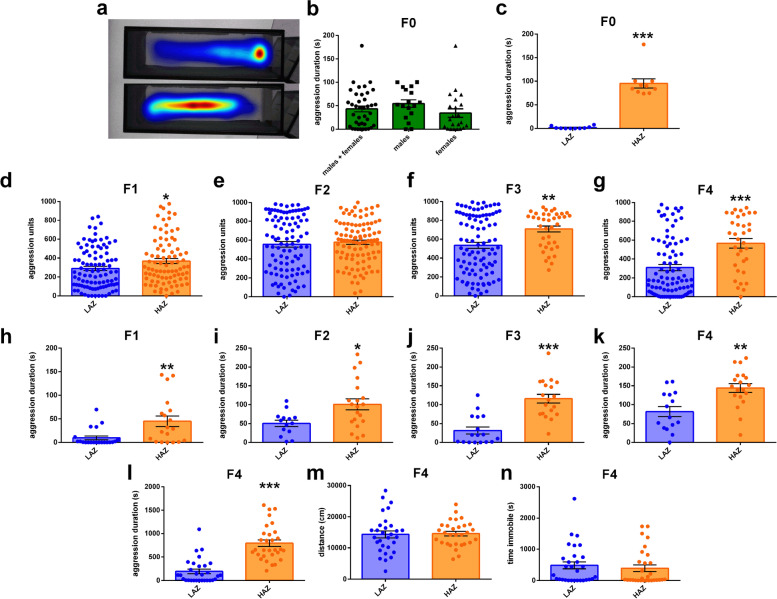
Background: Aggression is an adaptive behaviour that animals use to protect offspring, defend themselves and obtain resources. Zebrafish, like many other animals, are not able to recognize themselves in the mirror and typically respond to their own reflection with aggression. However, mirror aggression is not an all-or-nothing phenomenon, with some individuals displaying high levels of aggression against their mirror image, while others show none at all. In the current work, we have investigated the genetic basis of mirror aggression by using a classic forward genetics approach - selective breeding for high and low mirror aggression zebrafish (HAZ and LAZ).

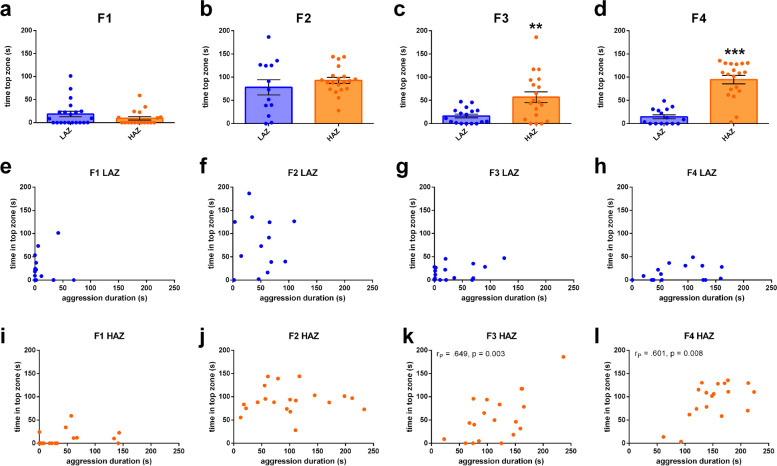
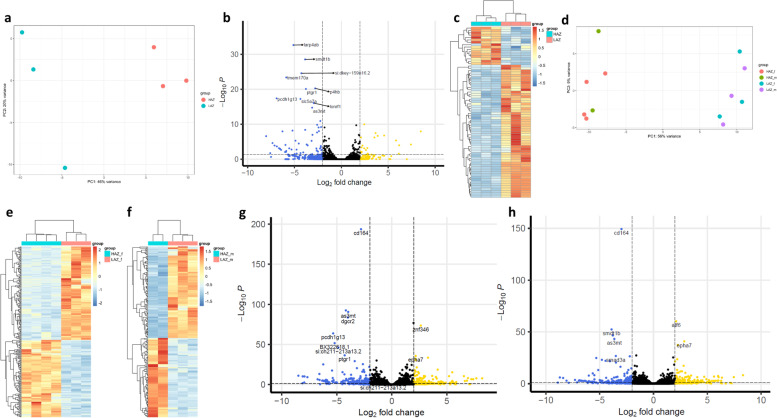
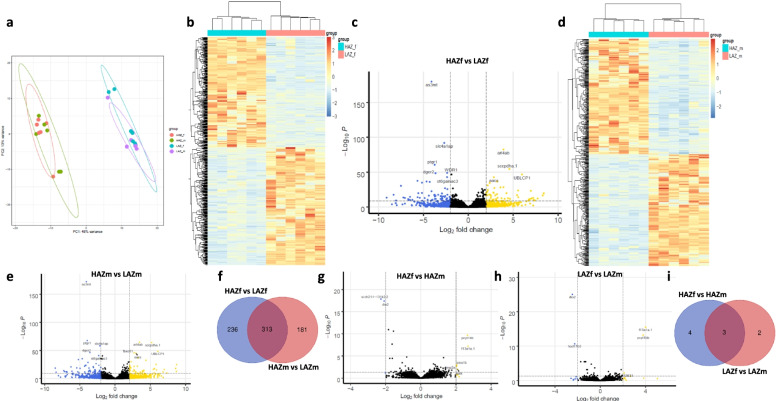
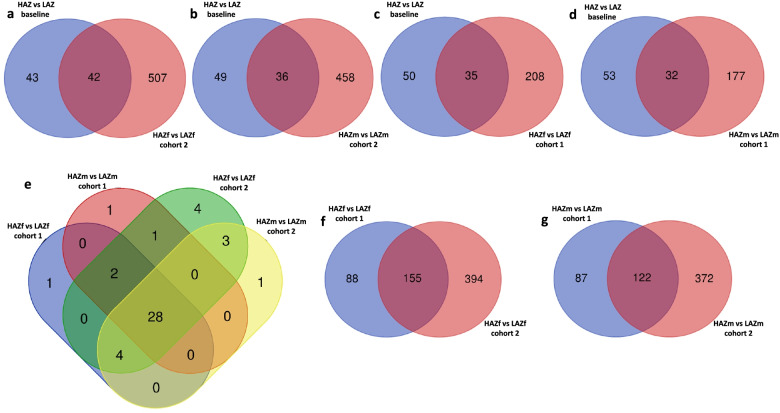
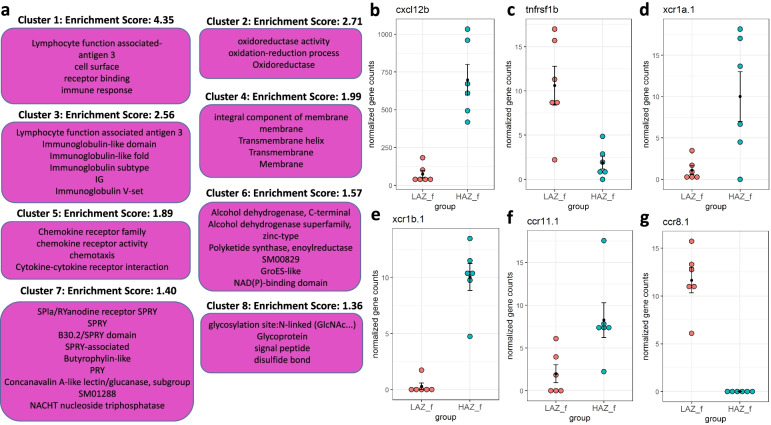
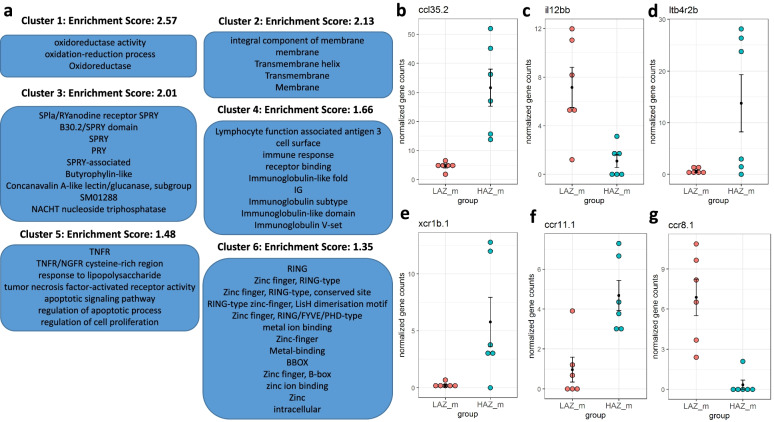
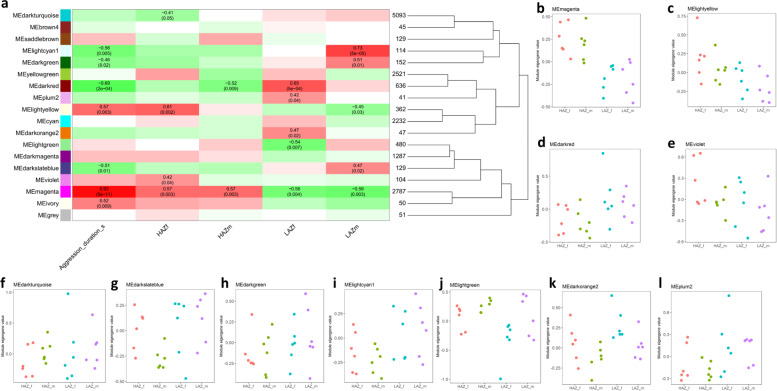
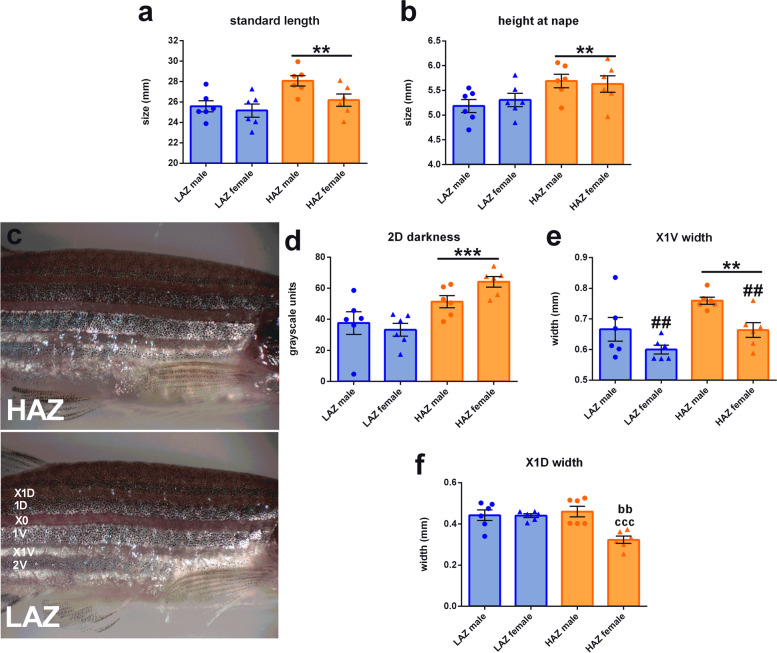
Results: We characterized AB wild-type zebrafish for their response to the mirror image. Both aggressive and non-aggressive fish were inbred over several generations. We found that HAZ were on average more aggressive than the corresponding LAZ across generations and that the most aggressive adult HAZ were less anxious than the least aggressive adult LAZ after prolonged selective breeding. RNAseq analysis of these fish revealed that hundreds of protein-encoding genes with important diverse biological functions such as arsenic metabolism (as3mt), cell migration (arl4ab), immune system activity (ptgr1), actin cytoskeletal remodelling (wdr1), corticogenesis (dgcr2), protein dephosphorylation (ublcp1), sialic acid metabolism (st6galnac3) and ketone body metabolism (aacs) were differentially expressed between HAZ and LAZ, suggesting a strong genetic contribution to this phenotype. DAVID pathway analysis showed that a number of diverse pathways are enriched in HAZ over LAZ including pathways related to immune function, oxidation-reduction processes and cell signalling. In addition, weighted gene co-expression network analysis (WGCNA) identified 12 modules of highly correlated genes that were significantly associated with aggression duration and/or experimental group.

Conclusions: The current study shows that selective breeding based of the mirror aggression phenotype induces strong, heritable changes in behaviour and gene expression within the brain of zebrafish suggesting a strong genetic basis for this behaviour. Our transcriptomic analysis of fish selectively bred for high and low levels of mirror aggression revealed specific transcriptomic signatures induced by selective breeding and mirror aggression and thus provides a large and novel resource of candidate genes for future study.

Keywords: Anxiety; High aggression zebrafish; Low aggression zebrafish; Mirror aggression; RNAseq; Transcriptomics.


Conflict of interest statement

The authors declare that they have no competing interests.

Figures

Fig. 1
Fig. 1
Transgenerational effects of selective breeding on mirror fighting. a Representative heatmap images of an aggressive (top part) and non-aggressive (bottom part) zebrafish individual in the mirror-induced aggression (MIA) setup. b Variation in time spent interacting with the mirror of arbitrarily-selected male and female zebrafish from the local breeding colony (F0 fish) during a 5 min MIA assay. c The 10 most aggressive F0 zebrafish spent significantly more time in aggressive display than the 10 least aggressive F0 zebrafish. n = 10/group (dg). Increased mirror aggression levels of d 1-month-old (n = 85–96) F1 HAZ (high aggression zebrafish) derived from F0 HAZ, e 1-month-old (n = 100/group) F2 HAZ derived from F1 HAZ, f 1-month-old (n = 38–98) F3 HAZ derived from F2 HAZ and g 1-month-old (n = 34–90) F4 HAZ derived from F3 HAZ compared to respective LAZ (low aggression zebrafish). hk Mirror aggression levels of the most aggressive juvenile HAZ at adulthood (3 months of age) compared to the mirror aggression levels of the least aggressive juvenile LAZ at adulthood. Analysis revealed higher mirror aggression levels of h the most aggressive F1 HAZ at 3 months of age (n = 19–20), i the most aggressive F2 HAZ at 3 months of age (n = 14–20), j the most aggressive F3 HAZ at 3 months of age (n = 17–19) and k the most aggressive F4 HAZ at 3 months of age (n = 15–19) compared to the least aggressive LAZ of the respective generation at 3 months of age. ln Behaviour of adult F4 high aggression zebrafish (HAZ) and low aggression zebrafish (LAZ) during prolonged mirror exposure. l Time spent interacting with the mirror, m distance travelled and n time spent immobile of HAZ and LAZ exposed to a 1h mirror-induced aggression assay (n = 30/group). Mann-Whitney U test. ***, P < 0.001; **, P < 0.01 and *, P < 0.05 vs. respective LAZ. Data are presented as mean ± SEM. Source data and individual data values are available in Additional file 2
Fig. 2
Fig. 2
Transgenerational effects of selective breeding on anxiety-like behaviour. ad Time spent in the top zone of the novel tank diving test across generations (F1–F4) of adult high aggression zebrafish (HAZ) and adult low aggression zebrafish (LAZ), which had been previously tested in the mirror-induced aggression assay. Mann-Whitney U test. n = 13–21. ***, P < 0.001 and **, P < 0.01 vs. LAZ. Data are presented as mean ± SEM. eh Scatter plots visualizing Pearson correlation analysis between time spent attacking the mirror and time spent in the top zone of the novel tank diving test of LAZ across generations (F1–F4). n = 13–21. il Scatter plots visualizing Pearson correlation analysis between time spent attacking the mirror and time spent in the top zone of the novel tank diving test of HAZ across generations (F1–F4). n = 18–20. Significant correlations are shown by displaying the correlation coefficient (rp) and p value in the respective Figure panels. Source data and individual data values are available in Additional file 2
Fig. 3
Fig. 3
Selective breeding-induced and mirror-induced neurotranscriptomic differences of male and female high aggression zebrafish (HAZ) and low aggression zebrafish (LAZ). a Principal component analysis plot of the top 200 most variable genes after differential expression analysis between F4 HAZ and LAZ without mirror exposure. n = 3/group. b Volcano plot of differentially expressed genes (DEGs; padj < 0.05 and LFC > |2|) between F4 HAZ and LAZ at baseline. DEGs with the lowest adjusted p values (padj) are highlighted. n = 3/group. c Heat map displaying DEGs between F4 HAZ and LAZ at baseline. Hierarchical clustering of samples and genes reveals large differences between HAZ and LAZ, but similar transcriptional patterns within the two lines. n = 3/group. d Principal component analysis plot of the top 200 most variable genes after differential expression analysis between F4 HAZ and LAZ displaying similar aggression levels after mirror exposure. n = 6/group. e Heatmap of DEGs between female HAZ (HAZf) and female LAZ (LAZf) after mirror exposure. Hierarchical clustering of samples and genes reveals large differences between HAZ and LAZ, but similar transcriptional patterns within aggression subgroups. n = 3-4/group. f Heatmap of DEGs between male HAZ (HAZm) and male LAZ (LAZm) after mirror exposure. Hierarchical clustering of samples and genes reveals similar differences like in corresponding male animals. n=2–3/group. g Volcano plot displaying DEGs between HAZf and LAZf after mirror exposure. DEGs with lowest adjusted p values (padj) are highlighted. n = 3–4/group. h Volcano plot displaying DEGs between HAZm and LAZm after mirror exposure. DEGs with the lowest adjusted p values (padj) are highlighted. n = 2–3/group. Golden dots in Volcano plots indicate genes upregulated in HAZ more than log fold change 2, blue dots represent genes downregulated in HAZ more than LFC − 2 and black dots represent genes not passing these thresholds. Source data and individual data values are available at the ebrains data repository, DOI: 10.25493/VTP5-8J9 and in Additional file 2
Fig. 4
Fig. 4
Neurotranscriptomic differences of the most aggressive male and female high aggression zebrafish (HAZ) compared to the least aggressive low aggression zebrafish (LAZ). a Principal component analysis plot of the top 200 most variable genes after differential expression analysis. n = 6/group. b Heatmap of differentially expressed genes (DEGs; padj < 0.05 and LFC > |2|) between female HAZ (HAZf) and female LAZ (LAZf) of cohort 2. Hierarchical clustering of samples and genes reveals large differences between HAZ and LAZ, but similar transcriptional patterns within aggression subgroups. n = 6/group. c Volcano plot displaying DEGs between HAZf and LAZf. DEGs with the lowest adjusted p value (padj) are highlighted. n = 6/group. d Heatmap of differentially expressed genes (DEGs; padj < 0.05 and LFC > |2|) between male HAZ (HAZm) and male LAZ (LAZm) of cohort 2. Hierarchical clustering of samples and genes reveals large differences between HAZ and LAZ, but similar transcriptional patterns within aggression subgroups. n = 6/group. e Volcano plot displaying DEGs between HAZm and LAZm. DEGs with the lowest adjusted p value (padj) are highlighted. n = 6/group. f Venn diagram showing the overlap of DEGs between the HAZf vs. LAZf comparison and the HAZm vs. LAZm comparison. g Volcano plot displaying DEGs between HAZf and HAZm. DEGs are highlighted. n = 6/group. h Volcano plot displaying DEGs between LAZf and LAZm. DEGs are highlighted. n = 6/group. i Venn diagram showing the overlap of DEGs between the HAZf vs. HAZm comparison and the LAZf vs. LAZm comparison. Golden dots in Volcano plots indicate genes upregulated in HAZ more than log fold change 2, blue dots represent genes downregulated in HAZ more than LFC -2 and black dots represent genes not passing these thresholds. Source data and individual data values are available at the ebrains data repository, DOI: 10.25493/VTP5-8J9 and in Additional file 2
Fig. 5
Fig. 5
Overlap of differentially expressed genes (DEGs) between high aggression zebrafish (HAZ) and low aggression zebrafish (LAZ) at baseline and after mirror exposure. a Venn diagram showing the overlap of DEGs between the HAZ vs. LAZ comparison at baseline and the comparison of female cohort 2 fish. b Venn diagram showing the overlap of DEGs between the HAZ vs. LAZ comparison at baseline and the comparison of male cohort 2 fish. c Venn diagram showing the overlap of DEGs between the HAZ vs. LAZ comparison at baseline and the comparison of female cohort 1 fish. d Venn diagram showing the overlap of DEGs between the HAZ vs. LAZ comparison at baseline and the comparison of male cohort 1 fish. e Venn diagram depicting common DEGs between the comparisons of male and female cohort 1 and cohort 2 fish. f Venn diagram showing the overlap of DEGs between the comparison of female cohort 1 fish and the comparison of female cohort 2 fish. g Venn diagram showing the overlap of DEGs between the comparison of male cohort 1 fish and the comparison of male cohort 2 fish. For all comparisons, cohort 1 denotes HAZ and LAZ exposed to the mirror for 1h and displaying similar aggression levels, whereas cohort 2 denotes the comparison between the most aggressive HAZ during prolonged mirror exposure and the least aggressive LAZ. Source data and individual data values are available in Additional file 2
Fig. 6
Fig. 6
Enriched clusters and functional categories between the most aggressive female high aggression zebrafish (HAZf) and the least aggressive female low aggression zebrafish (LAZf). a Functional annotation clustering using DAVID pathway analysis revealed 8 significantly enriched clusters (enrichment score ≥ 1.3). Annotation terms related to each cluster are displayed in pink boxes. bg DEGs with known important immunomodulatory functions present in one or more of these enriched clusters include b chemokine (C-X-C motif) ligand 12b (cxcl12b), c tumour necrosis factor receptor superfamily member 1B (tnfrsf1b), d chemokine (C motif) receptor 1a, duplicate 1 (xcr1a.1), e chemokine (C motif) receptor 1b, duplicate 1 (xcr1b.1), f chemokine (C-C motif) receptor 11.1(ccr11.1) and g chemokine (C-C motif) receptor 8.1 (ccr8.1). n = 6/group. Source data and individual data values are available in Additional file 2
Fig. 7
Fig. 7
Enriched clusters and functional categories between the most aggressive male high aggression zebrafish (HAZm) and the least aggressive male low aggression zebrafish (LAZm). a Functional annotation clustering using DAVID pathway analysis revealed 5 significantly enriched clusters (enrichment score ≥ 1.3). Annotation terms related to each cluster are displayed in blue boxes. b-g DEGs with known important immunomodulatory functions present in one or more of these enriched clusters include b chemokine (C-C motif) ligand 35 duplicate 2 (ccl35.2), c interleukin 12B, c (il12bc), d leukotriene B4 receptor 2b (ltb4r2b), e chemokine (C motif) receptor 1b, duplicate 1 (xcr1b.1), f chemokine (C-C motif) receptor 11.1 (ccr11.1) and g chemokine (C-C motif) receptor 8.1 (ccr8.1). n = 6/group. Source data and individual data values are available in Additional file 2
Fig. 8
Fig. 8
Weighted Gene Coexpression Network Analysis (WGCNA) of the most aggressive high aggression zebrafish (HAZ) compared to the least aggressive low aggression zebrafish (LAZ). a Correlations between gene coexpression modules identified by WGCNA and experimental group (male and female high aggression zebrafish (HAZm and HAZf), male and female low aggression zebrafish (LAZm and LAZf) as well as aggression duration. The colours of the boxes are scaled with the value of the correlation coefficient ranging from − 1 (green) to 1 (red). The p value of significant correlations and the respective correlation coefficient are shown in the Figure. bl Eigengene values of samples separated by group (HAZf, HAZm, LAZf and LAZm) for gene modules significantly associated to one or more of the experimental groups or aggression duration. n = 6/group. b Gene coexpression module magenta, c gene coexpression module light yellow, d gene coexpression module dark red, e gene coexpression module violet, f gene coexpression module dark turquoise, g gene coexpression module dark slate blue, h gene coexpression module dark green, i gene coexpression module light cyan1, j gene coexpression module light green, k gene coexpression module dark orange2 and l gene coexpression module plum2. Source data and individual data values are available in Additional file 2
Fig. 9
Fig. 9
Morphological differences between high aggression zebrafish (HAZ) and low aggression zebrafish (LAZ). a Standard length and b height at nape measurements of male and female HAZ and LAZ exposed to the mirror-induced aggression setup for 1h and used for RNAseq (cohort 2). c Representative stripe pattern images of used HAZ and LAZ. d Stripe colouration of 2D stripes as assessed by grayscale measurements of stereomicroscopic images. (ef Width of X1V and X1D interstripes. Two-way ANOVA followed by Tukey post hoc test in the case of a significant interaction term. n = 6/group. ***, P<0.001; **, P<0.01 main effect HAZ vs. LAZ; bb, P<0.01 vs. LAZ male; ccc, P<0.001 vs. HAZ male. Data are presented as mean ± SEM. Source data and individual data values are available in Additional file 2

Similar articles

Cited by

References

    1. Nelson RJ, Trainor BC. Neural mechanisms of aggression. Nat Rev Neurosci. 2007;8(7):536–546. doi: 10.1038/nrn2174. - DOI - PubMed
    1. de Boer SF, van der Vegt BJ, Koolhaas JM. Individual variation in aggression of feral rodent strains: a standard for the genetics of aggression and violence? Behav Genet. 2003;33(5):485–501. doi: 10.1023/A:1025766415159. - DOI - PubMed
    1. Archard GA, Braithwaite VA. Variation in aggressive behaviour in the poeciliid fish Brachyrhaphis episcopi: population and sex differences. Behav Process. 2011;86(1):52–57. doi: 10.1016/j.beproc.2010.09.002. - DOI - PubMed
    1. Kalueff AV, Stewart AM, Gerlai R. Zebrafish as an emerging model for studying complex brain disorders. Trends Pharmacol Sci. 2014;35(2):63–75. doi: 10.1016/j.tips.2013.12.002. - DOI - PMC - PubMed
    1. Kalueff AV, Gebhardt M, Stewart AM, Cachat JM, Brimmer M, Chawla JS, et al. Towards a comprehensive catalog of zebrafish behavior 1.0 and beyond. Zebrafish. 2013;10(1):70–86. doi: 10.1089/zeb.2012.0861. - DOI - PMC - PubMed

Publication types

LinkOut - more resources