. 2022 May 3;17(1):32.
doi: 10.1186/s13024-022-00526-y.

Alzheimer risk gene product Pyk2 suppresses tau phosphorylation and phenotypic effects of tauopathy

Affiliations

Alzheimer risk gene product Pyk2 suppresses tau phosphorylation and phenotypic effects of tauopathy

A Harrison Brody et al. Mol Neurodegener. .

Erratum in

Abstract

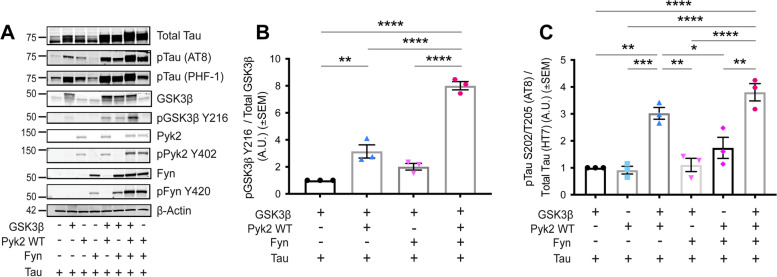
Background: Genetic variation at the PTK2B locus encoding the protein Pyk2 influences Alzheimer's disease risk. Neurons express Pyk2 and the protein is required for Amyloid-β (Aβ) peptide driven deficits of synaptic function and memory in mouse models, but Pyk2 deletion has minimal effect on neuro-inflammation. Previous in vitro data suggested that Pyk2 activity might enhance GSK3β-dependent Tau phosphorylation and be required for tauopathy. Here, we examine the influence of Pyk2 on Tau phosphorylation and associated pathology.

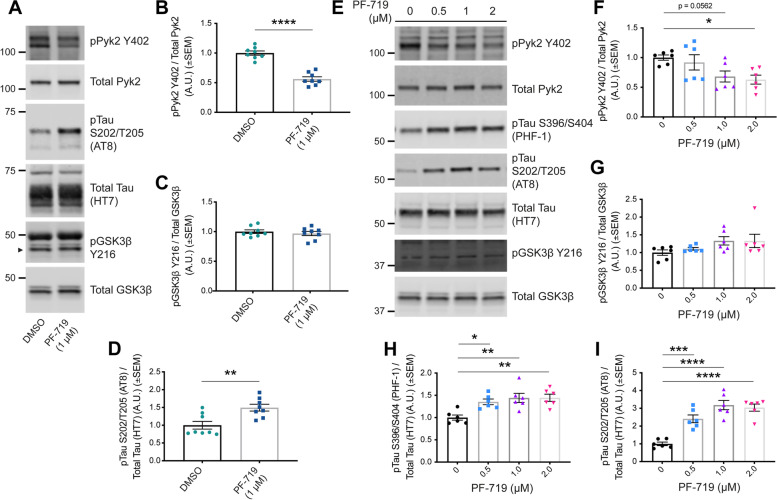
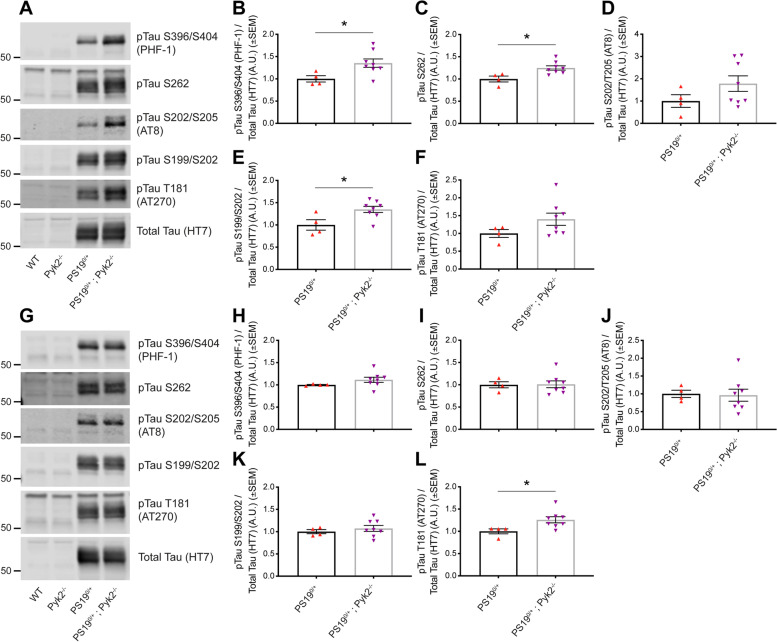
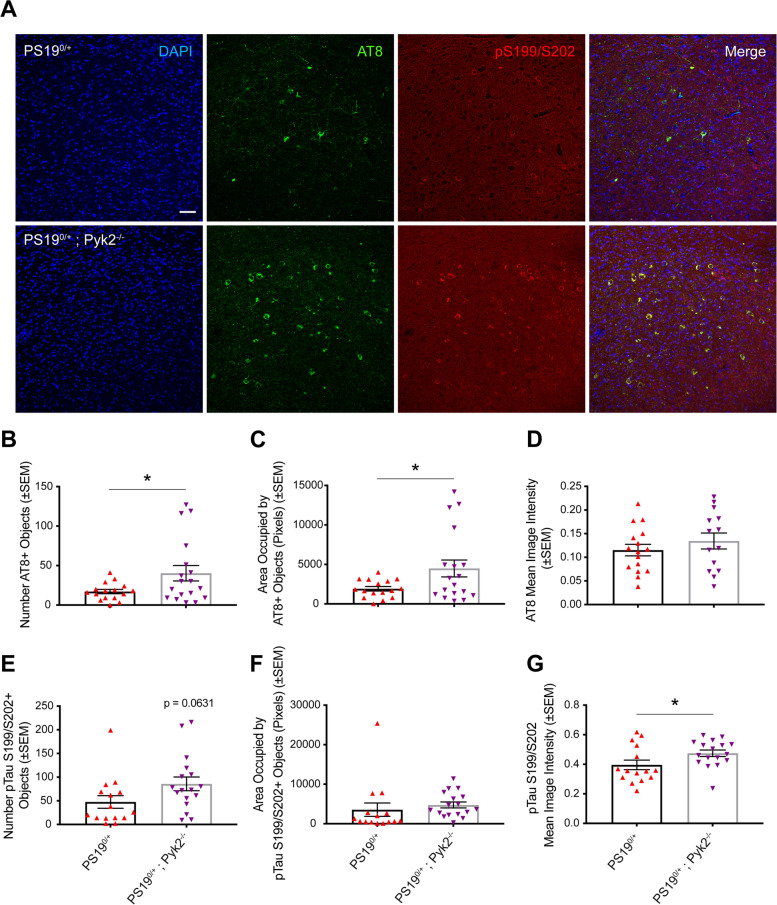
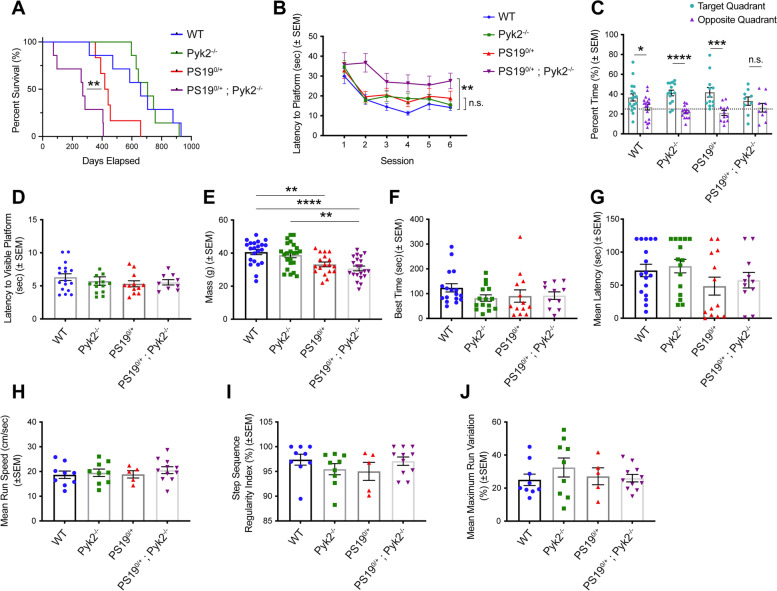
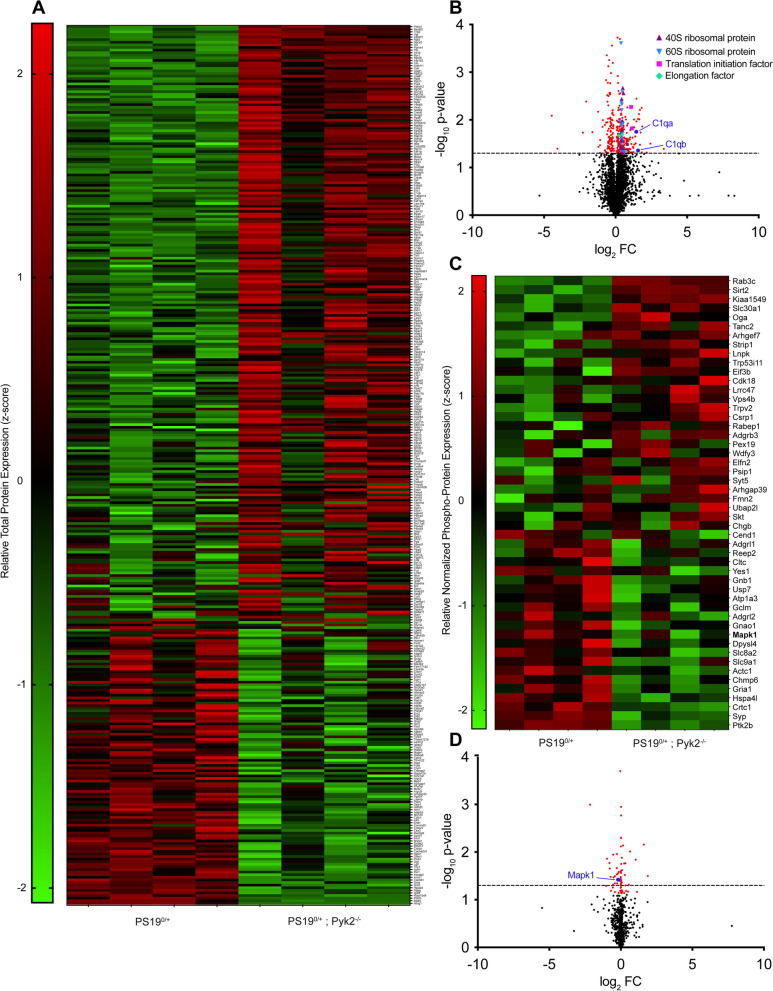
Methods: The effect of Pyk2 on Tau phosphorylation was examined in cultured Hek cells through protein over-expression and in iPSC-derived human neurons through pharmacological Pyk2 inhibition. PS19 mice overexpressing the P301S mutant of human Tau were employed as an in vivo model of tauopathy. Phenotypes of PS19 mice with a targeted deletion of Pyk2 expression were compared with PS19 mice with intact Pyk2 expression. Phenotypes examined included Tau phosphorylation, Tau accumulation, synapse loss, gliosis, proteomic profiling and behavior.

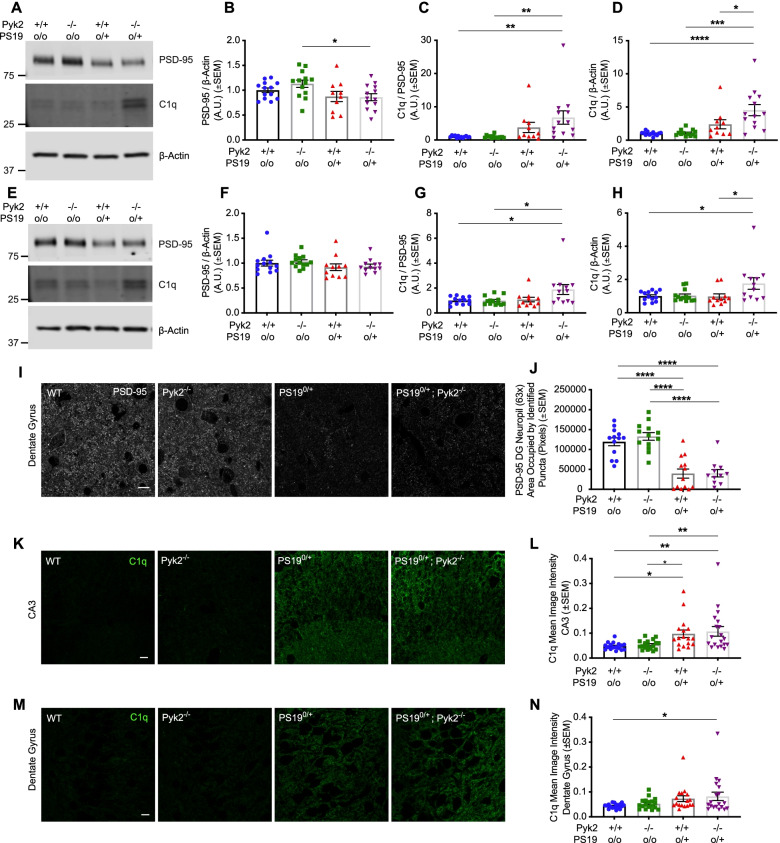
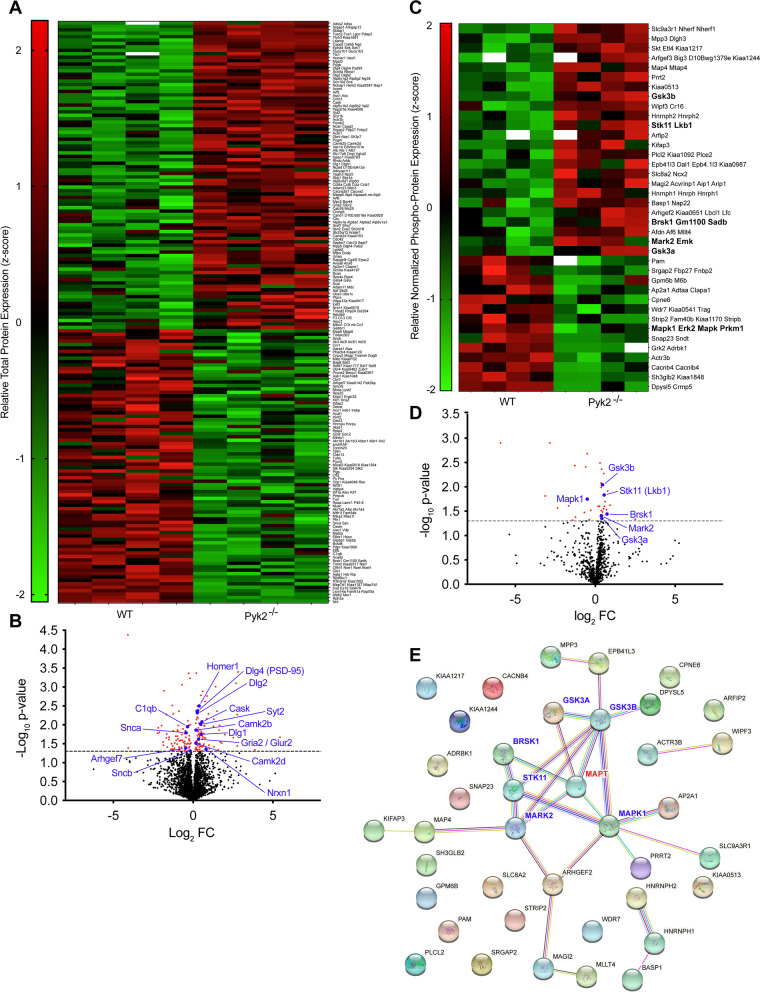
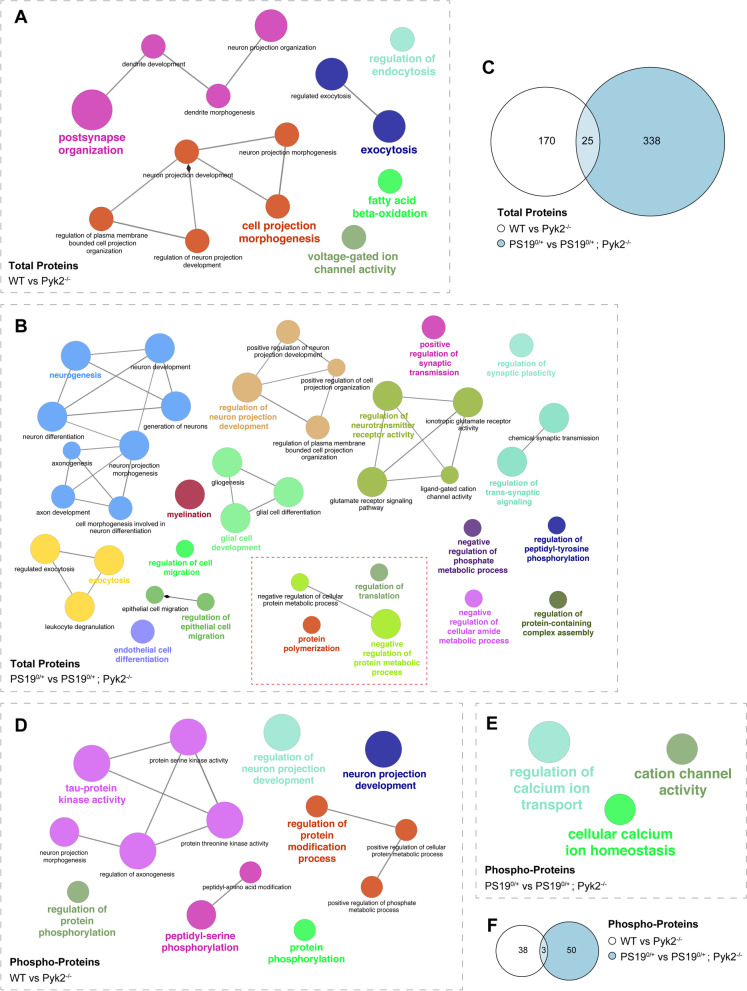
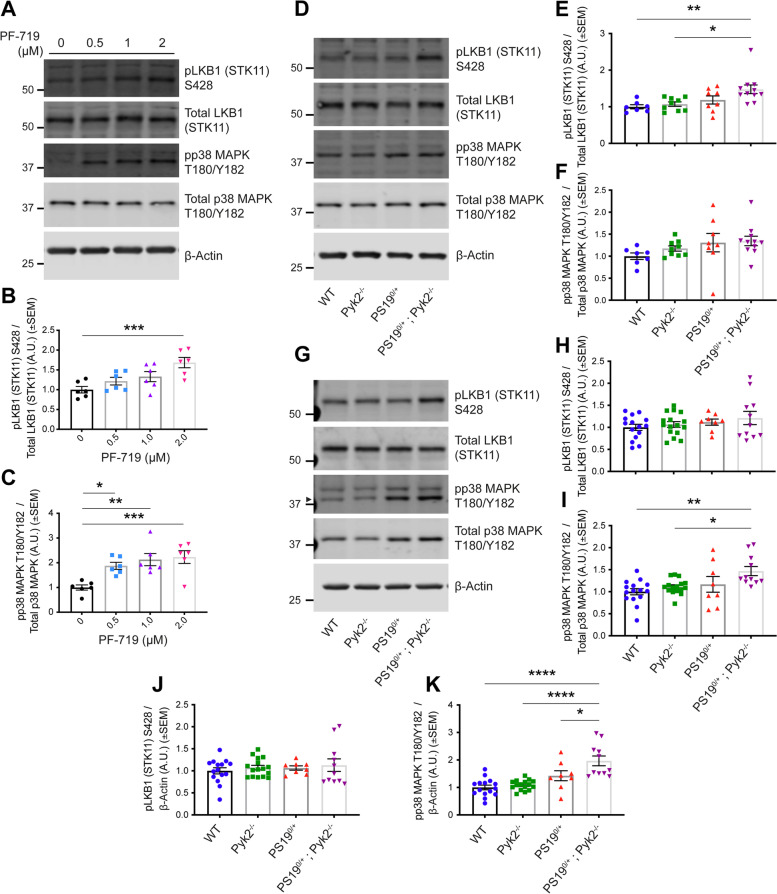
Results: Over-expression experiments from Hek293T cells indicated that Pyk2 contributed to Tau phosphorylation, while iPSC-derived human neuronal cultures with endogenous protein levels supported the opposite conclusion. In vivo, multiple phenotypes of PS19 were exacerbated by Pyk2 deletion. In Pyk2-null PS19 mice, Tau phosphorylation and accumulation increased, mouse survival decreased, spatial memory was impaired and hippocampal C1q deposition increased relative to PS19 littermate controls. Proteomic profiles of Pyk2-null mouse brain revealed that several protein kinases known to interact with Tau are regulated by Pyk2. Endogenous Pyk2 suppresses LKB1 and p38 MAPK activity, validating one potential pathway contributing to increased Tau pathology.

Conclusions: The absence of Pyk2 results in greater mutant Tau-dependent phenotypes in PS19 mice, in part via increased LKB1 and MAPK activity. These data suggest that in AD, while Pyk2 activity mediates Aβ-driven deficits, Pyk2 suppresses Tau-related phenotypes.

Keywords: Alzheimer’s disease; C1q; Fronto-temporal dementia; PTK2B; Pyk2; Tauopathy.


Conflict of interest statement

None.

Figures

Fig. 1
Fig. 1
Pyk2 phosphorylates Tau via GSK3β in a Hek293T over-expression system. Hek293T cells were transfected with combinations of the proteins indicated, and lysates separated via SDS-PAGE. Separated lysates were immunoblotted with the antibodies listed. A, Representative immunoblot images of transfected Hek293T cells. B and C, Quantification of A. Over-expression of Pyk2 led to a significant increase in the activity of over-expressed GSK3β (pGSK3β Y216 normalized to total GSK3β). This increase was further augmented by the co-transfection of Fyn with GSK3β and Pyk2 (B). The phosphorylation of over-expressed Tau at S202/T205 (AT8) normalized to total Tau (HT7) was significantly increased when co-transfected with GSK3β and Pyk2, but not when co-transfected with either kinase alone. No further increase in normalized AT8 signal was observed when Tau, Pyk2 and GSK3β were co-transfected with Fyn. Data are graphed as mean ± SEM, one-way ANOVA with Tukey’s multiple comparisons test, *p < 0.05, **p < 0.01, ***p < 0.001, ****p < 0.0001, n = 3
Fig. 2
Fig. 2
Pharmacological inhibition of Pyk2 increases Tau phosphorylation independent of changes in GSK3β activity. AD, Acute hippocampal slices (thickness, 400 μm) from 4.5–5.5-month-old PS190/+ animals were treated with 1 μM Pyk2 inhibitor (PF-719) for 2 h in oxygenated artificial CSF at room temperature and were homogenized in RIPA immediately following treatment. RIPA-soluble lysates were separated by SDS-PAGE and immunoblotted with the antibodies indicated. A, Representative immunoblot images of lysates from PF-719-treated acute hippocampal slices. Arrowhead indicates pGSK3β Y216. BD, Quantification of A. PF-719 treatment successfully inhibited Pyk2 activity (pPyk2 Y402 normalized to total Pyk2). Pyk2 inhibition significantly increased the phosphorylation Tau at S202/T205 (AT8) normalized to total Tau (HT7) (D) while GSK3β activity (pGSK3β Y216 normalized to total GSK3β) remained unchanged (C). Data are graphed as mean ± SEM, unpaired two-tailed t-test, **p < 0.01, ****p < 0.0001, n = 8. EI, iPSC-derived human cortical neurons (90–100 days post terminal differentiation) were treated with PF-719 at indicated concentrations for 2 h at 37 °C and, immediately following treatment, homogenized in RIPA containing 1% SDS. Lysates were separated by SDS-PAGE and immunoblotted with the antibodies listed. E, Representative immunoblot images of lysates from PF-719-treated iPSC-derived human cortical neurons. FI, Quantification of E. PF-719 treatment significantly inhibited Pyk2 activity (pPyk2 Y402 normalized to total Pyk2) (F), while no changes in GSK3β activity (pGSK3β Y216 normalized to total GSK3β) were observed at any concentration of PF-719 (G). Pyk2 inhibition resulted in increased levels of Tau phosphorylation at S396/S404 (PHF-1) normalized to total Tau (HT7) (H) and S202/T205 (AT8) normalized to total Tau (HT7) (I) at every concentration of PF-719 administered. Data are graphed as mean ± SEM, one-way ANOVA with Dunnett’s multiple comparisons test, *p < 0.05, **p < 0.01, ***p < 0.001, ****p < 0.0001, n = 6
Fig. 3
Fig. 3
Pyk2 expression suppresses Tau phosphorylation in a PS190/+ animal model of tauopathy. AL, TBS-insoluble, SDS-soluble hippocampal (AF) and cortical (GL) lysates from 9.5–10.5-month-old WT, Pyk2−/−, PS190/+ and PS190/+;Pyk2−/− animals were separated by SDS-PAGE and immunoblotted with antibodies against multiple pathophysiologically-relevant phospho-Tau residues as well as total Tau. A, Representative immunoblot images of TBS-insoluble, SDS-soluble hippocampal Tau. BF, Quantification of protein levels by densitometric analysis reveals significantly greater phosphorylation of hippocampal Tau in lysates from PS190/+;Pyk2−/− animals at pTau S396/S404 (PHF-1) (B), pTau S262 (C) and pTau S199/S202 (E) compared to lysates from PS190/+ animals. All data are normalized total (HT7) levels of hippocampal Tau. Data are graphed as mean ± SEM, unpaired two-tailed t-test, *p < 0.05, n = 4–8 mice. G, Representative immunoblot images of TBS-insoluble, SDS-soluble cortical Tau. HL, Quantification of protein levels by densitometric analysis reveals significantly greater phosphorylation of cortical Tau in lysates from PS190/+;Pyk2−/− animals at pTau S262 (L) compared to those from PS190/+ animals. All data are normalized to total (HT7) levels cortical Tau. Data are graphed as mean ± SEM, unpaired two-tailed t-test, *p < 0.05, n = 4–8 mice
Fig. 4
Fig. 4
Pyk2 expression is protective against Tau pathology in PS190/+ mice. A, Representative immunofluorescent images of DAPI, pTau S202/T205 (AT8) and pTau S199/S202 immunoreactivity in amygdala of 9.5–10.5-month-old WT, Pyk2−/−, PS190/+ and PS190/+;Pyk2−/− animals. Scale bar, 50 μm. BD, Quantification of amygdalar pTau S202/T205 (AT8) immunoreactivity reveals significant increases in the number of AT8-positive cell-bodies (objects) (B) as well as in the area occupied by those objects (C) in PS190/+;Pyk2−/− compared to PS190/+ animals. Data are graphed as mean ± SEM, unpaired two-tailed t-test, *p < 0.05, n = 14–16 mice. EG, Quantification of amygdalar pTau S199/S202 immunoreactivity reveals a significant increase in pTau S199/S202 mean image intensity (G) in PS190/+;Pyk2−/− compared to PS190/+ animals. Data are graphed as mean ± SEM, unpaired two-tailed t-test, *p < 0.05, n = 15–18 mice
Fig. 5
Fig. 5
Pyk2 expression is protective against Tau-mediated early death and spatial memory impairment in PS190/+ animals. A, Kaplan-Meier survival curve of WT, Pyk2−/−, PS190/+ and PS190/+;Pyk2−/− animals. Survivorship of PS190/+;Pyk2−/− mice (median survival, 270 days) is significantly reduced compared to PS190/+ animals (median survival, 429.5 days). Log-rank (Mantel-Cox) test, **p = 0.0085, n = 6–7 mice. BD, Spatial memory of 9–10-month-old mice was assessed using the MWM test. B, Latency is defined as the time required to reach a hidden platform across 6 acquisition sessions of 4 trials each. Across the final 4 acquisition sessions, PS190/+;Pyk2−/− animals took significantly longer to reach the platform compared to WT mice. Data are graphed as mean ± SEM, repeated measures ANOVA with Tukey HSD multiple comparisons test, **p = 0.002, n.s. = not significant (p = 0.343), n = 9–17 mice. C, A 60 s probe trial was performed 24 h after the final acquisition session with the hidden platform removed. WT, Pyk2−/− and PS190/+ mice spent significantly greater time in the target quadrant compared to the opposite quadrant, while the difference in time spent between the target and opposite quadrants failed to reach significance for PS190/+;Pyk2−/− animals. Data are graphed as mean ± SEM, unpaired two-tailed t-test, *p < 0.05, ***p < 0.001, ****p < 0.0001, n.s. = not significant (p = 0.2885), n = 9–17 mice. Dashed line, 25%. D, To rule out visual impairment, latency for animals to find a platform marked with a visual cue was assessed following the probe trial. 4 animals (2 Pyk2−/−, 1 PS190/+ and 1 PS190/+;Pyk2−/−) were unable to locate the visible platform after 15 trials and were excluded from all MWM analyses. When excluding these animals, there were no significant differences in the time required to reach the visible platform across genotypes. Data are graphed as mean ± SEM, one-way ANOVA with Tukey’s multiple comparisons test, n = 9–17 mice. E, Animal body weights of 9–10-month-old mice across genotypes. PS190/+ weighed significantly less than WT animals while PS190/+;Pyk2−/− animals weighed significantly less than both WT and Pyk2−/− mice. Data are graphed as mean ± SEM, one-way ANOVA with Tukey’s multiple comparisons test, **p < 0.01, ****p < 0.0001, n = 18–23 mice. F, A rotarod test was performed to assess motor coordination. Latency to fall off the accelerating drum (acceleration: 0.1 rotations/min/sec; top speed: 4 rotations/min) over 5 consecutive trials was assessed and the best time (longest latency) for each animal compared. There were no significant differences in longest latency to fall across genotypes. Data are graphed as mean ± SEM, one-way ANOVA with Tukey’s multiple comparisons test, n = 11–17 mice. G, A wire hang test was conducted to assess grip strength. Animals were placed in the center of a wire grid (1 cm by 1 cm) and the latency to fall from the inverted grid was determined across 2 120 s trials. Mean latencies to fall across the 2 trials are plotted in G. There were no significant differences in mean latency to fall across genotypes. Data are graphed as mean ± SEM, one-way ANOVA with Tukey’s multiple comparisons test, n = 11–17 mice. HJ, Gait assessment was conducted using a Noldus CatWalk XT system. H, There were no significant differences in mean run speed across genotypes. Data are graphed as mean ± SEM, one-way ANOVA with Tukey’s multiple comparisons test, n = 5–11 mice. I, There were no significant differences in step sequence regularity index across genotypes. Data are graphed as mean ± SEM, one-way ANOVA with Tukey’s multiple comparisons test, n = 5–11 mice. J, There were no significant differences in mean maximum run variation across genotypes. Data are graphed as mean ± SEM, one-way ANOVA with Tukey’s multiple comparisons test, n = 5–11 mice
Fig. 6
Fig. 6
Proteomic analysis reveals signs of disrupted protein translational, increased synaptic C1q expression and decreased MAPK1 activity in PS190/+;Pyk2−/− animals. AD, Synaptosomal fractions were prepared from hippocampi of 9.5–10.5-month-old PS190/+ and PS190/+;Pyk2−/− mice and run through LC-MS/MS to identify significantly differentially regulated proteins between PS190/+ and PS190/+;Pyk2−/− animals. A, Heat map showing relative abundance of significantly differentially regulated (p < 0.05) synaptic proteins between PS190/+ and PS190/+;Pyk2−/− animals. B, Volcano plot of all total synaptic proteins identified via LC-MS/MS. Positive values for Log2FC represent increased synaptic protein expression in PS190/+;Pyk2−/− compared to PS190/+ mice. Dashed line represents p = 0.05. Significantly differentially regulated synaptic proteins shown in red. C, Heat map showing relative abundance of significantly differentially regulated (p < 0.05), phospho-enriched, synaptic proteins (normalized to total protein abundance) between PS190/+ and PS190/+;Pyk2−/− animals. D, Volcano plot of all normalized, phospho-enriched, synaptic proteins identified via LC-MS/MS. Positive values for Log2FC represent protein upregulation in Pyk2−/− compared to WT. Dashed line represents p = 0.05
Fig. 7
Fig. 7
Pyk2 expression protects against Tau-mediated C1q deposition. AD, Crude hippocampal, synaptosomal fractions were obtained from 9.5–10.5-month-old WT, Pyk2−/−, PS190/+ and PS190/+;Pyk2−/− animals. Lysates were separated by SDS-PAGE and immunoblotted with the antibodies indicated. A, Representative immunoblot images of hippocampal, synaptosomal fractions. BD, Quantification of A. A significant decrease in synaptic PSD-95 expression (normalized to β-Actin) was observed in synaptosomal fractions from PS190/+;Pyk2−/− hippocampi compared to those from Pyk2−/− animals (B). When normalized to PSD-95, a significant increase in synaptic C1q expression was observed in PS190/+;Pyk2−/− hippocampi compared to those from WT and Pyk2−/− animals (C). When normalized to β-Actin, an increase in synaptic C1q expression in PS190/+;Pyk2−/− hippocampi was significant compared to those from WT, Pyk2−/− and PS190/+ animals (D). Data are graphed as mean ± SEM, one-way ANOVA with Tukey’s multiple comparisons test, *p < 0.05, **p < 0.01, ***p < 0.001, ****p < 0.0001, n = 10–13 mice. EH, Crude cortical, synaptosomal lysates were obtained from 9.5–10.5-month-old WT, Pyk2−/−, PS190/+ and PS190/+;Pyk2−/− animals and immunoblots prepared as described above. E, Representative immunoblot images of cortical, synaptosomal fractions. FH, Quantification of E. No significant changes in cortical, synaptic PSD-95 (normalized to β-Actin) were observed in synaptosomal fractions across genotypes (F). When normalized to β-Actin, synaptic PSD-95 expression was significantly higher in Pyk2−/−, PS190/+ cortices compared to those from WT and Pyk2−/− animals (G). When normalized to β-Actin, PS190/+;Pyk2−/− cortices demonstrated significantly higher synaptic C1q expression compared to cortices from WT and PS190/+ animals (H). Data are graphed as mean ± SEM, one-way ANOVA with Tukey’s multiple comparisons test, *p < 0.05, n = 10–13 mice. I, Representative immunofluorescent images of PSD-95 immunoreactivity in dentate gyrus of 9.5–10.5-month-old WT, Pyk2−/−, PS190/+ and PS190/+;Pyk2−/− animals. Scale bar, 10 μm. J, Quantification of I. In the dentate gyrus, both PS190/+ and PS190/+;Pyk2−/− animals demonstrated significant reductions in the area occupied by PSD-95-positive puncta compare to WT and Pyk2−/− animals (I). Data are graphed as mean ± SEM, one-way ANOVA with Tukey’s multiple comparisons test, ****p < 0.0001, n = 11–13 mice. K, Representative immunofluorescent images of C1q immunoreactivity in CA3 of 9.5–10.5-month-old WT, Pyk2−/−, PS190/+ and PS190/+;Pyk2−/− animals. Scale bar, 10 μm. L, Quantification of K. PS190/+ and PS190/+;Pyk2−/− animals showed significantly higher C1q immunoreactivity (mean image intensity) in the CA3 region of the hippocampus compared WT and Pyk2−/− animals (L). Data are graphed as mean ± SEM, one-way ANOVA with Tukey’s multiple comparisons test, *p < 0.05, **p < 0.01, n = 17–19 mice. M, Representative immunofluorescent images of C1q immunoreactivity in the dentate gyrus of 9.5–10.5-month-old WT, Pyk2−/−, PS190/+ and PS190/+;Pyk2−/− animals. Scale bar, 10 μm. N, Quantification of M. Only PS190/+;Pyk2−/− animals showed significantly higher C1q immunoreactivity in the dentate gyrus compared to WT animals. Data are graphed as mean ± SEM, one-way ANOVA with Tukey’s multiple comparisons test, *p < 0.05, n = 17–19 mice
Fig. 8
Fig. 8
Proteomic analysis reveals potential regulators of Tau phosphorylation modulated by Pyk2. AD, Synaptosomal fractions were prepared from hippocampi of 12-month-old WT and Pyk2−/− animals and run through LC-MS/MS to identify proteins that are significantly differentially regulated by Pyk2 expression. A, Heat map showing relative abundance of significantly differentially regulated (p < 0.05) synaptic proteins between WT and Pyk2−/− animals. B, Volcano plot of all total synaptic proteins identified via LC-MS/MS. Positive values for Log2FC represent protein upregulation in Pyk2−/− compared to WT. Dashed line represents p = 0.05. Significantly differentially regulated synaptic proteins shown in red. C, Heat map showing relative abundance of significantly differentially regulated (p < 0.05), phospho-enriched, synaptic proteins (normalized to total protein abundance) between WT and Pyk2−/− animals. D, Volcano plot of all normalized, phospho-enriched, synaptic proteins identified via LC-MS/MS. Positive values for Log2FC represent protein upregulation in Pyk2−/− compared to WT. Dashed line represents p = 0.05. Significantly differentially regulated, synaptic phospho-proteins shown in red. Proximate regulators of Tau shown in blue. E, STRING protein-protein interaction network of all significantly differentially regulated, normalized, phospho-enriched, synaptic proteins. The interaction network was supplemented with MAPT (in red) to identify regulators of Tau. Proximate regulators of Tau (in blue) were defined as kinases or phosphatases positioned one or two degrees from MAPT. 6 kinases (and 0 phosphatases) were identified as proximate regulators of Tau modulated by Pyk2
Fig. 9
Fig. 9
Pathway enrichment of proteins with Pyk2-regulated expression. AB, Functional networks of identified proteomic hits (total protein fraction) from WT vs Pyk2−/− (A) and PS190/+ vs PS190/+;Pyk2−/− (B) analyses generated in ClueGO. Pathways involved in protein translation are boxed in red. C, Venn Diagram showing overlap of significant total protein hits between analyses. DE, Functional networks of phospho-proteomic hits (normalized phospho-enriched fraction) from WT vs Pyk2−/− (D) and PS190/+ vs PS190/+;Pyk2−/− (E) analyses. F, Venn Diagram showing overlap of significant normalized phospho-enriched protein hits between analyses
Fig. 10
Fig. 10
Pyk2 inhibits LKB1 and p38 MAPK activity. AC, iPSC-derived human cortical neurons (90–100 days post terminal differentiation) (same as shown in Fig. 2E–I) were treated with PF-719 at indicated concentrations for 2 h at 37 °C and, immediately following treatment, homogenized in RIPA containing 1% SDS. Lysates were separated by SDS-PAGE and immunoblotted with the LKB1 and p38 MAPK antibodies indicated. A, Representative immunoblot images of lysates from PF-719-treated iPSC-derived human cortical neurons. B and C, Quantification of A. Pyk2 inhibition significantly increased LKB1 activity (pLKB1 S428 normalized to total LKB1) at 2.0 μM PF-719 (B) and significantly increased p38 MAPK activity (pp38 MAPK T180/Y182 normalized to total p38 MAPK) at every concentration of PF-719 (C). Data are graphed as mean ± SEM, one-way ANOVA with Dunnett’s multiple comparisons test, *p < 0.05, **p < 0.01, ***p < 0.001, n = 6. DF, TBS-soluble lysates from hippocampi of 9.5–10.5-month-old WT, Pyk2−/−, PS190/+ and PS190/+;Pyk2−/− animals were separated by SDS-PAGE and immunoblotted with the LKB1 and p38 MAPK antibodies listed. D, Representative immunoblot images of TBS-soluble hippocampal lysates. E and F, Quantification of D. A significant increase in TBS-soluble LKB1 activity (pLKB1 S428 normalized to total LKB1) is observed in PS190/+;Pyk2−/− animals compared to WT and Pyk2−/− animals (E), while there were no significant differences in TBS-soluble MAPK activity (pp38 MAPK T180/Y182 normalized to total p38 MAPK) observed across genotypes (F). Data are graphed as mean ± SEM, one-way ANOVA with Tukey’s multiple comparisons test, *p < 0.05, **p < 0.01, n = 7–11 mice. GK, TBS-insoluble, SDS-soluble lysates from hippocampi of 9.5–10.5-month-old WT, Pyk2−/−, PS190/+ and PS190/+;Pyk2−/− animals were separated by SDS-PAGE and immunoblotted with the antibodies indicated. G, Representative immunoblot images of TBS-insoluble, SDS-soluble hippocampal lysates. Arrowhead indicates pp38 MAPK T180/Y182. HK, Quantification of G. While no significant differences in TBS-insoluble, SDS-soluble LKB1 activity (pLKB1 S428 normalized to total LKB1) were observed across genotypes (H), PS190/+;Pyk2−/− animals demonstrated a significant increase in TBS-insoluble, SDS-soluble p38 MAPK activity (pp38 MAPK T180/Y182 normalized to total p38 MAPK) compared to WT and Pyk2−/− animals (I). No differences were observed in absolute levels of TBS-insoluble, SDS-soluble phospho-LKB1 (pLKB1 S428 normalized to β-Actin) across genotypes (J), however PS190/+;Pyk2−/− exhibited a significant increase in absolute levels of TBS-insoluble, SDS-soluble phosho-p38 MAPK (pp38 MAPK T180/Y182 normalized to β-Actin) compared to WT, Pyk2−/− and PS190/+ animals (K). Data are graphed as mean ± SEM, one-way ANOVA with Tukey’s multiple comparisons test, *p < 0.05, **p < 0.01, ****p < 0.0001, n = 8–16 mice

Similar articles

Cited by

References

    1. 2021 Alzheimer's disease facts and figures. Alzheimers Dement. 2021;17:327–406. - PubMed
    1. Kamboh MI, Demirci FY, Wang X, Minster RL, Carrasquillo MM, Pankratz VS, Younkin SG, Saykin AJ, Alzheimer's disease neuroimaging I. Jun G, et al. Genome-wide association study of Alzheimer's disease. Transl Psychiatry. 2012;2:e117. doi: 10.1038/tp.2012.45. - DOI - PMC - PubMed
    1. Lambert JC, Ibrahim-Verbaas CA, Harold D, Naj AC, Sims R, Bellenguez C, DeStafano AL, Bis JC, Beecham GW, Grenier-Boley B, et al. Meta-analysis of 74,046 individuals identifies 11 new susceptibility loci for Alzheimer's disease. Nat Genet. 2013;45:1452–1458. doi: 10.1038/ng.2802. - DOI - PMC - PubMed
    1. Beecham GW, Hamilton K, Naj AC, Martin ER, Huentelman M, Myers AJ, Corneveaux JJ, Hardy J, Vonsattel JP, Younkin SG, et al. Genome-wide association meta-analysis of neuropathologic features of Alzheimer's disease and related dementias. Plos Genet. 2014;10:e1004606. doi: 10.1371/journal.pgen.1004606. - DOI - PMC - PubMed
    1. Li YQ, Tan MS, Wang HF, Tan CC, Zhang W, Zheng ZJ, Kong LL, Wang ZX, Tan L, Jiang T, et al. Common variant in PTK2B is associated with late-onset Alzheimer's disease: a replication study and meta-analyses. Neurosci Lett. 2016;621:83–87. doi: 10.1016/j.neulet.2016.04.020. - DOI - PubMed

Publication types