. 2022 Apr 29;10(1):68.
doi: 10.1186/s40168-022-01243-w.

Fecal microbiota transfer between young and aged mice reverses hallmarks of the aging gut, eye, and brain

Affiliations

Fecal microbiota transfer between young and aged mice reverses hallmarks of the aging gut, eye, and brain

Aimée Parker et al. Microbiome. .

Abstract

Background: Altered intestinal microbiota composition in later life is associated with inflammaging, declining tissue function, and increased susceptibility to age-associated chronic diseases, including neurodegenerative dementias. Here, we tested the hypothesis that manipulating the intestinal microbiota influences the development of major comorbidities associated with aging and, in particular, inflammation affecting the brain and retina.

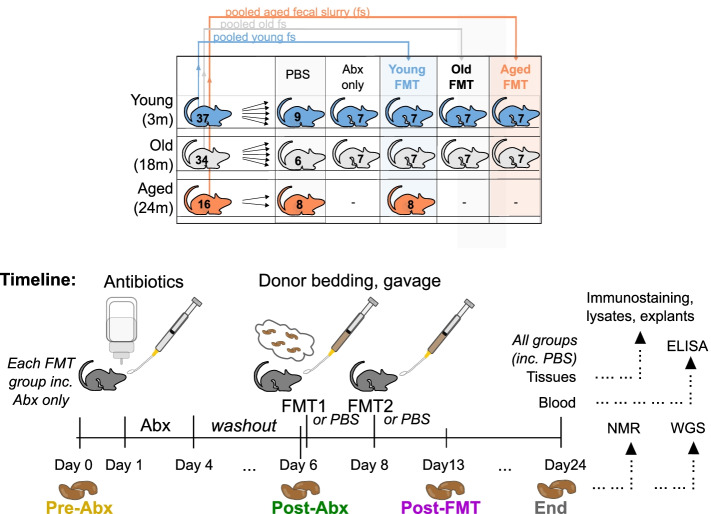
Methods: Using fecal microbiota transplantation, we exchanged the intestinal microbiota of young (3 months), old (18 months), and aged (24 months) mice. Whole metagenomic shotgun sequencing and metabolomics were used to develop a custom analysis workflow, to analyze the changes in gut microbiota composition and metabolic potential. Effects of age and microbiota transfer on the gut barrier, retina, and brain were assessed using protein assays, immunohistology, and behavioral testing.

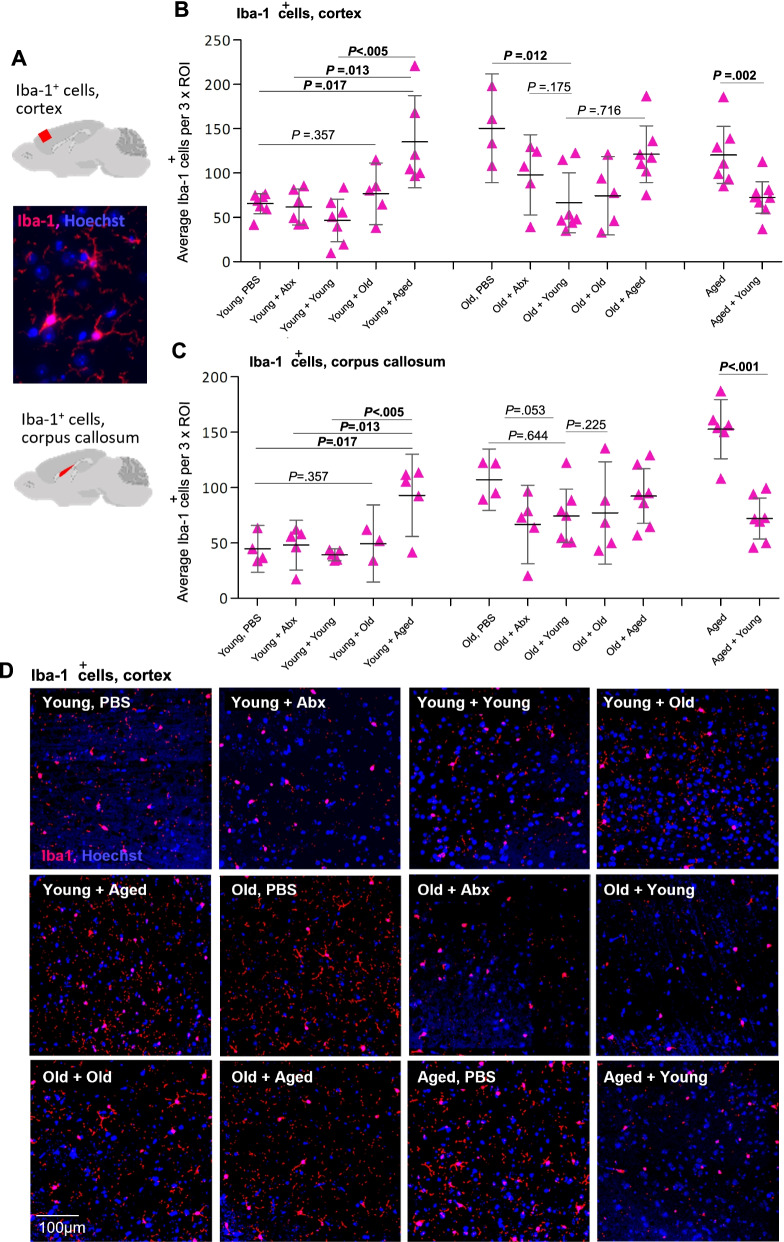
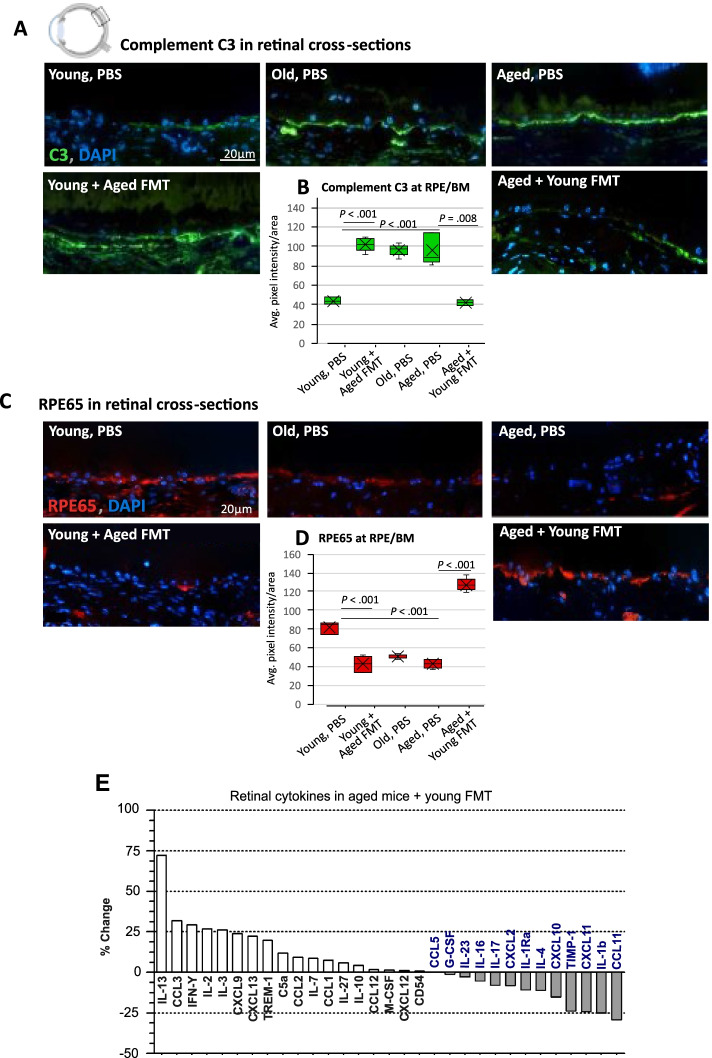
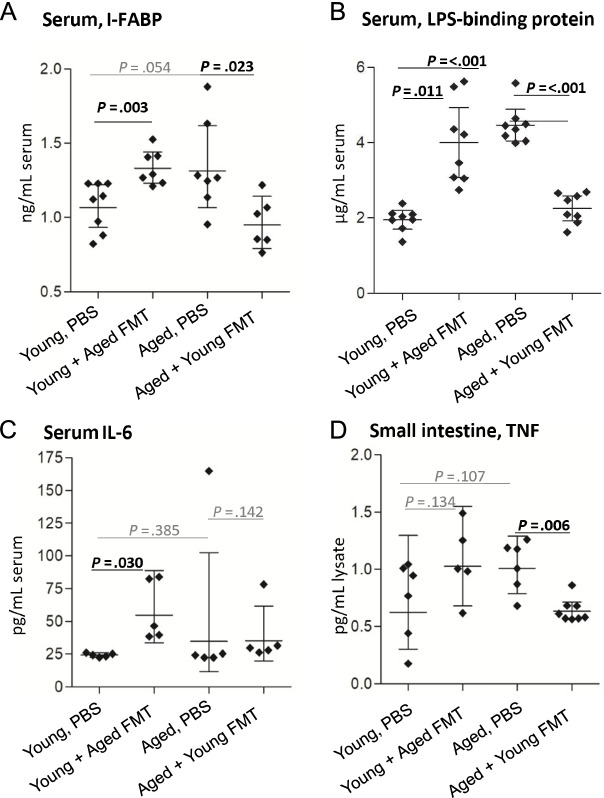
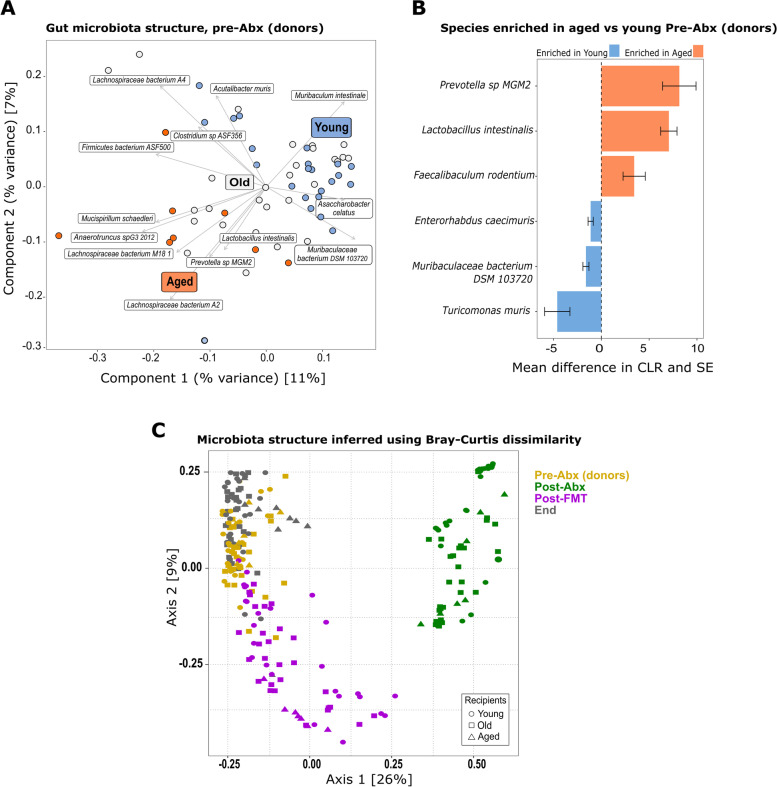
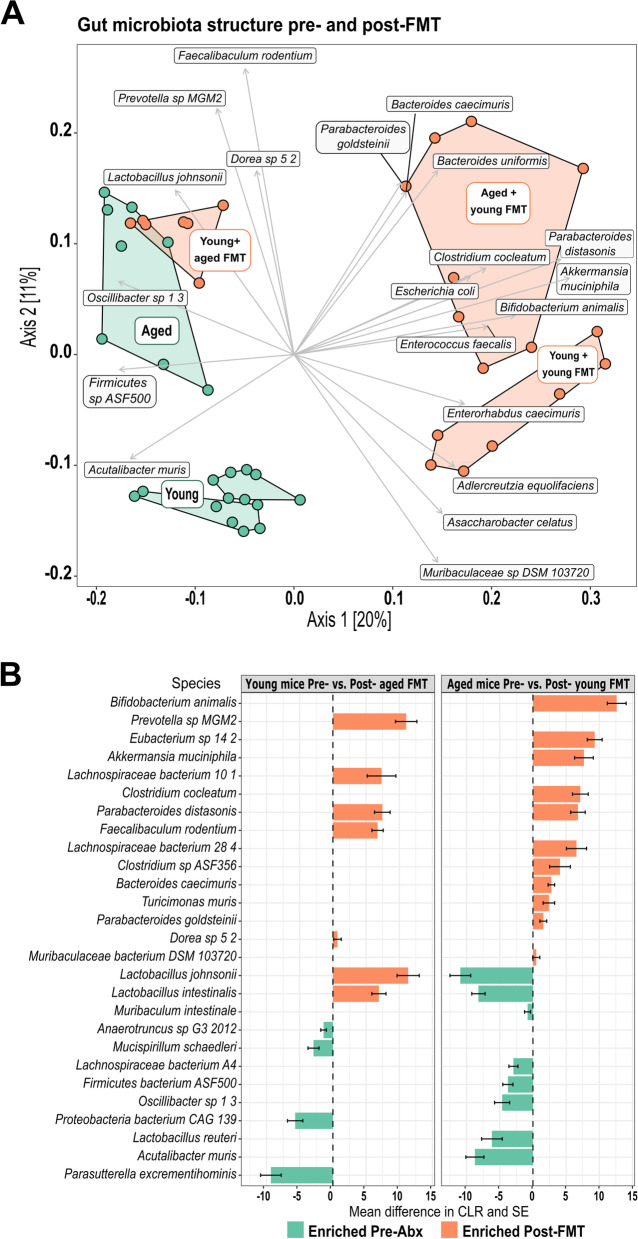
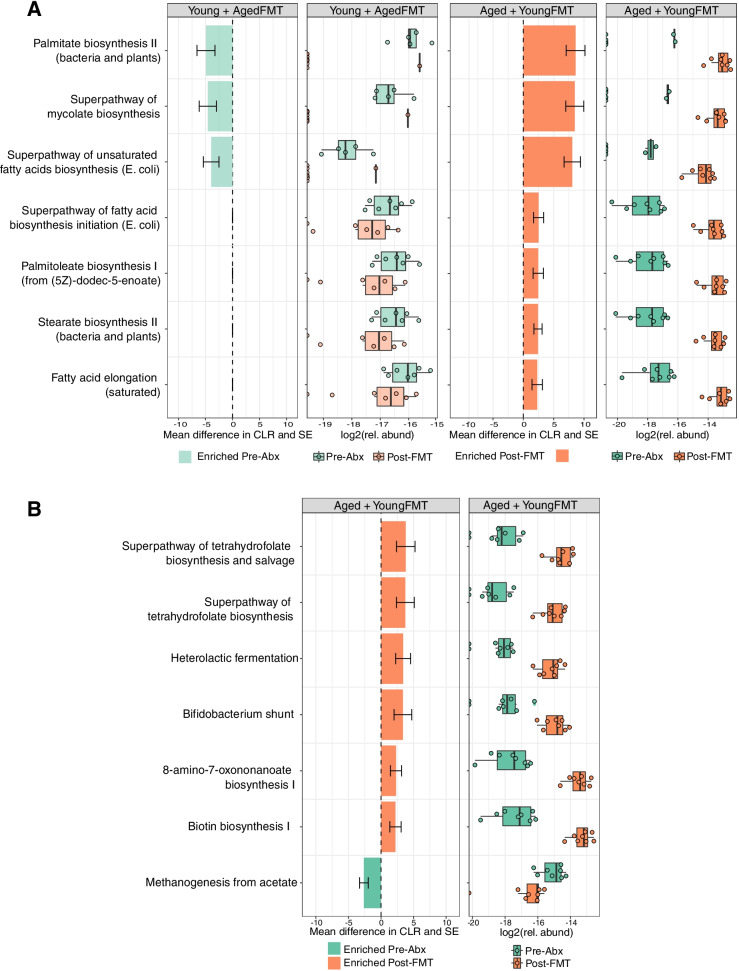
Results: We show that microbiota composition profiles and key species enriched in young or aged mice are successfully transferred by FMT between young and aged mice and that FMT modulates resulting metabolic pathway profiles. The transfer of aged donor microbiota into young mice accelerates age-associated central nervous system (CNS) inflammation, retinal inflammation, and cytokine signaling and promotes loss of key functional protein in the eye, effects which are coincident with increased intestinal barrier permeability. Conversely, these detrimental effects can be reversed by the transfer of young donor microbiota.

Conclusions: These findings demonstrate that the aging gut microbiota drives detrimental changes in the gut-brain and gut-retina axes suggesting that microbial modulation may be of therapeutic benefit in preventing inflammation-related tissue decline in later life. Video abstract.

Keywords: Aging; Fecal microbiota transplantation; Gut–brain axis; Gut–retina; Inflammaging; Intestine; Leaky gut; Microbiota.


Conflict of interest statement

The authors declare that they have no competing interests.

Figures

Fig. 1
Fig. 1
Experimental Overview. A Mouse grouping and B microbiota transfer timeline overview. Young (3 m, blue), old (18 m, white), or aged (24 m, orange) SPF C57BL/6 males were randomly allocated to experimental cages by age group 2 weeks before the start of the experiment. Existing microbiota were depleted by a 3-day antibiotic cocktail (Abx; oral gavage and drinking water). Post-antibiotic washout, recipients were rehoused in donor cages containing soiled bedding and fecal pellets and were twice delivered donor microbiota by oral gavage of fecal slurry preparation from 3-, 18-, or 24-month-old donors. Antibiotic-only groups were returned to their home cage and received no FMT
Fig. 2
Fig. 2
Inflammatory (Iba-1+) microglia density in cortex and corpus callosum is regulated by the intestinal microbiota. A Iba-1+ microglia were identified by immunostaining (red), nuclei counterstained with Hoechst (blue), and quantified in the cortex and corpus callosum (highlighted in cartoons) of sagittal mouse brain sections from all groups of mice. B Quantification of Iba-1+ cells in the cortex, average count across 3 regions of interest (ROI) from each of 4–7 mice per group from all groups. C Quantification of Iba-1+ cells in the corpus callosum, an average of 3 regions of interest from each of 4–7 mice per group from all groups. Statistical analysis between the groups of interest by Welch’s t test; error bars denote 95% CI. Significant values are in bold. D Representative immunostaining of Iba-1+ cells in the cortex of young, old, and aged mice, either treated with PBS only, treated with antibiotics only, or with antibiotics followed by FMT from young, old, or aged donors (see also Fig. S1)
Fig. 3
Fig. 3
Heterochronic microbiota transfer reverses age-associated retinal inflammation and functional visual protein expression. A Immunostaining of complement C3 (green) in the cross-sections of the retinal pigment epithelium (RPE)/Bruch’s membrane (BM) interface from mice receiving PBS vs. heterochronic FMT. B Quantification of the average complement C3 staining pixel intensity (PI) per area (1280 μm2) at the RPE/BM interface in young, old, or aged PBS-treated mice vs. heterochronic FMT (n = 5 mice/group). C Immunostaining (RPE65, red; nuclei DAPI, blue) and quantification (D) of the crucial visual cycle protein RPE65 in the cross-sections of the RPE/BM interface from untreated mice vs. mice receiving heterochronic FMT, n = 5 mice/group. Statistical comparison between ages and between the FMT and PBS groups by Welch’s t test. E Percentage change in the expression of retinal lysate cytokine levels in aged mice receiving young donor FMT
Fig. 4
Fig. 4
Heterochronic FMT reverses age-associated breakdown of epithelial barrier integrity and systemic inflammation. A ELISA analysis of serum intestinal fatty acid-binding protein (I-FABP) in young and aged mice (n = 6–8/group) before and after heterochronic FMT. B ELISA analysis of serum lipopolysaccharide-binding protein (n = 8/group). C Serum levels of IL-6 were analyzed by multiplex magnetic bead assay (Luminex) (n = 5/group). D TNF levels in small intestinal tissue lysates as measured by specific ELISA (n = 5–8/group). Statistical comparison between ages and between FMT and PBS groups by Welch’s t test; error bars denote 95% CI; significant results in bold black text
Fig. 5
Fig. 5
Fecal microbiota structure pre- and post-FMT. A PCoA showing clustering of fecal microbiota samples from young (blue), old (white), and aged (orange) mice pre-antibiotic treatment (Pre-Abx) overlaid with species driving the clustering. B Significantly enriched species in aged mice (orange bars, n = 8) vs. young mice (blue bars, n = 7) pre-antibiotic treatment (Pre-Abx); the results are displayed as the mean difference in centered log ratio, CLR, and SE. C PCoA (Bray–Curtis) depicting clustering of all mice from all age and treatment groups pre- (yellow) and post- (green) antibiotic treatment, post-FMT (magenta), and at the end of the experiment (“End,” gray). D PCoA (Bray–Curtis) depicting clustering of all mice from all age and treatment groups, colored by age group, young in blue markers, old in white/black markers, and aged in orange markers (see also Fig. S2)
Fig. 6
Fig. 6
Donor-derived species define the fecal microbiota composition of FMT recipients. A PCoA showing clustering of fecal microbiota samples from young and aged mice Pre–Abx (green) and post-FMT (orange), and overlaid with species driving the clustering. B Differential abundance analysis (results displayed as the mean difference in centered log ratio, CLR, and SE) of enriched species post-heterochronic transfer (Post-FMT) vs. pre-transfer (Pre–Abx) in young and aged mice. Family abundance, young mice receiving coeval transfer, and antibiotic-only groups shown in Fig. S3
Fig. 7
Fig. 7
Heterochronic transfer alters lipid and vitamin metabolism. A Selected lipid metabolism pathways significantly enriched or depleted in young and aged mice following heterochronic FMT. B Other selected pathways, which were significantly enriched or depleted in aged mice receiving young FMT. The results are displayed as the mean difference in centered log ratio (CLR); error bars denote standard error. Boxplots depict log2 transformed relative abundance of individual pathways

Similar articles

Cited by

References

    1. Takeda A, Baffi JZ, Kleinman ME, Cho WG, Nozaki M, Yamada K, et al. CCR3 is a target for age-related macular degeneration diagnosis and therapy. Nature. 2009;460(7252):225–230. doi: 10.1038/NATURE08151. - DOI - PMC - PubMed
    1. Aleman FDD, Valenzano DR. “Microbiome evolution during host aging.” edited by John M. Leong. PLoS Pathog. 2019;15(7):e1007727. doi: 10.1371/journal.ppat.1007727. - DOI - PMC - PubMed
    1. Alpizar-Rodriguez D, Lesker TR, Gronow A, Gilbert B, Raemy E, Lamacchia C, et al. Prevotella copri in individuals at risk for rheumatoid arthritis. Ann Rheum Dis. 2019;78(5):590–593. doi: 10.1136/annrheumdis-2018-214514. - DOI - PubMed
    1. Andriessen EMMAMA, Wilson AM, Mawambo G, Dejda A, Miloudi K, Sennlaub F, et al. Gut microbiota influences pathological angiogenesis in obesity-driven choroidal neovascularization. EMBO Mol Med. 2016;8(12):1366–1379. doi: 10.15252/emmm.201606531. - DOI - PMC - PubMed
    1. Arbizu, PM. 2020. “PairwiseAdonis: pairwise multilevel comparison using Adonis. R Package Version 0.4.” https://github.com/pmartinezarbizu/pairwiseAdonis.

Publication types

LinkOut - more resources