

Geographical resistome profiling in the honeybee microbiome reveals resistance gene transfer conferred by mobilizable plasmids
- PMID: 35501925
- PMCID: PMC9063374
- DOI: 10.1186/s40168-022-01268-1
Geographical resistome profiling in the honeybee microbiome reveals resistance gene transfer conferred by mobilizable plasmids
Abstract
Background: The spread of antibiotic resistance genes (ARGs) has been of global concern as one of the greatest environmental threats. The gut microbiome of animals has been found to be a large reservoir of ARGs, which is also an indicator of the environmental antibiotic spectrum. The conserved microbiota makes the honeybee a tractable and confined ecosystem for studying the maintenance and transfer of ARGs across gut bacteria. Although it has been found that honeybee gut bacteria harbor diverse sets of ARGs, the influences of environmental variables and the mechanism driving their distribution remain unclear.
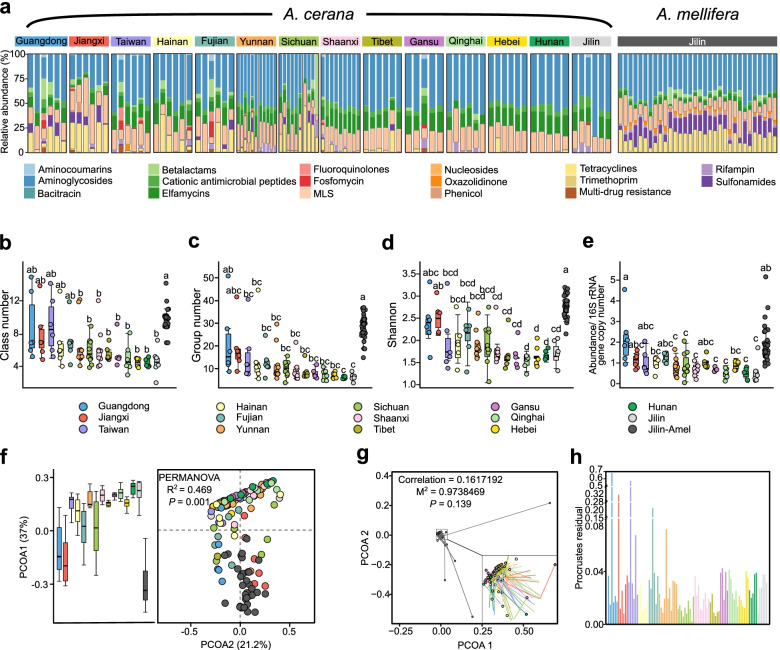
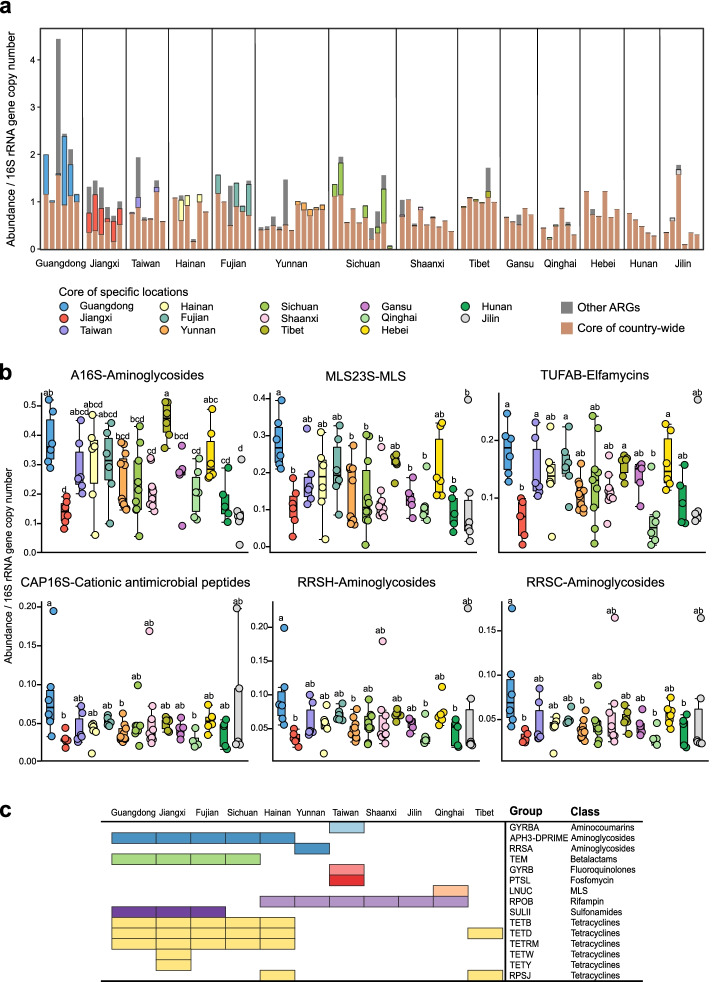
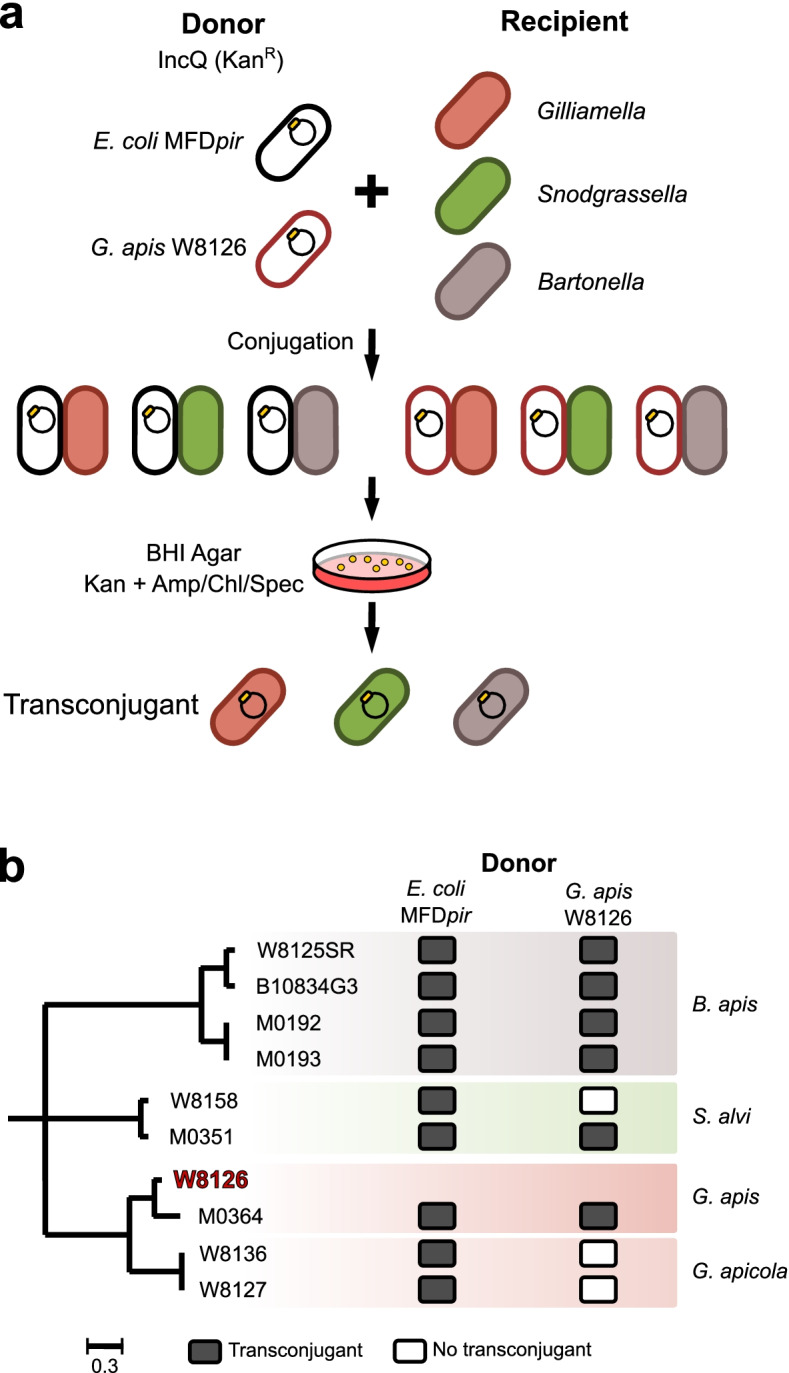
Results: We characterized the gut resistome of two closely related honeybee species, Apis cerana and Apis mellifera, domesticated in 14 geographic locations across China. The composition of the ARGs was more associated with host species rather than with geographical distribution, and A. mellifera had a higher content of ARGs in the gut. There was a moderate geographic pattern of resistome distribution, and several core ARG groups were found to be prevalent among A. cerana samples. These shared genes were mainly carried by the honeybee-specific gut members Gilliamella and Snodgrassella. Transferrable ARGs were frequently detected in honeybee guts, and the load was much higher in A. mellifera samples. Genomic loci of the bee gut symbionts containing a streptomycin resistance gene cluster were nearly identical to those of the broad-host-range IncQ plasmid, a proficient DNA delivery system in the environment. By in vitro conjugation experiments, we confirmed that the mobilizable plasmids could be transferred between honeybee gut symbionts by conjugation. Moreover, "satellite plasmids" with fragmented genes were identified in the integrated regions of different symbionts from multiple areas.
Conclusions: Our study illustrates that the gut microbiota of different honeybee hosts varied in their antibiotic resistance structure, highlighting the role of the bee microbiome as a potential bioindicator and disseminator of antibiotic resistance. The difference in domestication history is highly influential in the structuring of the bee gut resistome. Notably, the evolution of plasmid-mediated antibiotic resistance is likely to promote the probability of its persistence and dissemination. Video Abstract.
Keywords: A. mellifera; Antibiotic resistance genes; Apis cerana; Gut resistome; Horizontal transfer; IncQ.
© 2022. The Author(s).
Conflict of interest statement
The authors declare that they have no competing interests.
Figures


Similar articles
-
The honeybee gut resistome and its role in antibiotic resistance dissemination.Integr Zool. 2023 Nov;18(6):1014-1026. doi: 10.1111/1749-4877.12714. Epub 2023 Apr 9. Integr Zool. 2023. PMID: 36892101 Review.
-
Horizontal plasmid transfer promotes antibiotic resistance in selected bacteria in Chinese frog farms.Environ Int. 2024 Aug;190:108905. doi: 10.1016/j.envint.2024.108905. Epub 2024 Jul 23. Environ Int. 2024. PMID: 39089095
-
Genetic divergence and functional convergence of gut bacteria between the Eastern honey bee Apis cerana and the Western honey bee Apis mellifera.J Adv Res. 2021 Aug 10;37:19-31. doi: 10.1016/j.jare.2021.08.002. eCollection 2022 Mar. J Adv Res. 2021. PMID: 35499050 Free PMC article.
-
Strain diversity and host specificity of the gut symbiont Gilliamella in Apis mellifera, Apis cerana and Bombus terrestris.Microbiol Res. 2025 Apr;293:128048. doi: 10.1016/j.micres.2025.128048. Epub 2025 Jan 6. Microbiol Res. 2025. PMID: 39813751
-
Good microbes, bad genes? The dissemination of antimicrobial resistance in the human microbiome.Gut Microbes. 2022 Jan-Dec;14(1):2055944. doi: 10.1080/19490976.2022.2055944. Gut Microbes. 2022. PMID: 35332832 Free PMC article. Review.
Cited by
-
Comparing the taxonomic and functional profiles of gut microbiota from three pig breeds by metagenomic sequencing.Front Genet. 2022 Oct 14;13:999535. doi: 10.3389/fgene.2022.999535. eCollection 2022. Front Genet. 2022. PMID: 36313418 Free PMC article.
-
Environmental Effects on Bee Microbiota.Microb Ecol. 2023 Oct;86(3):1487-1498. doi: 10.1007/s00248-023-02226-6. Epub 2023 Apr 26. Microb Ecol. 2023. PMID: 37099156 Review.
-
The Bee Gut Microbiota: Bridging Infective Agents Potential in the One Health Context.Int J Mol Sci. 2024 Mar 27;25(7):3739. doi: 10.3390/ijms25073739. Int J Mol Sci. 2024. PMID: 38612550 Free PMC article.
-
Identification of peptides from honeybee gut symbionts as potential antimicrobial agents against Melissococcus plutonius.Nat Commun. 2023 Nov 24;14(1):7650. doi: 10.1038/s41467-023-43352-6. Nat Commun. 2023. PMID: 38001079 Free PMC article.
-
Liposome-based RNAi delivery in honeybee for inhibiting parasite Nosema ceranae.Synth Syst Biotechnol. 2024 Jul 18;9(4):853-860. doi: 10.1016/j.synbio.2024.07.003. eCollection 2024 Dec. Synth Syst Biotechnol. 2024. PMID: 39139857 Free PMC article.
References
Publication types
MeSH terms
Substances
LinkOut - more resources
Full Text Sources
Research Materials
