

Inner Filter Effect Correction for Fluorescence Measurements in Microplates Using Variable Vertical Axis Focus
- PMID: 35502461
- PMCID: PMC9118198
- DOI: 10.1021/acs.analchem.2c01031
Inner Filter Effect Correction for Fluorescence Measurements in Microplates Using Variable Vertical Axis Focus
Abstract
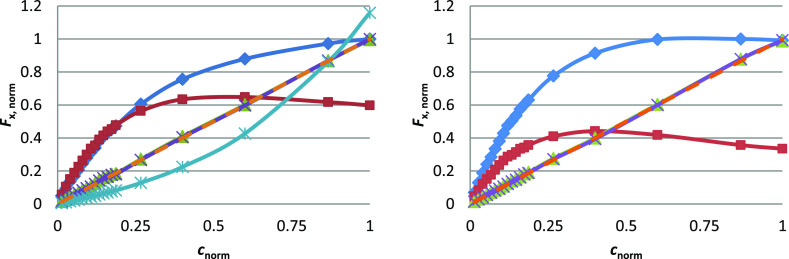
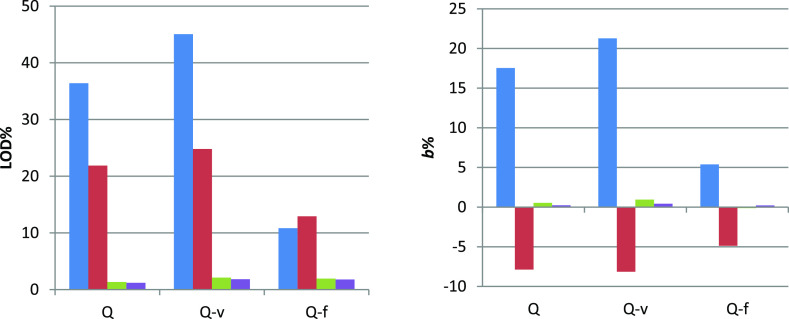
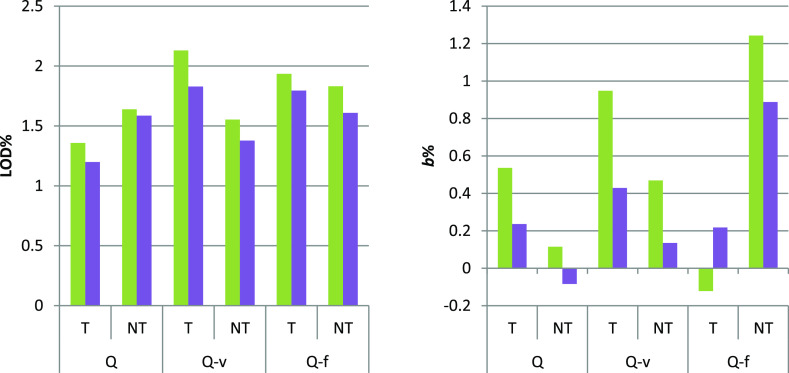
The inner filter effect (IFE) hinders fluorescence measurements, limiting linear dependence of fluorescence signals to low sample concentrations. Modern microplate readers allow movement of the optical element in the vertical axis, changing the relative position of the focus and thus the sample geometry. The proposed Z-position IFE correction method requires only two fluorescence measurements at different known vertical axis positions (z-positions) of the optical element for the same sample. Samples of quinine sulfate, both pure and in mixtures with potassium dichromate, showed a linear dependence of corrected fluorescence on fluorophore concentration (R2 > 0.999), up to Aex ≈ 2 and Aem ≈ 0.5. The correction extended linear fluorescence response over ≈98% of the concentration range with ≈1% deviation of the calibration slope, effectively eliminating the need for sample dilution or separate absorbance measurements to account for IFE. The companion numerical IFE correction method further eliminates the need for any geometric parameters with similar results. Both methods are available online at https://ninfe.science.
Conflict of interest statement
The authors declare no competing financial interest.
Figures

References
-
- Valeur B.; Berberan-Santos M. N.. Molecular Fluorescence: Principles and Applications, 2nd; Wiley-VCH Verlag GmbH & Co. KGaA: Weinheim, Germany, 2013.
-
- Lakowicz J. R.Instrumentation for Fluorescence Spectroscopy. Principles of Fluorescence Spectroscopy; Springer US: Boston, MA, 2006; pp 27–61.
-
- Kimball J.; Chavez J.; Ceresa L.; Kitchner E.; Nurekeyev Z.; Doan H.; Szabelski M.; Borejdo J.; Gryczynski I.; Gryczynski Z. On the Origin and Correction for Inner Filter Effects in Fluorescence Part I: Primary Inner Filter Effect-the Proper Approach for Sample Absorbance Correction. Methods Appl. Fluoresc. 2020, 8, 033002.10.1088/2050-6120/ab947c. - DOI - PubMed
Publication types
MeSH terms
Substances
LinkOut - more resources
Full Text Sources
