. 2022 May 1;78(Pt 3):158-171.
doi: 10.1107/S2053273322002534. Epub 2022 Apr 28.

Identification of a coherent twin relationship from high-resolution reciprocal-space maps

Affiliations

Identification of a coherent twin relationship from high-resolution reciprocal-space maps

Semën Gorfman et al. Acta Crystallogr A Found Adv. .

Abstract

Twinning is a common crystallographic phenomenon which is related to the formation and coexistence of several orientation variants of the same crystal structure. It may occur during symmetry-lowering phase transitions or during the crystal growth itself. Once formed, twin domains play an important role in defining physical properties: for example, they underpin the giant piezoelectric effect in ferroelectrics, superelasticity in ferroelastics and the shape-memory effect in martensitic alloys. Regrettably, there is still a lack of experimental methods for the characterization of twin domain patterns. Here, a theoretical framework and algorithm are presented for the recognition of ferroelastic domains, as well as the identification of the coherent twin relationship using high-resolution reciprocal-space mapping of X-ray diffraction intensity around split Bragg peaks. Specifically, the geometrical theory of twinned ferroelastic crystals [Fousek & Janovec (1969). J. Appl. Phys. 40, 135-142] is adapted for the analysis of the X-ray diffraction patterns. The necessary equations are derived and an algorithm is outlined for the calculation of the separation between the Bragg peaks, diffracted from possible coherent twin domains, connected to one another via a mismatch-free interface. It is demonstrated that such separation is always perpendicular to the planar interface between mechanically matched domains. For illustration purposes, the analysis is presented of the separation between the peaks diffracted from tetragonal and rhombohedral domains in the high-resolution reciprocal-space maps of BaTiO3 and PbZr1-xTixO3 crystals. The demonstrated method can be used to analyse the response of multi-domain patterns to external perturbations such as electric field, change of temperature or pressure.

Keywords: domain walls; ferroelastic domains; high-resolution X-ray diffraction.


Figures

Figure 1
Figure 1
Schematic illustration of two-dimensional ferroelastic domains and their unit cells (2 × 2 supercells are shown). The middle image (marked by the letter C, standing for the two-dimensional prototype of ‘cubic’) corresponds to the single-domain ‘parent’ phase. The lattice basis vectors here are a i0 or, symmetry equivalently, formula image . The right and left images (marked by the letter R, standing for the two-dimensional prototype of ‘rhombohedral’) correspond to the ferroelastic domains. The lattice basis vectors here (a im , m = 1…2) are chosen in such a way that a im are nearly parallel to a i0.
Figure 2
Figure 2
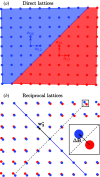
Two-dimensional illustration of direct and reciprocal lattices of two domains. (a) The lattices of two two-dimensional tetragonal (= rectangular) domains connected along their common formula image plane. (b) Their reciprocal lattices. The dashed line is parallel to the formula image plane (domain wall); the inset highlights the separation between corresponding reciprocal-lattice vectors, showing that it is perpendicular to the domain wall.
Figure 3
Figure 3
Definition and numbering of the tetragonal domain variants. The direction of the unique (fourfold symmetry) axis with respect to the basis vectors of the domains a im (m = 1…3) is given. It is [100] for the a domain, [010] for the b domain and [001] for the c domain. This is also the direction of the spontaneous polarization in the case when the structure is polar.
Figure 4
Figure 4
The definition and numbering of four rhombohedral domain variants. The direction of the unique axis (threefold symmetry axis in this case) is given relative to the basis vectors a im . These directions coincide with the direction of the spontaneous polarization for the case where the structure is polar. The basis vectors of the paraelastic phase a i0 are shown in the figure.
Figure 5
Figure 5
I z (B x , B y ) projections of the reciprocal-space maps of 102, 002, 222 and 013 reflections from a BaTiO3 crystal containing a ferroelastic domain of tetragonal symmetry. The white lines correspond to the equation formula image [here |B calc| was calculated using tetragonal lattice parameters a = 3.962 (1), c = 4.005 (2) Å].
Figure 6
Figure 6
I z (B x B y ), I y (B x B z ) and I x (B y B z ) projections of three-dimensional diffraction intensity distribution I(B x , B y , B z ) around the 102 family of Bragg peaks of BaTiO3. The panels (a)–(c) show six sub-peaks that are located and numbered in the maps. The panels (d)–(f) show the assignment of the peaks to the domains (as presented in Tables 5 ▸ and 6 ▸). The solid lines connect the peak pairs, which correspond to the matched domains. The Miller indices of the matching plane are indicated in the brackets.
Figure 7
Figure 7
Same as Fig. 5 ▸ except for the reciprocal-space maps of 111, 033, formula image and 124 reflections from a twinned PbZr0.75Ti0.25O3 crystal containing domains of rhombohedral symmetry. The white lines correspond to the reciprocal-lattice vector lengths, which are calculated using rhombohedral lattice parameters a = b = c = 4.115 (1) Å, α = β = γ = 89.686°.
Figure 8
Figure 8
I z (B x B y ), I y (B x B z ) and I x (B y B z ) projections of three-dimensional diffraction intensity distribution I(B x , B y , B z ) around the 124 family of Bragg peaks of PZT (PbZr0.75Ti0.25O3). The panels (a)–(c) show four sub-peaks that are located and numbered in the maps. The panels (d)–(f) show the assignment of the peaks to the domains (as presented in Tables 7 ▸ and 8 ▸). The solid lines connect the peak pairs, which correspond to the matched domains. The Miller indices of the matching plane are indicated in the brackets.

References

    1. Authier, A. (2003). International Tables for Crystallography, Vol. D, Physical Properties of Crystals. Dordrecht: Kluwer.
    1. Beanland, R. (2011). Acta Cryst. A67, 191–199. - PubMed
    1. Bhattacharya, K. (2003). Microstructure of Martensite: Why it Forms and How it Gives Rise to the Shape-memory Effect. Oxford University Press.
    1. Braun, D., Schmidbauer, M., Hanke, M. & Schwarzkopf, J. (2018). Nanotechnology, 29, 015701. - PubMed
    1. Cahn, R. W. (1954). Adv. Phys. 3, 363–445.