. 2022 Dec 1;163(12):2348-2364.
doi: 10.1097/j.pain.0000000000002628. Epub 2022 Mar 31.

Profiling the molecular signature of satellite glial cells at the single cell level reveals high similarities between rodents and humans

Affiliations

Profiling the molecular signature of satellite glial cells at the single cell level reveals high similarities between rodents and humans

Oshri Avraham et al. Pain. .

Abstract

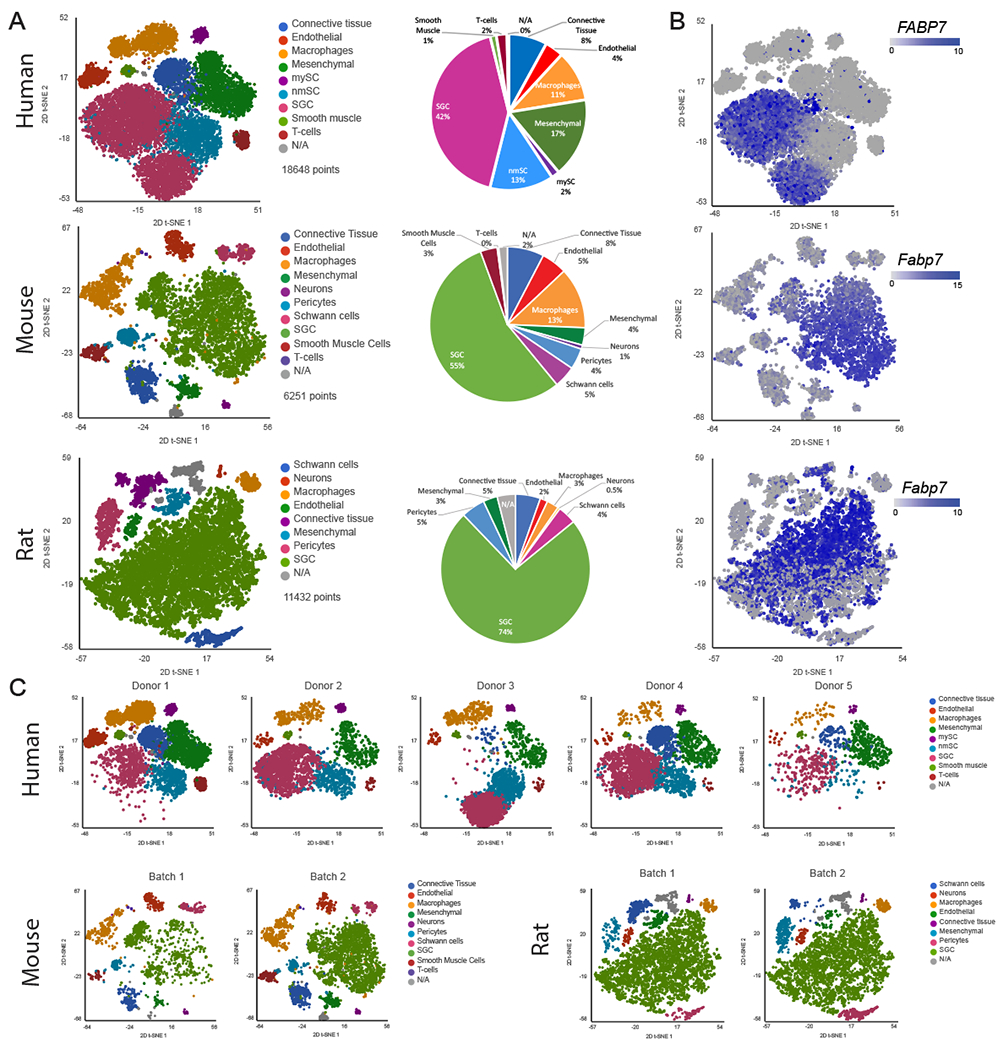
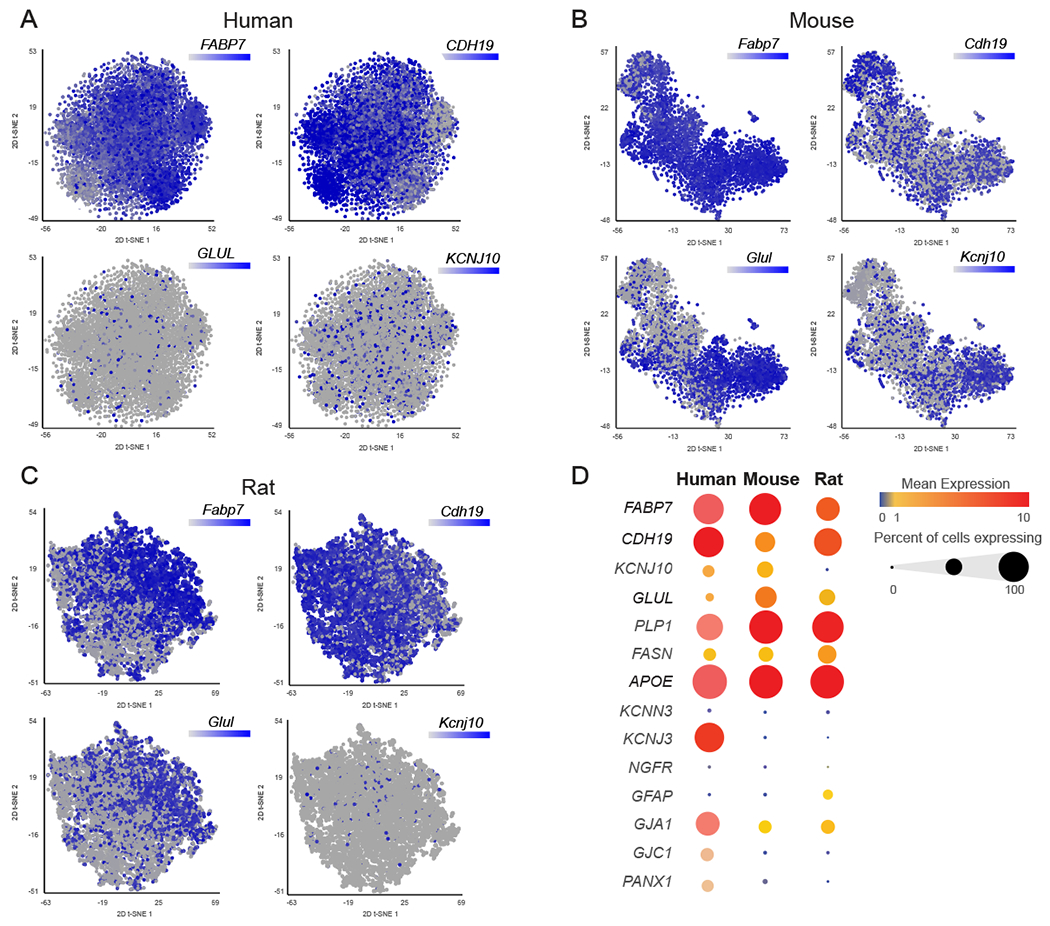
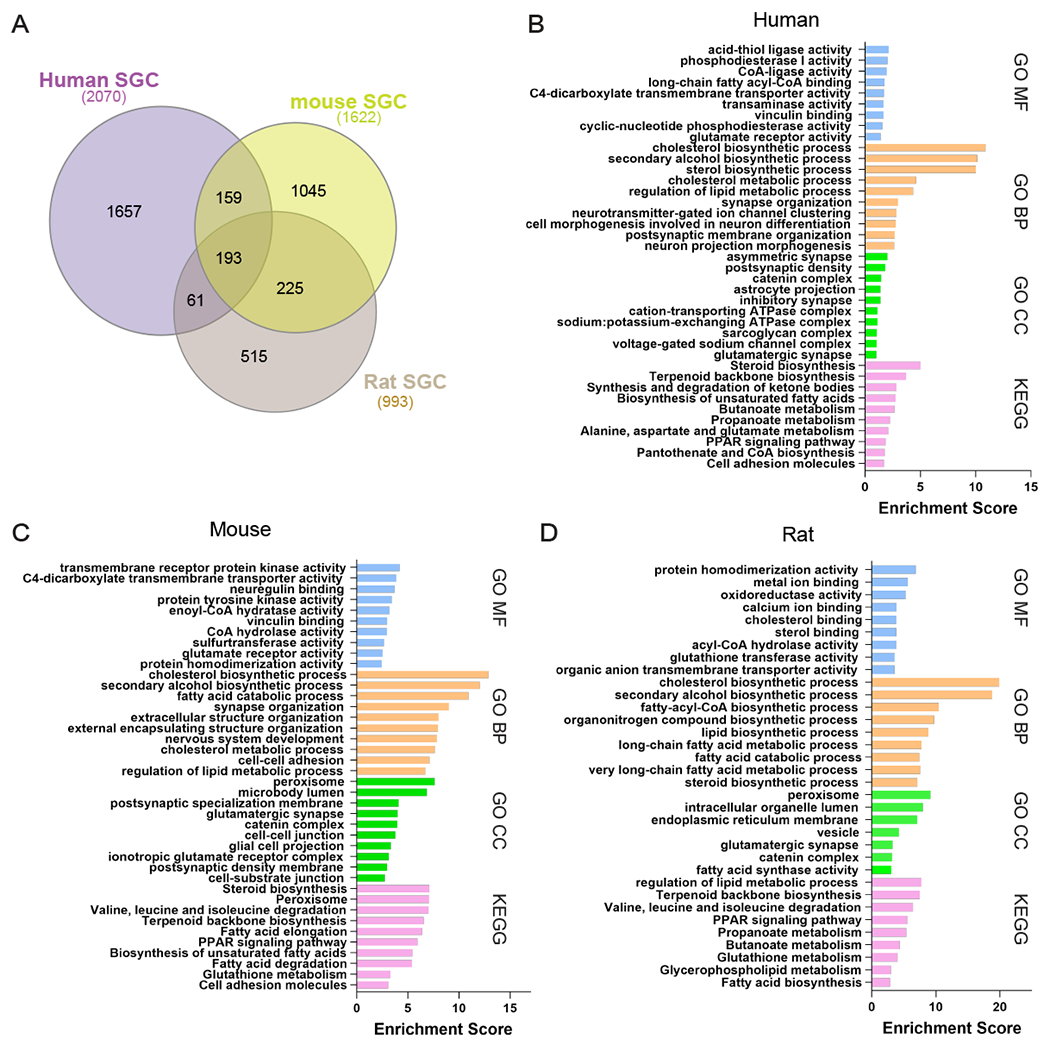
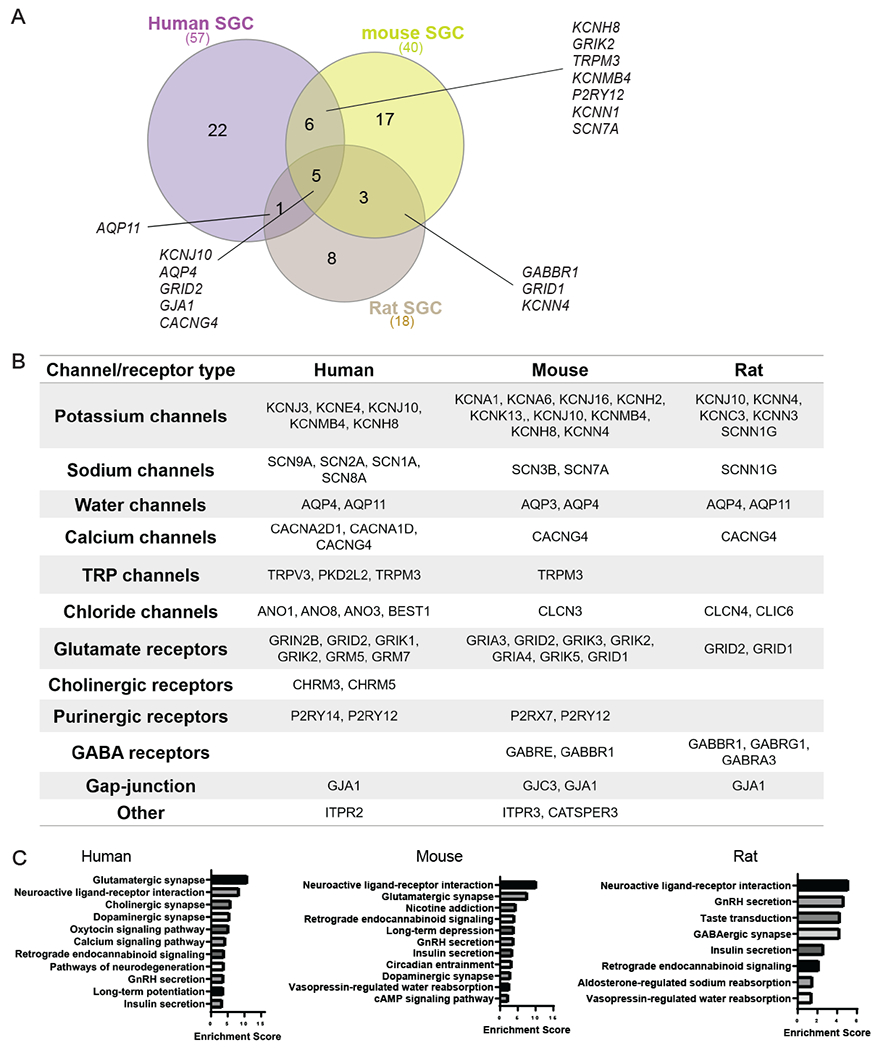
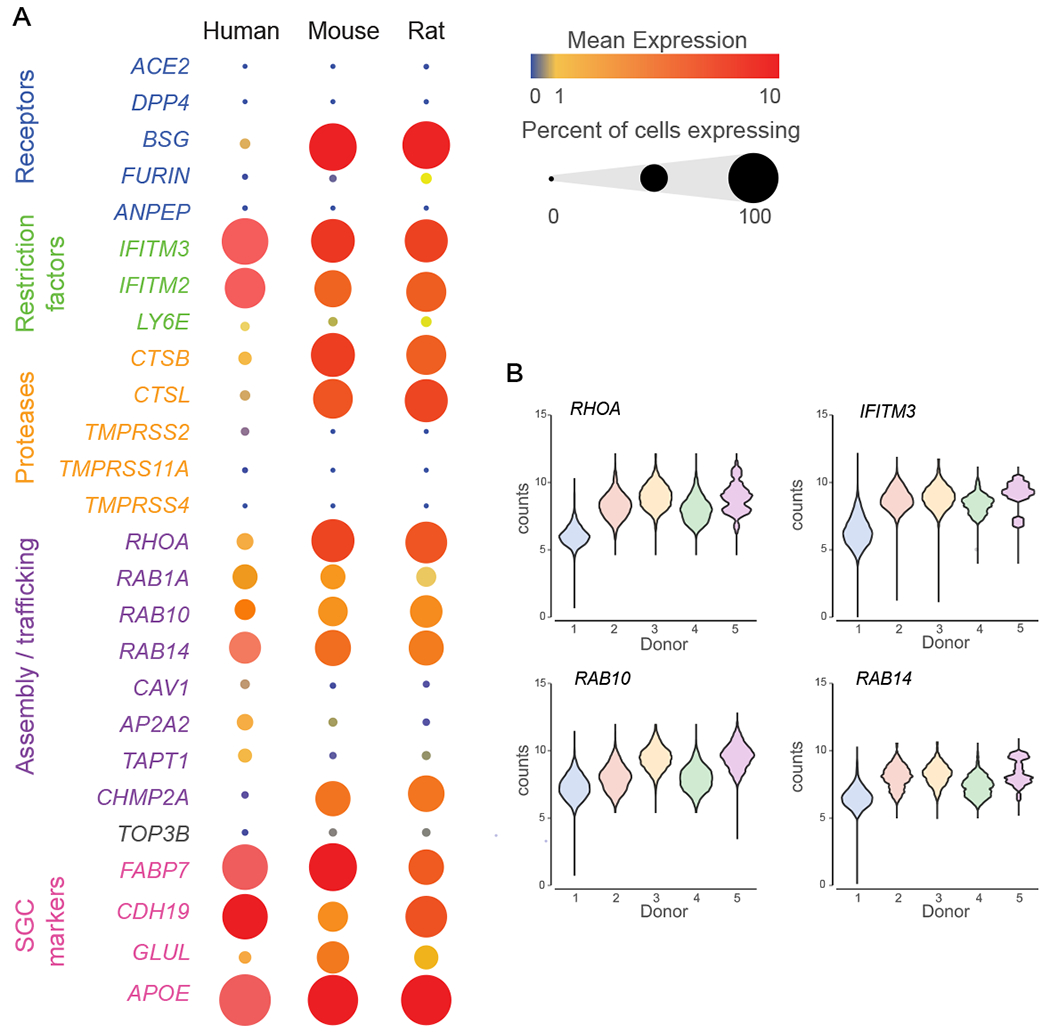
Peripheral sensory neurons located in dorsal root ganglia relay sensory information from the peripheral tissue to the brain. Satellite glial cells (SGCs) are unique glial cells that form an envelope completely surrounding each sensory neuron soma. This organization allows for close bidirectional communication between the neuron and its surrounding glial coat. Morphological and molecular changes in SGC have been observed in multiple pathological conditions such as inflammation, chemotherapy-induced neuropathy, viral infection, and nerve injuries. There is evidence that changes in SGC contribute to chronic pain by augmenting the neuronal activity in various rodent pain models. Satellite glial cells also play a critical role in axon regeneration. Whether findings made in rodent model systems are relevant to human physiology have not been investigated. Here, we present a detailed characterization of the transcriptional profile of SGC in mice, rats, and humans at the single cell level. Our findings suggest that key features of SGC in rodent models are conserved in humans. Our study provides the potential to leverage rodent SGC properties and identify potential targets in humans for the treatment of nerve injuries and alleviation of painful conditions.


Conflict of interest statement

CONFLICTS OF INTEREST

The authors declare no conflict of interest

Figures

Figure 1:
Figure 1:. Profiling DRG cells from mouse, rat and human
(A) t-SNE plot of human (18,648 cells), mouse (6,251 cells) and rat (11,432 cells) DRG cells colored by cell populations with fraction of distribution (B) t-SNE plots separated by batch/donors of human (donor1 6,444 cells, donor2 3,498 cells, donor3 3,957 cells, donor4 3,871 cells and donor5 878 cells), mouse (batch1 1,929 cells batch2 4,322 cells) and rat (batch1 6,074 cells batch2 5,358 cells) (C) t-SNE overlay for expression of the SGC marker gene Fabp7 in human, mouse and rat
Figure 2:
Figure 2:. FABP7 is an SGC marker in mouse and human
(A and B) Representative images of immunofluorescence staining of human (a) and mouse (b) DRG sections labelled for TUJ1 (magenta) and FABP7 (green) Scale bar: 200μm (left panel) 50μm (right panel). n=4 biological independent replicates for both a and b. (C) Representative TEM images of DRG sections from human and mouse showing neuronal cell bodies and its enveloping SGC (SGC cytoplasm is pseudocolored in green, SCG nuclei are pseudocolored in blue). (D) Quantification of the number of SGC surrounding a single neuron. n=4 biologically independent animals (mouse), n=2 individual donors (human).
Figure 3:
Figure 3:. SGC marker genes in mouse, rat and human
(A) t-SNE overlay of pooled SGC for expression of SGC marker genes FABP7, CADH19, GLUL and KCNJ10 in human (7,880 cells) (B) t-SNE overlay for expression of SGC marker genes Fabp7, Cadh19, Glul and Kcnj10 in mouse (3,460 cells) (C) t-SNE overlay for expression of SGC marker genes Fabp7, Cadh19, Glul and Kcnj10 in rat (8,428 cells) (D) Bubble plot showing the normalized count expression of the indicated SGC marker genes in each species. Dot size represents the percentage of cells that express the corresponding genes and the color represents the mean expression level.
Figure 4:
Figure 4:. Immunostaining of SGC in human and mouse DRG sections
(A-D) Representative images of immunofluorescence staining of human and mouse DRG sections labelled with TUJ1 (magenta), DAPI (Blue) and FASN (green) (A), GFAP (B), GLUL (C), and KCNJ3 (D). Scale bar: 100μm. n=4 biological independent replicates (E) Quantification of SGC markers in human and mouse DRG sections. The % of neurons surrounded by at least one SGC expressing the indicated markers out of total number of neurons in each section was quantified. FASN; 80.280±8.325 in human and 92.235±4.802 in mouse, GFAP; 7.8±5.13 in human, 11.191±3.884 in mouse, GLUL; 59.833±13.314 in human and 84.518±8.021 in mouse, KCNJ3; 51.306±12.558 in human and 3.615±2.668 in mouse. n=4 biological independent replicates. Unpaired t-test. Data are presented as mean values ±SD.
Figure 5:
Figure 5:. Enrichment of genes and pathways in human, mouse and rat SGC
(A) Venn diagram for enriched genes in SGC compared to other cells in the DRG from mouse (1,622 genes), rat (993 genes) and human (2,070 genes). (B) Pathway analysis (KEGG/GO) of enriched genes express in human SGC. (C) Pathway analysis (KEGG/GO) of enriched genes express in mouse SGC. (D) Pathway analysis (KEGG/GO) of enriched genes express in rat SGC.
Figure 6:
Figure 6:. Enrichment of ion channels and receptors in human, mouse and rat SGC
(A) Venn diagram for enriched ion channel and receptors genes in SGC from mouse (40 genes), rat (18 genes) and human (57 genes). (B) Enriched ion channels and receptors in SGC compared to other cell types in the DRG (fold change threshold >1.5). (C) Pathway analysis (KEGG 2019) of enriched ion channels and receptors expressed in mouse, rat and human SGC.
Figure 7:
Figure 7:. Enrichment of SCARF genes in human, mouse and rat SGC
(A) Bubble plot showing the normalized counts expression of SCARF genes in each SGC species. Dot size represent the percentage of cells expressing the corresponding gene and the color represents the mean expression level. (B) Violin plots of top normalized counts expression of SCARF genes in human SGC across individual donors.

References

    1. Avraham O, Deng PY, Jones S, Kuruvilla R, Semenkovich CF, Klyachko AK, Cavalli V. Satellite glial cells promote regenerative growth in sensory neurons. Nature Communications 2020;volume 11, Article number: 4891 (2020) - PMC - PubMed
    1. Avraham O, Feng R, Ewan EE, Rustenhoven J, Zhao G, Cavalli V. Profiling sensory neuron microenvironment after peripheral and central axon injury reveals key pathways for neural repair. Elife 2021;10. - PMC - PubMed
    1. Barres BA, Smith SJ. Neurobiology. Cholesterol--making or breaking the synapse. Science 2001;294(5545):1296–1297. - PubMed
    1. Belghali M, Chastan N, Cignetti F, Davenne D, Decker LM. Loss of gait control assessed by cognitive-motor dual-tasks: pros and cons in detecting people at risk of developing Alzheimer’s and Parkinson’s diseases. Geroscience 2017;39(3):305–329. - PMC - PubMed
    1. Bogdanov P, Hernandez C, Corraliza L, Carvalho AR, Simo R. Effect of fenofibrate on retinal neurodegeneration in an experimental model of type 2 diabetes. Acta Diabetol 2015;52(1):113–122. - PubMed

Publication types