. 2022 May 3:11:e71142.
doi: 10.7554/eLife.71142.

Proteolysis of fibrillin-2 microfibrils is essential for normal skeletal development

Affiliations

Proteolysis of fibrillin-2 microfibrils is essential for normal skeletal development

Timothy J Mead et al. Elife. .

Abstract

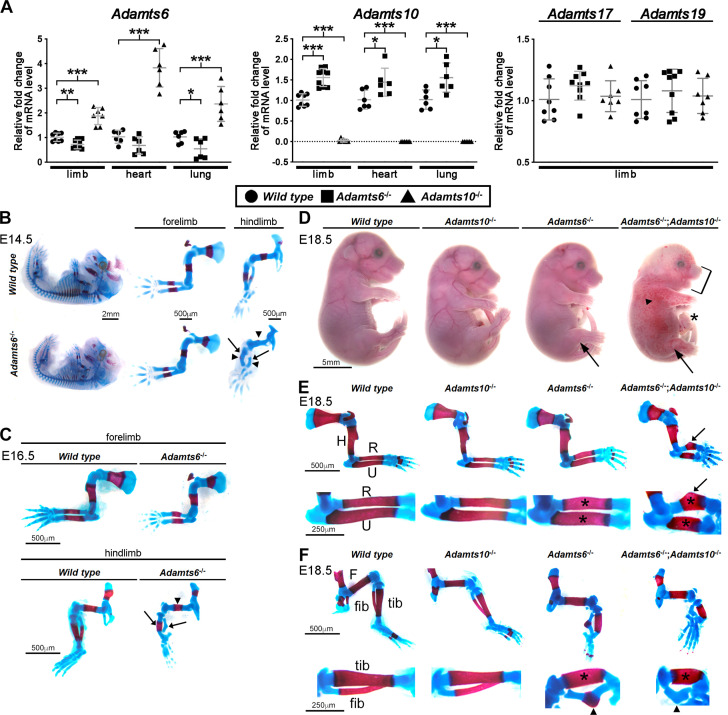
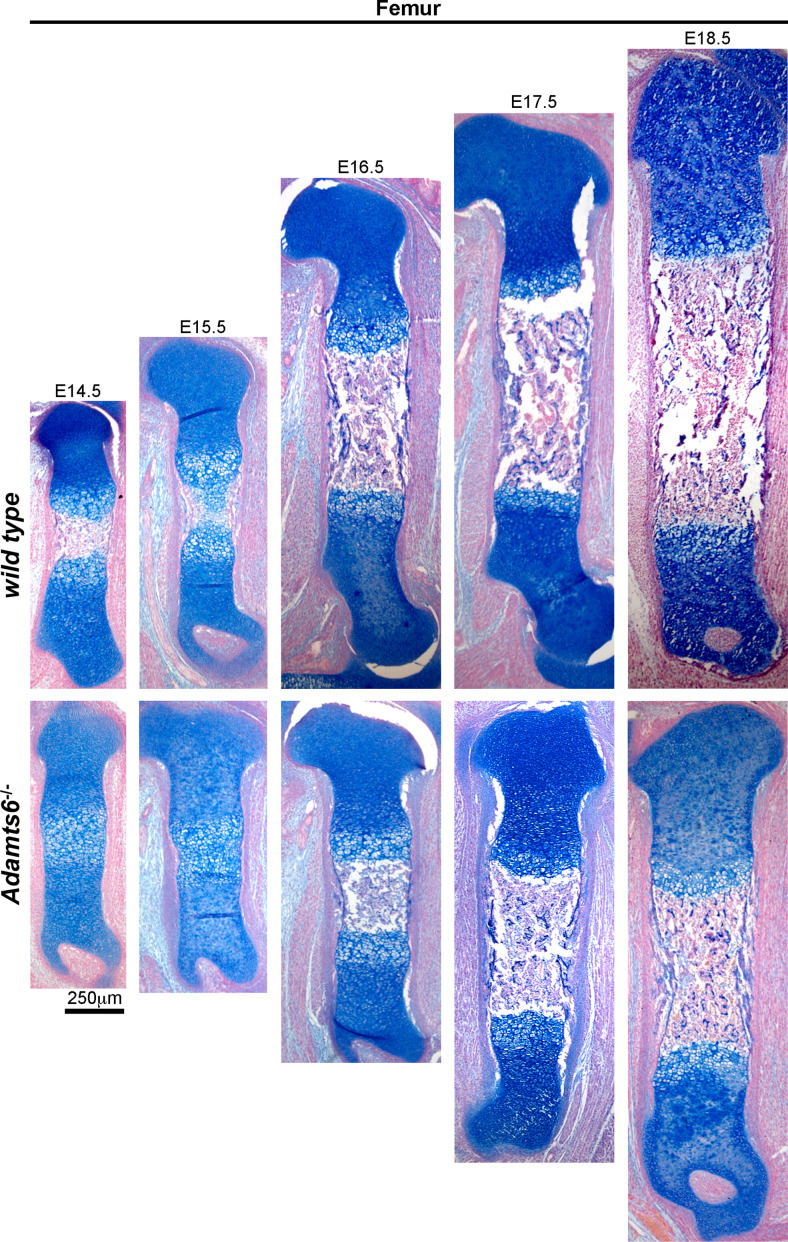
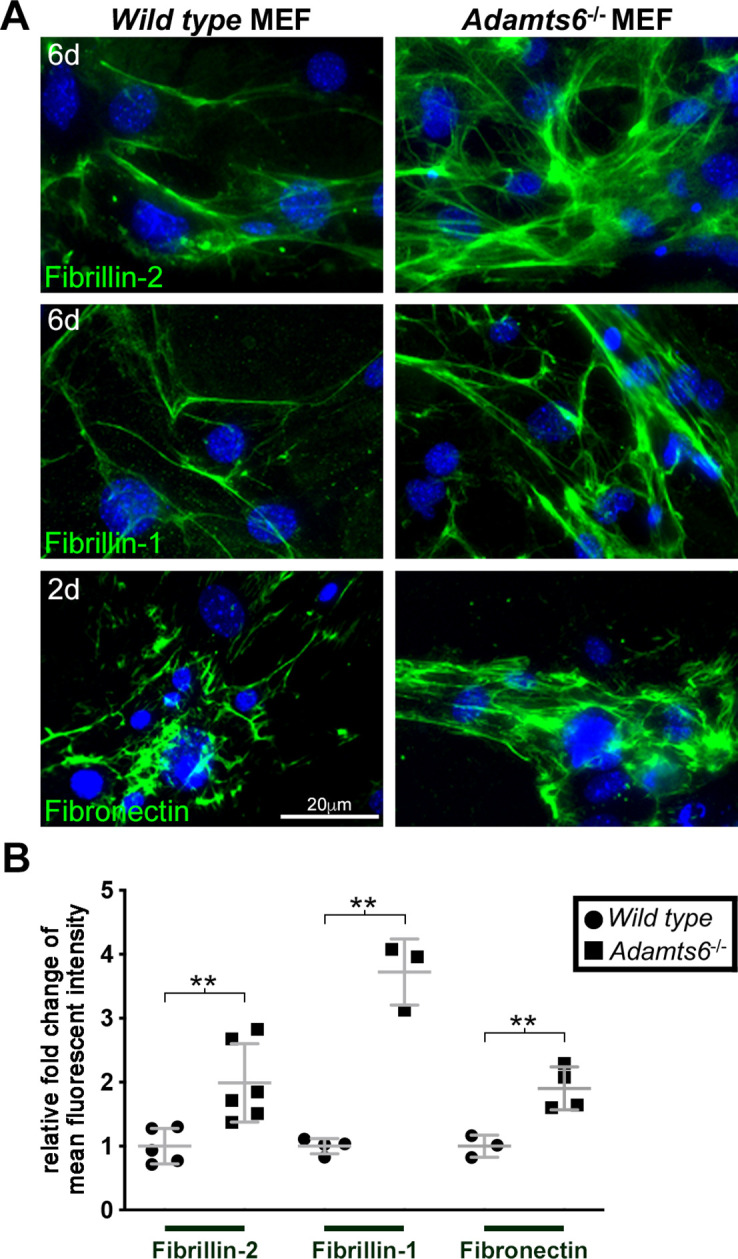
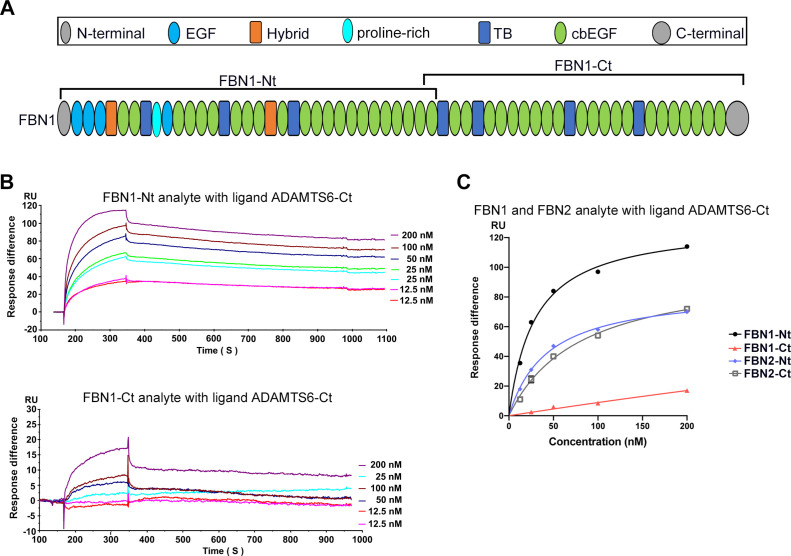
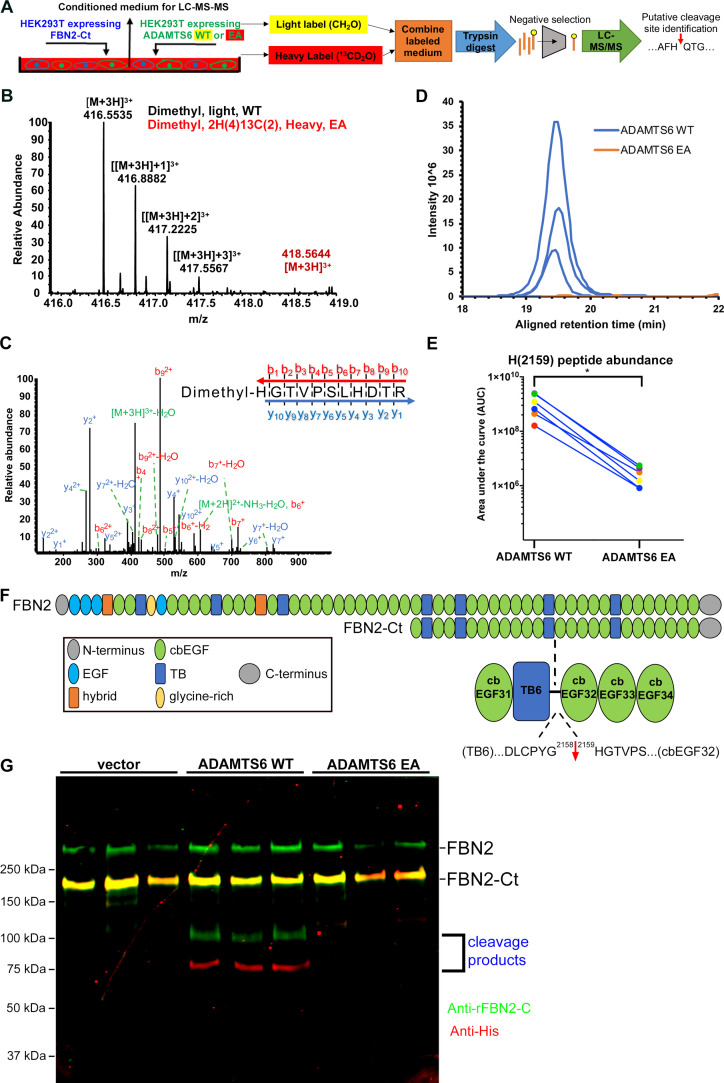
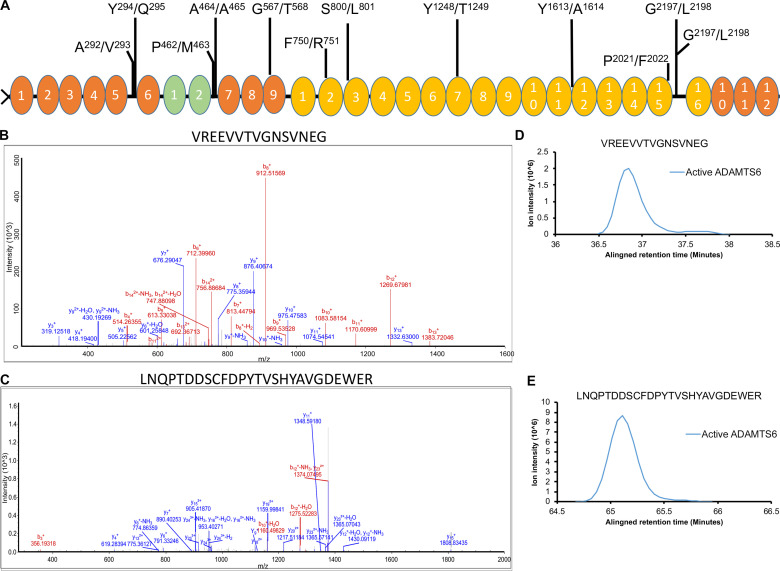
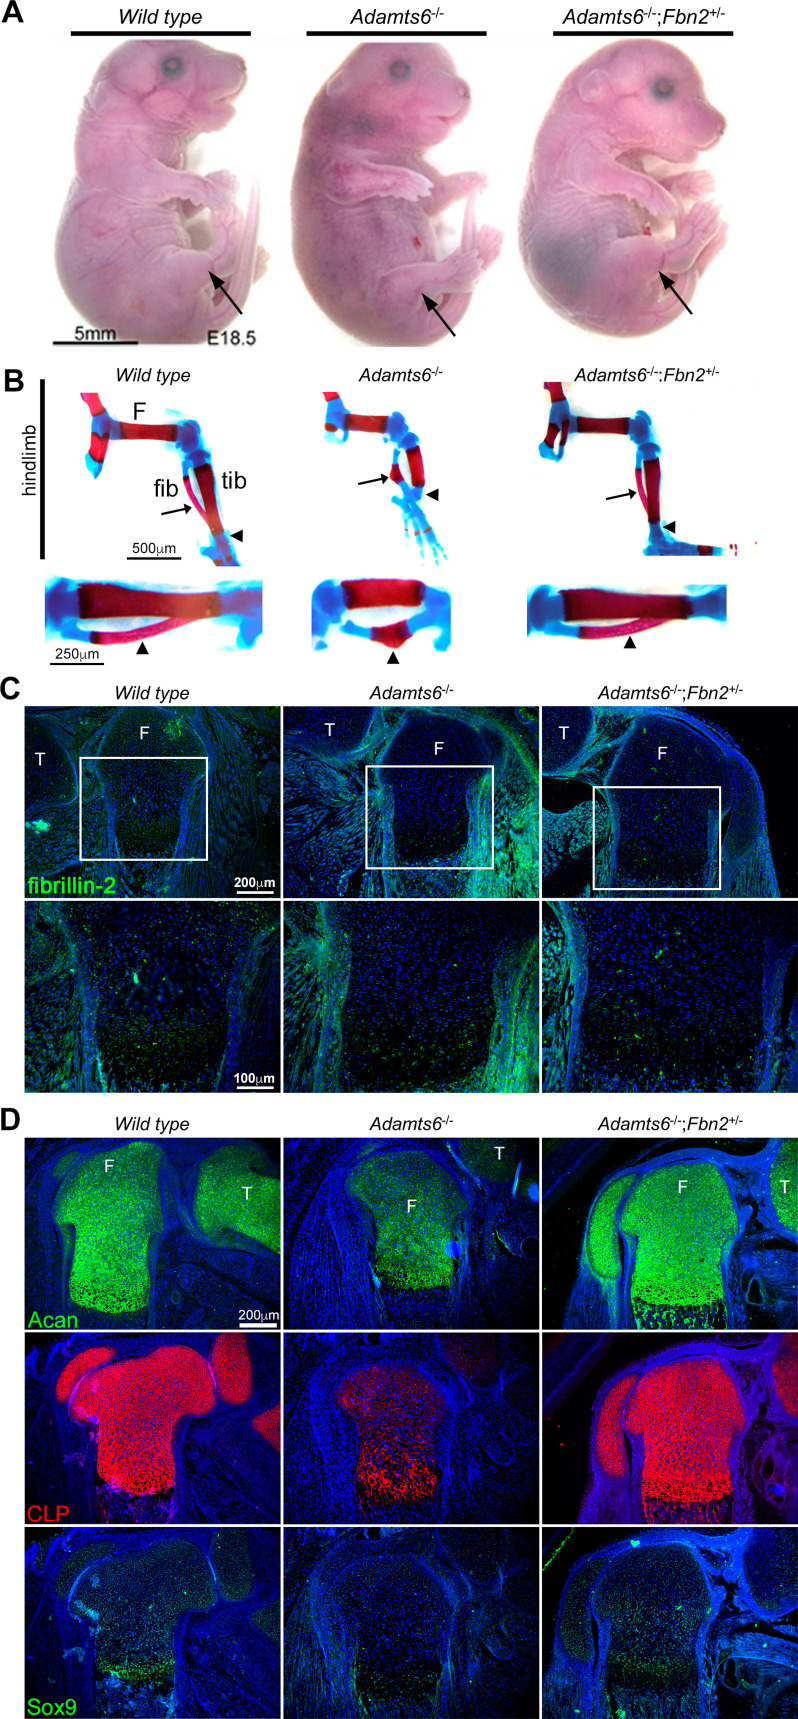
The embryonic extracellular matrix (ECM) undergoes transition to mature ECM as development progresses, yet few mechanisms ensuring ECM proteostasis during this period are known. Fibrillin microfibrils are macromolecular ECM complexes serving structural and regulatory roles. In mice, Fbn1 and Fbn2, encoding the major microfibrillar components, are strongly expressed during embryogenesis, but fibrillin-1 is the major component observed in adult tissue microfibrils. Here, analysis of Adamts6 and Adamts10 mutant mouse embryos, lacking these homologous secreted metalloproteases individually and in combination, along with in vitro analysis of microfibrils, measurement of ADAMTS6-fibrillin affinities and N-terminomics discovery of ADAMTS6-cleaved sites, identifies a proteostatic mechanism contributing to postnatal fibrillin-2 reduction and fibrillin-1 dominance. The lack of ADAMTS6, alone and in combination with ADAMTS10 led to excess fibrillin-2 in perichondrium, with impaired skeletal development defined by a drastic reduction of aggrecan and cartilage link protein, impaired BMP signaling in cartilage, and increased GDF5 sequestration in fibrillin-2-rich tissue. Although ADAMTS6 cleaves fibrillin-1 and fibrillin-2 as well as fibronectin, which provides the initial scaffold for microfibril assembly, primacy of the protease-substrate relationship between ADAMTS6 and fibrillin-2 was unequivocally established by reversal of the defects in Adamts6-/- embryos by genetic reduction of Fbn2, but not Fbn1.

Keywords: ADAMTS; Protease; developmental biology; extracellular matrix; fibrillin; mouse; proteolysis; skeletal development.


Conflict of interest statement

TM, DM, LW, SC, CG, EC, JM, DR, CL, CB, SA No competing interests declared

Figures

Figure 1.
Figure 1.. ADAMTS6 and ADAMTS10 are subject to transcriptional adaptation and cooperate in skeletal development.
(A) qRT-PCR analysis of Adamts6 and Adamts10 mRNA levels in wild type, Adamts6-/- and Adamts10-/- limb, heart and lung show that Adamts6 mRNA is elevated in Adamts10-/- limb, heart and lung and Adamts10 mRNA is elevated in Adamts6-/- tissues. n ≥ 6. Error bars represent ± SEM. *p ≤ 0.05; **p ≤ 0.01; ***p ≤ 0.001, Student t-test. There is no change in Adamts17 or Adamts19 mRNA levels in the Adamts6 or Adamts10-deficent limbs. (B, C) E14.5 (B) and E16.5 (C) alcian blue- and alizarin red-stained skeletons show severely short and under-ossified Adamts6-/- hindlimb long bones (arrowheads) with severely distorted tibia and fibula (arrow). Adamts6-/- forelimbs are not as severely affected as hindlimbs. (D) E18.5 Adamts6-/-;Adamts10-/- embryos have more severe hindlimb malformations (arrows) and shorter forelimbs and snout than Adamts6-/- and Adamts10-/- embryos as well as mandibular hypoplasia (bracket), an omphalocele (asterisk) and widespread cutaneous hemorrhage (arrowhead). (E, F) Alcian blue- and alizarin red-stained Adamts6-/-;Adamts10-/- forelimbs (E) and hindlimbs (F) show unremodeled, thicker and shorter long bones (asterisks show thicker diaphysis; H, humerus; F, femur; U, ulna; R, radius; Tib, tibia; Fib, fibula) with angulated radius (arrow) and tibia (arrowhead). Note the unossified fibula in the E18.5 Adamts6-/-;Adamts10-/- hindlimb.
Figure 1—figure supplement 1.
Figure 1—figure supplement 1.. ADAMTS6 and ADAMTS10 do not cleave each other.
(A) ADAMTS10 was co-transfected with ADAMTS6 or the catalytically inactive mutant ADAMTS6 EA. (B) Furin site-optimized ADAMTS10 (ADAMTS10-RRKR) was co-transfected with ADAMTS6 EA. No cleavage products of either ADAMTS6 or ADAMTS10 were seen.
Figure 1—figure supplement 2.
Figure 1—figure supplement 2.. Expected Mendelian ratios are observed in mouse crosses.
Mendelian ratios obtained from Adamts6+/- intercrosses (A) and Adamts6+/-;Adamts10+/- intercrosses at E18.5 (B) are shown. Observed and expected (in parentheses) genotype percentages are shown in the pie-charts. The actual number of mice generated is illustrated below the pie-charts.
Figure 1—figure supplement 3.
Figure 1—figure supplement 3.. Reduced crown-rump length and shorter limb skeletal elements in Adamts6-/- embyros.
At E14.5 (A) and E16.5 (B), Adamts6-deficient embryos have reduced crown-rump length and shorter long bones as compared to wild type embryos. Crown-rump length, n = 4; bone length, n ≥ 6. *p ≤ 0.05; **p ≤ 0.01; ***p ≤ 0.001.
Figure 1—figure supplement 4.
Figure 1—figure supplement 4.. Reduced crown-rump length and shorter limb skeletal elements in combined Adamts6 and Adamts10 alleles at E18.5.
(A) Adamts6- and Adamts10-deficient embryos and embryos with various combinations of alleles have reduced crown-rump length as compared to wild type embryos. (B) Embryos with various combinations of the Adamts6-mutant allele have shorter long bones than wild type, as shown. Adamts10-/- long bones were not significantly shorter than those of wild type littermates. Crown-rump length, n ≥ 6; bone length, n ≥ 8. *p ≤ 0.05; **p ≤ 0.01; ***p ≤ 0.001.
Figure 1—figure supplement 5.
Figure 1—figure supplement 5.. Greater diaphyseal width in Adamts6-/- long bones.
E18.5 Adamts6-deficient embryos have wider long bones than wild type embryos. n ≥ 6. *p ≤ 0.05; **p ≤ 0.01; ***p ≤ 0.001.
Figure 1—figure supplement 6.
Figure 1—figure supplement 6.. Delayed ossification and shorter femora in Adamts6-/- embyros.
Alcian blue-stained sections show the primary ossification center in E14.5 wild type femur (lack of blue staining in the diaphysis). The primary center did not form until E16.5 in the Adamts6-/- femur. n ≥ 4.
Figure 1—figure supplement 7.
Figure 1—figure supplement 7.. Angulation of the Adamts6-/- distal tibia.
Alcian blue-stained sections revealed marked distal tibial angulation in Adamts6-/- hindlimbs as early as E14.5, which persisted and contributed to a club-foot like appearance of the hindlimbs. n ≥ 4.
Figure 1—figure supplement 8.
Figure 1—figure supplement 8.. Severely hypoplastic fibula in Adamts6-/- embryos.
Alcian blue-stained sections revealed a delay in chondrocyte hypertrophy until E16.5 in Adamts6-/- fibula whereas it occurred at E14.5 in wild type fibula. Similarily, ossification was delayed until E18.5 in Adamts6-/- fibulae as opposed to E16.5 in wild type. n ≥ 4.
Figure 1—figure supplement 9.
Figure 1—figure supplement 9.. Decreased mineralization in Adamts6-deficent hindlimb long bones.
(A,B) E14.5 von Kossa-stained sections (A) quantified in (B) revealed reduced mineral deposition (black) in Adamts6-/- hindlimb bones. Significant staining in the periosteum as well as in the center of the diaphysis was seen in wild type limb sections. Minimal staining was seen in Adamts6-/- femur and tibial periosteum while mineralization was lacking entirely in the fibula. n ≥ 3. *p ≤ 0.05; **p ≤ 0.01; ***p ≤ 0.001. (C,D) Mineralization occurs in E18.5 Adamts6-/- hindlimb bones, and although the primary ossific center is smaller, the perichondrial collar and hypertrophic zones show comparable mineralization.
Figure 1—figure supplement 10.
Figure 1—figure supplement 10.. Adamts6-mutant embryos have a severely underdeveloped axial skeleton.
Alcian blue- and alizarin red -stained E18.5 axial skeleton and craniofacial preparations show that Adamts6-/- and Adamts6-/-;Adamts10-/- embryos have shortened, stout ribs (asterisks), shortened and disorganized manubrium and sternum (small arrows) (note the under-ossified/unossified xiphoid process (arrowheads)), smaller vertebral bodies (large arrows), and a smaller cranium with delayed mineralization of parietal bones (dashed white lines).
Figure 2.
Figure 2.. Adamts6 and Adamts10 mRNAs show overlapping distribution in developing mouse limbs.
(A) RNAscope in situ hybridization shows strong expression of Adamts6 and Adamts10 in E13.5 perichondrium (arrow) and weaker expression in growth plate chondrocytes (arrowheads). (B) Strong Adamts6 and Adamts10 expression was seen in E14.5 tibia perichondrium, whereas only the peripheral chondrocytes expressed both genes. (C,D) At E14.5 Adamts6 and Adamts10 expression was seen, in addition to perichondrium, in knee joint mesenchyme (C), arrow; F, femur, T, tibia, while Adamts6 was strongly expressed in the patellar tendon (C), arrowhead, PT. Both genes were expressed in the perichondrium, muscles and tendons around the hip, elbow tendons (arrow; H, humerus, R, radius) and muscle (arrowhead), and in the shoulder rotator cuff tendons (arrowhead, RC). (D) Adamts6 and Adamts10 were expressed in the vertebral endplates (arrows), rib intercostal muscles (arrows), Achilles tendon in the ankle (arrow; C, calcaneus), in perichondrium and tendons in the autopod.
Figure 3.
Figure 3.. Adamts6-/- and Adamts6-/-;Adamts10-/- hindlimbs have disorganized chondrocytes and reduced cartilage proteoglycan.
(A) RGB trichrome-stained E18.5 knees show disorganized chondrocytes and reduced alcian blue staining in Adamts6-/- and Adamts6-/-;Adamts10-/- bones. (F), femur; T, tibia; f, fibula; RZ, resting zone; CZ, columnar zone; HZ, hypertrophic zone. (B) Severely reduced aggrecan (Acan), cartilage link protein (CLP) and Sox9 in Adamts6-/- and Adamts6-/-;Adamts10-/- cartilage and wider collagen X (Col X)-stained region indicating an expanded HZ.
Figure 3—figure supplement 1.
Figure 3—figure supplement 1.. Increased collagen staining in Adamts6-deficent hindlimbs.
RGB trichrome-stained E18.5 femur showed diffuse, disorganized and increased collagen staining (red) in the perichondrium and adjacent mesenchyme in Adamts6-/- and Adamts6-/-;Adamts10-/- embryos. These images are taken from panels in Figure 3A.
Figure 3—figure supplement 2.
Figure 3—figure supplement 2.. Adamts6-deficent femora have reduced cartilage proteoglycan staining.
(A) RGB trichrome-stained E14.5 Adamts6-/- femur sections show smaller resting zone (RZ), columnar zone (CZ) and hypertrophic zone (HZ) chondrocytes with reduced alcian blue staining of the ECM. (B, C) Reduced staining intensity of aggrecan (Acan), cartilage link protein (CLP) and Sox9 was seen in Adamts6-/- proximal femoral distal resting chondrocytes. n ≥ 6. *p ≤ 0.05; **p ≤ 0.01; ***p ≤ 0.001.
Figure 3—figure supplement 3.
Figure 3—figure supplement 3.. Late embryonic Adamts6-mutant femora have reduced cartilage proteoglycan.
Reduced staining intensity of aggrecan (Acan), cartilage link protein (CLP) and Sox9 were evident in Adamts6-/- proximal femoral resting and columnar zone chondrocytes. No change in Col X staining intensity was noted. n ≥ 4. *p ≤ 0.05; **p ≤ 0.01; ***p ≤ 0.001.
Figure 3—figure supplement 4.
Figure 3—figure supplement 4.. No change in proliferation or cell death in Adamts6-/- cartilage.
(A–B) PCNA +nuclei (red) (A) in E18.5 distal femur were quantified in the resting zone (RZ; yellow brackets) and columnar zone (CZ; orange brackets) and quantified in (B). n = 4. (C–D) TUNEL +cells (green) (C) in E18.5 proximal femur were quantified (D) at the chondro-osseous junction (terminal hypertrophic chondrocytes).
Figure 4.
Figure 4.. Increased MAGP1 and fibrillin-2 staining, but not fibrillin-1 staining in Adamts6-/- and Adamts6-/-;Adamts10-/- perichondrium.
(A–B) Increased staining intensity (green) of MAGP1 (A) and fibrillin-2 (B) in E18.5 Adamts6- and Adamts10-deficient knee joints. (C) No consistent change in fibrillin-1 staining (green) was seen between the various genotypes. n = 3. Sections are counterstained with DAPI (blue). The inset boxes are enlarged in corresponding lower sections. White arrows indicate the perichondrium. F, femur; T, tibia; f, fibula.
Figure 4—figure supplement 1.
Figure 4—figure supplement 1.. Differential microfibril staining in Adamts6-deficient hindlimbs.
(A) Increased MAGP1 and fibrillin-2 staining intensity in Adamts6- and Adamts10-mutant hindlimbs. There was no change, however, in fibrillin-1 staining intensity. n ≥ 4. *p ≤ 0.05; **p ≤ 0.01; ***p ≤ 0.001. (B) Comparable Fbn2 and Fbn1 hindlimb RNA levels in Adamts6 and Adamts10 mutants as demonstrated by qRT-PCR analysis of E18.5 hindlimbs. n = 3.
Figure 5.
Figure 5.. Loss of fibrillin-2, fibrillin-1 and fibronectin microfibrils in the presence of active ADAMTS6.
(A) Fbn1-/- mouse embryo fibroblasts (MEFs), which can produce fibrillin-2 but not fibrillin-1, were cocultured with human embryonic kidney (HEK) cells overexpressing ADAMTS6 or ADAMTS6 EA (inactive ADAMTS6). Fibrillin-2 (green) co-localized with histidine (His)-tagged ADAMTS6 EA (red), but no microfibrils were seen in the presence of ADAMTS6 (red). Similarly, Fbn2-/- mouse skin fibroblasts (MSFs), which can produce fibrillin-1 but not fibrillin-2, were co-cultured with HEK cells overexpressing ADAMTS6 or ADAMTS6 EA. Fibrillin-1 microfibrils (green) co-localized with His-tagged ADAMTS6 EA (red), but were absent in the presence of active ADAMTS6 (red) after 4 days culture. Fibronectin also co-localized with ADAMTS6 EA, and fibronectin fibrils were absent in the presence of ADAMTS6. Nuclei are stained with DAPI (blue). (B) Quantification of mean intensity of fluorescence. n ≥ 6. *p ≤ 0.05; **p ≤ 0.01; ***p ≤ 0.001.
Figure 5—figure supplement 1.
Figure 5—figure supplement 1.. Increased fibrillin-1, fibrillin-2 and fibronectin microfibril staining in fibroblasts lacking ADAMTS6.
(A) Adamts6-/- mouse embryo fibroblasts (MEFs) have increased fibrillin-2 and fibrillin-1 staining after 6 days in culture as compared to wild type MEFs. Fibronectin staining was similarly increased in 2 day cultures. Nuclei are stained with DAPI (blue). (B) Quantification of mean intensity of fluorescence. n ≥ 3. **p ≤ 0.01.
Figure 6.
Figure 6.. ADAMTS6 binds directly to fibrillin-2.
(A) Cartoons of the domain structures of ADAMTS6 and fibrillin-2 and the recombinant constructs used in the present work (indicated by black lines). (B–C) Biacore analysis shows dose-dependent binding curves for the ADAMTS6-C-terminal constructs ADAMTS6-Ct, ADAMTS6-4TSR and ADAMTS6-S4TSR against immobilized FBN2-Ct (B), and comparative binding characteristics of the constructs (C), other than ADAMTS6-TCS, which did not bind. (D) Reciprocal Biacore analysis using immobilized ADAMTS6-Ct shows that fibrillin-2-Nt and fibrillin-2-Ct used as the analyte each bound strongly to ADAMTS6-Ct.
Figure 6—figure supplement 1.
Figure 6—figure supplement 1.. ADAMTS6 binds directly to fibrillin-1.
(A) Domain structure of fibrillin-1 recombinant constructs. (B) Biacore analysis shows that fibrillin-1-Nt and fibrillin-1-Ct recombinant fragments each bind strongly to ADAMTS6-Ct. (C). Comparison of fibrillin-1 and fibrillin-2 binding shows strongest binding of ADAMTS6-Ct to FBN1-Nt among the tested fibrillin constructs.
Figure 7.
Figure 7.. Fibrillin-2 cleavage by ADAMTS6 and identification of the cleavage site using N-terminomics.
(A) Schematic of the experimental approach. Proteins from conditioned medium of co-cultures of HEK293F cells stably expressing FBN2-Ct and HEK293F cells expressing either ADAMTS6 WT or ADAMTS6 EA (inactive control) were labeled by reductive dimethylation using stable formaldehyde isotopes and analyzed by LC-MS/MS in the TAILS workflow described in detail in the Methods section. (B) MS1 chromatogram of the parent ions derived from fibrillin-2 fragments potentially resulting from cleavage by ADAMTS6 (black) and the same peptides sought in ADAMTS6 EA-containing medium (red) that were used for measuring abundance. (C) Annotated MS2 spectrum of the light (ADAMTS6-generated) dimethyl peptide, showing b-(N-terminus preserved) and y-type (C-terminus preserved) ions generated by amide bond cleavage during collisional-induced dissociation that were used to derive the fibrillin-2 peptide sequence indicated at the top right. (D) Retention time-aligned extracted ion chromatograms (EICs) comparing abundance of the light dimethyl-labeled HGTVPSLHDTR peptide (blue) in ADAMTS6 medium and isotopically heavy dimethyl-labeled peptide (orange) in ADAMTS6 EA medium from three replicate TAILS experiments. (E) The area under the EIC curves was quantified and comparison of ion abundance is shown in a dumb-bell plot (from 3 TAILS and 3 pre-TAILS samples). Significance was determined using a two-tailed, paired Student t-test, * indicates p-value < .05. (F) Domain structure of fibrillin-2 and the C-terminal construct FBN2-Ct showing the location of the cleaved peptide bond Gly2158-His2159 in the linker between TB6 and cbEGF32. (G) Orthogonal validation of fibrillin-2 cleavage by ADAMTS6 using western blot analysis of the conditioned medium from A, shows distinct molecular species (100 kDa and 75 kDa) reactive with anti-fibrillin-2-Ct antibody (green, N-terminal fragment of fibrillin-2-Ct) and C-terminal anti-His6 antibody (red, C-terminal fragment of fibrillin-2-Ct), respectively, obtained in the presence of ADAMTS6 WT, but not ADAMTS6 EA, indicative of fibrillin-2-Ct cleavage. The green band of ~350 kDa is endogenous fibrillin-2 produced by HEK293F cells. The yellow band at ~175 kDa indicates overlapping anti-His6 and anti-fibrillin-2-Ct antibody staining of the fibrillin-2-Ct construct. Cells transfected with empty vector were also used to obtain control medium.
Figure 7—figure supplement 1.
Figure 7—figure supplement 1.. ADAMTS6 cleaves fibrillin-1.
(A) Schematic of the experimental approach. Proteins from conditioned medium of co-cultured HEK293F cells stably expressing fibrillin-1 and HEK293F cells expressing either ADAMTS6 WT or ADAMTS6 EA (inactive) were labeled by reductive dimethylation using stable formaldehyde isotopes and analyzed by LC-MS/MS in the TAILS workflow described in detail in the Materials and methods section. (B) Domain structure of fibrillin-1 showing the location of the cleaved peptide bond Arg516-Ala517 between EGF4 and cbEGF3. (C) Annotated MS2 spectrum of the fibrillin-1 peptide shows the b- (N-terminal preserved) and y-type (C-terminal preserved) ions generated via amide bond cleavage during collision-induced dissociation revealing the peptide backbone sequence. (D) The retention time-aligned extracted ion chromatograms show the light dimethyl-labeled AGYQSLTR peptide (blue) from the ADAMTS6 medium compared to the isotopically heavy dimethyl labeled peptide (orange) from the ADAMTS6 EA medium. (E) The area under the extracted chromatogram curve was quantified in three replicates TAILS experiments and plotted. Significance was determined using a two-tailed, paired Student t-test, *p ≤ 0.05.
Figure 7—figure supplement 2.
Figure 7—figure supplement 2.. ADAMTS6 cleaves fibronectin at multiple sites.
(A) Schematic of the domain structure of fibronectin and locations of the identified cleavage sites. (B–C) Annotated MS2 spectra of the VREEVVTVGNSVNEG (B) and the LNQPTDDSCFDPYTVSHYAVGDEWER (C) peptides are shown as examples. (D–E) Extracted ion chromatograms showing the peptide intensity and retention time in the ADAMTS6 medium but no matching chromatographic trace in the ADAMTS6 EA medium for peptides VREEVVTVGNSVNEG (D) and LNQPTDDSCFDPYTVSHYAVGDEWER (E).
Figure 8.
Figure 8.. Genetic reversal of limb anomalies in Adamts6 mutant mice by Fbn2 haploinsufficiency.
(A–B) Deletion of one Fbn2 allele reverses limb dysmorphology in E18.5 Adamts6-/- embryos, specifically, externally evident limb segment dimensions and reversal of rotational anomaly (arrow) (A), normal ossific centers and overall hindlimb skeletal structure, reversal of internal rotation and bending of the tibia (arrowheads) and restores normal tibial and fibular (arrows) length, shape and alignment (B). The lower panels in (B) illustrate the tibia and fibula (arrowhead) at higher magnification. (C) Fibrillin-2 staining is reduced to wild type levels in Adamts6-/-;Fbn2+/- distal femoral perichondrium. T, tibia, F, femur. (D) Restitution of aggrecan, cartilage link protein (CLP) and Sox9 staining in Adamts6-/-;Fbn2+/- distal femoral cartilage. T, tibia, F, femur.
Figure 8—figure supplement 1.
Figure 8—figure supplement 1.. Reversal of reduced body length and long bone shortening in Adamts6-deficient embryos by Fbn2 hemizygosity.
Reduced crown-rump length (A) and reduced radius, ulna, tibia and fibula length (B) in E18.5 Adamts6-/- embryos was ameliorated by Fbn2 heterozygosity. Crown-rump length, n ≥ 3; bone length, n ≥ 6. *p ≤ 0.05; **p ≤ 0.01; ***p ≤ 0.001.
Figure 8—figure supplement 2.
Figure 8—figure supplement 2.. Fbn2 haploinsufficiency reverses axial skeleton and craniofacial anomalies in Adamts6-/- mice.
The images specifically illustrate restoration of length, ossification and relative proportions of the ribs (astrisks), sternal segmental ossific centers (arrows) and xiphoid process ossification (arrowheads), vertebral body (arrows) and vertebral appendage ossification, as well as skull dimensions and parietal ossification (dashed white line). (B) Hematoxylin and eosin-stained coronal sections from E18.5 embryos show that Fbn2 haploinsufficiency reverses cleft secondary palate (asterisk) observed in the majority of Adamts6-/- mutants (the observed incidence of cleft palate is listed below the respective panels).
Figure 8—figure supplement 3.
Figure 8—figure supplement 3.. Normalized fibrillin-2, aggrecan, cartilage link protein and Sox9 staining intensity in Adamts6-/-;Fbn2+/- cartilage.
Reduction of fibrillin-2 staining intensity was noted in Adamts6-/-;Fbn2+/- hindlimbs compared to Adamts6-/- hindlimbs. Fbn2+/- hindlimbs also had reducedfibrillin-2 staining than wild type hindlimb. The staining intensity of aggrecan (Acan) cartilage link protein (CLP) and Sox9 were restored in Adamts6-/-;Fbn2+/- cartilage as compared to Adamts6-/- cartilage. n ≥ 4. *p ≤ 0.05; **p ≤ 0.01; ***p ≤ 0.001.
Figure 8—figure supplement 4.
Figure 8—figure supplement 4.. Fbn2 hemizygosity does not itself alter hindlimb long bone length or growth plate morphology and dimensions.
(A,B) Alcian blue- and alizarin red-stained E18.5 Fbn2+/- hindlimbs have normal patterning and unchanged long bone length (n ≥ 12). No change in crown-rump length was seen in E18.5 Fbn2+/- embryos (n ≥ 6). (C,D) RGB trichrome-stained E18.5 Fbn2+/- distal femur showed no change in chondrocyte appearance or growth plate zones when compared to control. F, femur; T, tibia; RZ, resting zone; CZ, columnar zone; HZ, hypertrophic zone (n ≥ 6). (E) Fibrillin-2 staining was reduced in Fbn2+/- knee joints as compared to control (n ≥ 4). *p ≤ 0.05; **p ≤ 0.01; ***p ≤ 0.001.
Figure 8—figure supplement 5.
Figure 8—figure supplement 5.. Genetic Fbn1 reduction does not affect Adamts6-/- limb and skeletal defects.
No restoration of long bone dysmorphology and shortening (A,B) or crown-rump length (B) of Adamts6-/- embryos after hemizygosity or homozygosity for a Fbn1 mutant allele, Fbn1mgR. Measurements were made in E18.5 embryos of the indicated genotypes. Crown-rump length, n ≥ 4; bone length, n ≥ 4. *p ≤ 0.05; **p ≤ 0.01; ***p ≤ 0.001.
Figure 9.
Figure 9.. Reduced BMP signaling but unaltered canonical TGFβ signaling in Adamts6-/- distal femur.
(A) Reduced pSMAD1/5/8 staining in Adamts6-/- femur, as compared to wild type control, is restored to wild type levels in Adamts6-/-;Fbn2+/- femur as quantified in (B). n ≥ 4; *p ≤ 0.05; **p ≤ 0.01. (C) Western blotting of E18.5 hindlimb extracts shows reduced pSMAD5 (green; 58 kDa). Anti-GAPDH (red, 37 kDa) was used as a loading control. (D) pSMAD5 levels from the western blot in (C) was quantified after normalization to GAPDH loading control. n = 3. *p ≤ 0.05. (E) No change in pSMAD2 staining in Adamts6-/- femur as compared to wild-type control. The results are quantified in (F). (G) Western blot analysis shows no change in anti-pSMAD2 (green; 52 kDa) in Adamts6-deficient E18.5 hindlimb lysates. Anti-GAPDH (red, 37 kDa) was used as a loading control. (H) Quantification of anti-pSMAD2 signal in (G) using GAPDH signal intensity as the control. n = 3.
Figure 10.
Figure 10.. GDF5 co-localizes with fibrillin-2 microfibrils with greater staining intensity in Adamts6-/- knee joints.
(A–B) E14.5, E16.5 and E18.5 Adamts6-/- knee joints (A) and perichondrium (B) show both increased fibrillin-2 (red) and GDF5 (green) staining in joint mesenchyme as compared to wild-type control. Note the overlapping staining of fibrillin-2 (red) and GDF5 (green) with increased immunodetection of both fibrillin-2 and GDF5 in the Adamts6-/- knee joint mesenchyme. F, femur; T, tibia.
Figure 10—figure supplement 1.
Figure 10—figure supplement 1.. Increased fibrillin-2 and GDF5 staining intensity in Adamts6-/- knee joint mesenchyme.
Quantification of fluorescent staining intensity in sections of the E14.5, E16.5, and E18.5 knee joint from wild type and Adamts6-/- embyros stained with fibrillin-2 and GDF5 antibodies. n ≥ 4. *p ≤ 0.05; **p ≤ 0.01; ***p ≤ 0.001.
Figure 11.
Figure 11.. Schematic illustrating the observed anomalies in the absence of ADAMTS6 and proposed roles and mechanisms of ADAMTS6 in skeletal development.
(A) Adamts6 expression (pink dots) is shown in the perichondrium, peripheral chondrocytes, and in mesenchyme surrounding the knee joint. BMP signaling (blue circles) is evident in growth plate cartilage while fibrillin-2 (purple rods) and BMP/GDF (orange dots) are co-localized in the mesenchyme surrounding the knee joint and long bones. Adamts6-deficient limbs have a reduction of BMP signaling in the growth plate, retention of fibrillin-2 microfibrils and sequestration of GDF5, and presumably, other known fibrillin-2 binding BMPs/GDFs. (B) The schematic shows that in wild type limbs, ADAMTS6 cleaves fibrillin-2, allowing release of growth factors and contributing to proper cartilage growth and development. In the absence of ADAMTS6, there is an over-abundance of fibrillin-2 microfibrils, sequestration of GDF5/BMPs and as a consequence, reduced Sox9, aggrecan (blue shading) and cartilage link protein, impairing cartilage differentiation and structural integrity. Mechanistically, we conclude from the data that ADAMTS6 acts principally via fibrillin-2 cleavage and release of sequestered BMP/GDF. RZ, resting zone; CZ, columnar zone; HZ, hypertrophic zone; N, N-terminus; C, C-terminus of fibrillin-2.

References

    1. Arteaga-Solis E, Gayraud B, Lee SY, Shum L, Sakai L, Ramirez F. Regulation of limb patterning by extracellular microfibrils. The Journal of Cell Biology. 2001;154:275–281. doi: 10.1083/jcb.200105046. - DOI - PMC - PubMed
    1. Bader HL, Ruhe AL, Wang LW, Wong AK, Walsh KF, Packer RA, Mitelman J, Robertson KR, O’Brien DP, Broman KW, Shelton GD, Apte SS, Neff MW. An ADAMTSL2 founder mutation causes Musladin-Lueke Syndrome, a heritable disorder of beagle dogs, featuring stiff skin and joint contractures. PLOS ONE. 2010;5:e12817. doi: 10.1371/journal.pone.0012817. - DOI - PMC - PubMed
    1. Bader HL, Wang LW, Ho JC, Tran T, Holden P, Fitzgerald J, Atit RP, Reinhardt DP, Apte SS. A disintegrin-like and metalloprotease domain containing thrombospondin type 1 motif-like 5 (ADAMTSL5) is A novel fibrillin-1-, fibrillin-2-, and heparin-binding member of the ADAMTS superfamily containing A netrin-like module. Matrix Biology. 2012;31:398–411. doi: 10.1016/j.matbio.2012.09.003. - DOI - PMC - PubMed
    1. Beene LC, Wang LW, Hubmacher D, Keene DR, Reinhardt DP, Annis DS, Mosher DF, Mecham RP, Traboulsi EI, Apte SS. Nonselective assembly of fibrillin 1 and fibrillin 2 in the rodent ocular zonule and in cultured cells: implications for Marfan syndrome. Investigative Ophthalmology & Visual Science. 2013;54:8337–8344. doi: 10.1167/iovs.13-13121. - DOI - PMC - PubMed
    1. Bekhouche M, Leduc C, Dupont L, Janssen L, Delolme F, Vadon-Le Goff S, Smargiasso N, Baiwir D, Mazzucchelli G, Zanella-Cleon I, Dubail J, De Pauw E, Nusgens B, Hulmes DJ, Moali C, Colige A. Determination of the substrate repertoire of ADAMTS2, 3, and 14 significantly broadens their functions and identifies extracellular matrix organization and TGF-beta signaling as primary targets. FASEB Journal: Official Publication of the Federation of American Societies for Experimental Biology. 2016;30:1741–1756. doi: 10.1096/fj.15-279869. - DOI - PubMed