The BAM7 gene in Zea mays encodes a protein with similar structural and catalytic properties to Arabidopsis BAM2
- PMID: 35503205
- PMCID: PMC9063847
- DOI: 10.1107/S2059798322002169
The BAM7 gene in Zea mays encodes a protein with similar structural and catalytic properties to Arabidopsis BAM2
Abstract
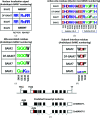
Starch accumulates in the plastids of green plant tissues during the day to provide carbon for metabolism at night. Starch hydrolysis is catalyzed by members of the β-amylase (BAM) family, which in Arabidopsis thaliana (At) includes nine structurally and functionally diverse members. One of these enzymes, AtBAM2, is a plastid-localized enzyme that is unique among characterized β-amylases since it is tetrameric and exhibits sigmoidal kinetics. Sequence alignments show that the BAM domains of AtBAM7, a catalytically inactive, nuclear-localized transcription factor with an N-terminal DNA-binding domain, and AtBAM2 are more closely related to each other than they are to any other AtBAM. Since the BAM2 gene is found in more ancient lineages, it was hypothesized that the BAM7 gene evolved from BAM2. However, analysis of the genomes of 48 flowering plants revealed 12 species that appear to possess a BAM7 gene but lack a BAM2 gene. Upon closer inspection, these BAM7 proteins have a greater percent identity to AtBAM2 than to AtBAM7, and they share all of the AtBAM2 functional residues that BAM7 proteins normally lack. It is hypothesized that these genes may encode BAM2-like proteins although they are currently annotated as BAM7-like genes. To test this hypothesis, a cDNA for the short form of corn BAM7 (ZmBAM7-S) was designed for expression in Escherichia coli. Small-angle X-ray scattering data indicate that ZmBAM7-S has a tetrameric solution structure that is more similar to that of AtBAM2 than to that of AtBAM1. In addition, partially purified ZmBAM7-S is catalytically active and exhibits sigmoidal kinetics. Together, these data suggest that some BAM7 genes may encode a functional BAM2. Exploring and understanding the β-amylase gene structure could have an impact on the current annotation of genes.
Keywords: Arabidopsis thaliana; BAM genes; Zea mays; gene evolution; gene structure; small-angle X-ray scattering; starch metabolism; β-amylases.
Figures


Similar articles
-
Maize β-amylase7 encodes 2 proteins using alternative transcriptional start sites: Nuclear BAM7 and plastidic BAM2.Plant Physiol. 2023 Aug 3;192(4):2871-2882. doi: 10.1093/plphys/kiad227. Plant Physiol. 2023. PMID: 37067898 Free PMC article.
-
Arabidopsis β-Amylase2 Is a K+-Requiring, Catalytic Tetramer with Sigmoidal Kinetics.Plant Physiol. 2017 Dec;175(4):1525-1535. doi: 10.1104/pp.17.01506. Epub 2017 Oct 24. Plant Physiol. 2017. PMID: 29066669 Free PMC article.
-
Solution structure and assembly of β-amylase 2 from Arabidopsis thaliana.Acta Crystallogr D Struct Biol. 2020 Apr 1;76(Pt 4):357-365. doi: 10.1107/S2059798320002016. Epub 2020 Mar 25. Acta Crystallogr D Struct Biol. 2020. PMID: 32254060 Free PMC article.
-
Review: The Arabidopsis β-amylase (BAM) gene family: Diversity of form and function.Plant Sci. 2018 Nov;276:163-170. doi: 10.1016/j.plantsci.2018.08.016. Epub 2018 Aug 28. Plant Sci. 2018. PMID: 30348315 Review.
-
The carbohydrate-binding module family 20--diversity, structure, and function.FEBS J. 2009 Sep;276(18):5006-29. doi: 10.1111/j.1742-4658.2009.07221.x. Epub 2009 Aug 13. FEBS J. 2009. PMID: 19682075 Review.
Cited by
-
Characterization and functional analysis of the BAM gene family in peanut (Arachis hypogaea L.).Front Plant Sci. 2025 Jun 19;16:1599610. doi: 10.3389/fpls.2025.1599610. eCollection 2025. Front Plant Sci. 2025. PMID: 40612613 Free PMC article.
-
Lost in transition: Maize BAM7 is a dual function gene encoding a nuclear BAM7 and plastidial BAM2.Plant Physiol. 2023 Aug 3;192(4):2577-2579. doi: 10.1093/plphys/kiad260. Plant Physiol. 2023. PMID: 37139856 Free PMC article. No abstract available.
-
Maize β-amylase7 encodes 2 proteins using alternative transcriptional start sites: Nuclear BAM7 and plastidic BAM2.Plant Physiol. 2023 Aug 3;192(4):2871-2882. doi: 10.1093/plphys/kiad227. Plant Physiol. 2023. PMID: 37067898 Free PMC article.
-
Potassium cations expand the conformation ensemble of Arabidopsis thaliana β-amylase2 (BAM2).MicroPubl Biol. 2024 Jul 22;2024:10.17912/micropub.biology.001257. doi: 10.17912/micropub.biology.001257. eCollection 2024. MicroPubl Biol. 2024. PMID: 39109193 Free PMC article.
References
-
- Almagro Armenteros, J. J., Tsirigos, K. D., Sønderby, C. K., Petersen, T. N., Winther, O., Brunak, S., von Heijne, G. & Nielsen, H. (2019). Nat. Biotechnol. 37, 420–423. - PubMed
-
- Ayoubi, T. A. & Van De Yen, W. J. M. (1996). FASEB J. 10, 453–460. - PubMed
-
- Cheong, C. G., Eom, S. H., Chang, C., Shin, D. H., Song, H. K., Min, K., Moon, J. H., Kim, K. K., Hwang, K. Y. & Suh, S. W. (1995). Proteins, 21, 105–117. - PubMed
-
- Erdős, G. & Dosztányi, Z. (2020). Curr. Protoc. Bioinform. 70, e99. - PubMed
MeSH terms
Substances
Grants and funding
LinkOut - more resources
Full Text Sources
Miscellaneous

