. 2022 Jun 15;132(12):e150927.
doi: 10.1172/JCI150927.

IL-33 acts as a costimulatory signal to generate alloreactive Th1 cells in graft-versus-host disease

Affiliations

IL-33 acts as a costimulatory signal to generate alloreactive Th1 cells in graft-versus-host disease

Gaelen K Dwyer et al. J Clin Invest. .

Abstract

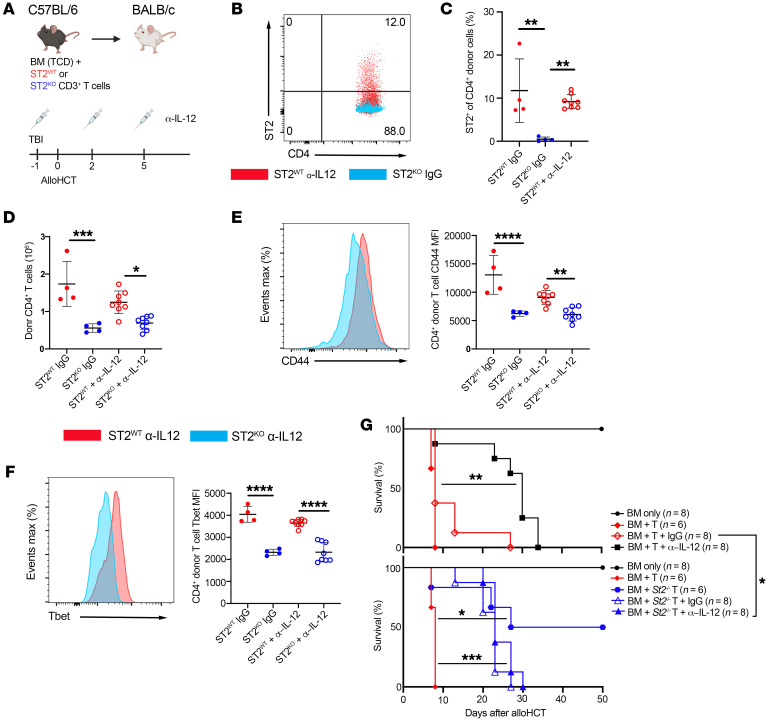
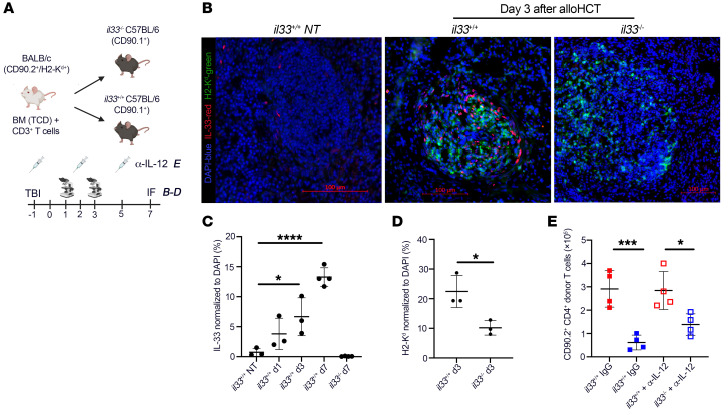
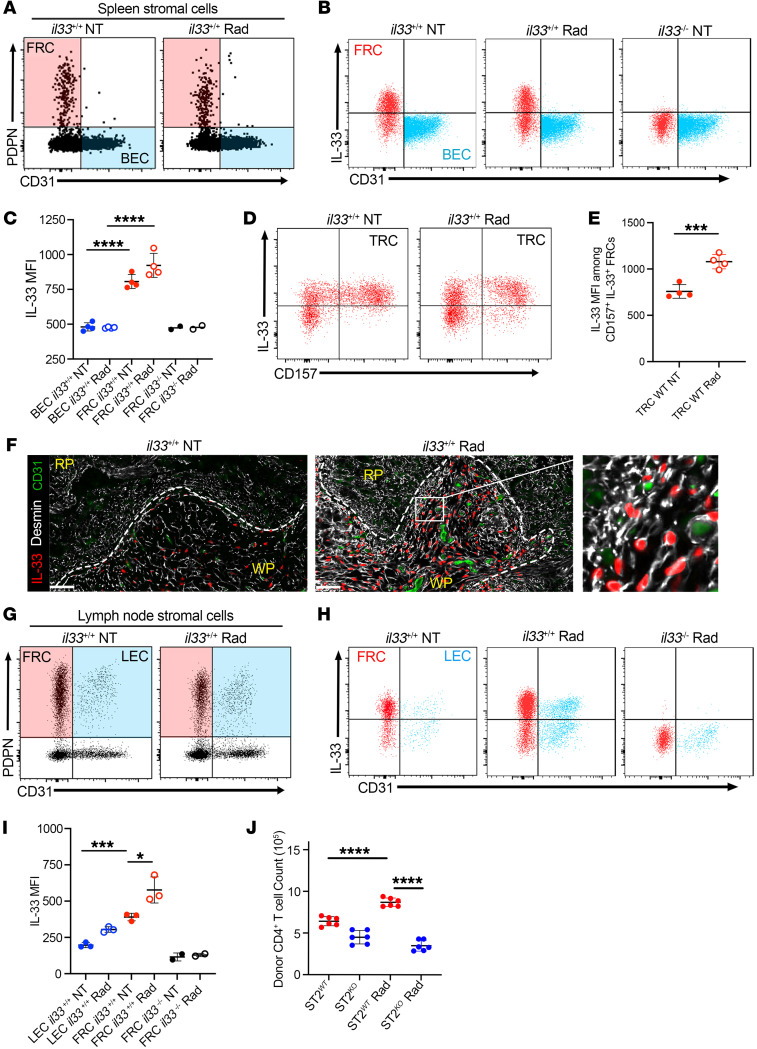
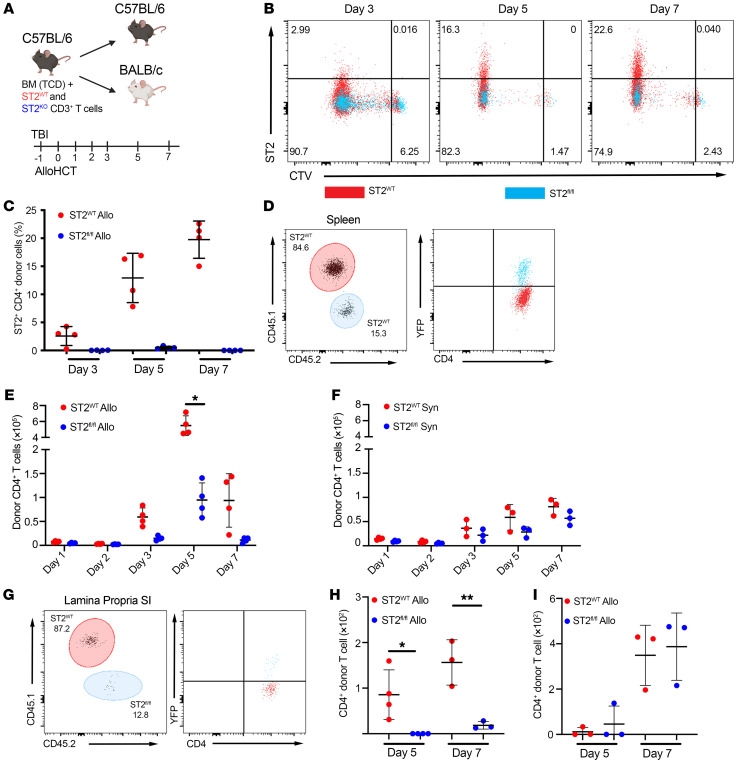
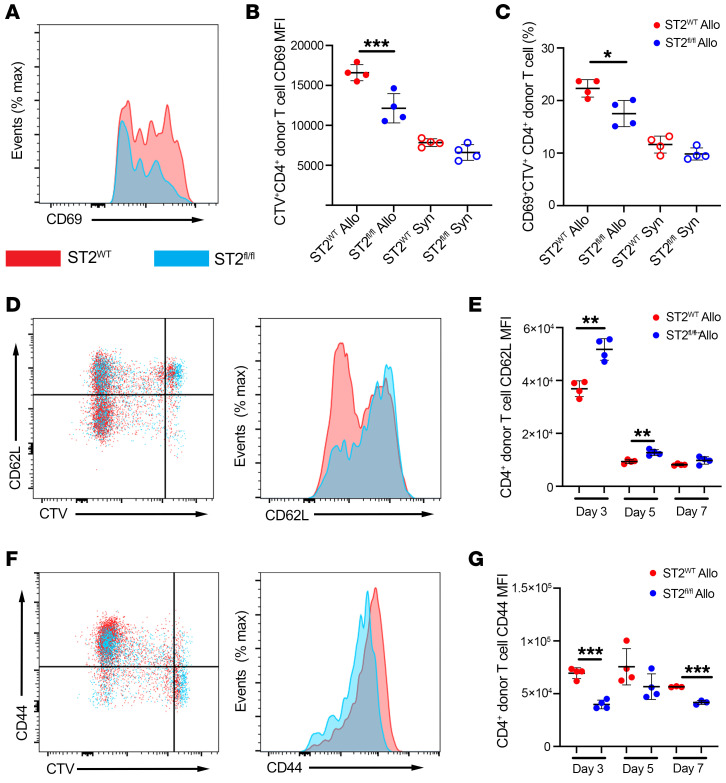
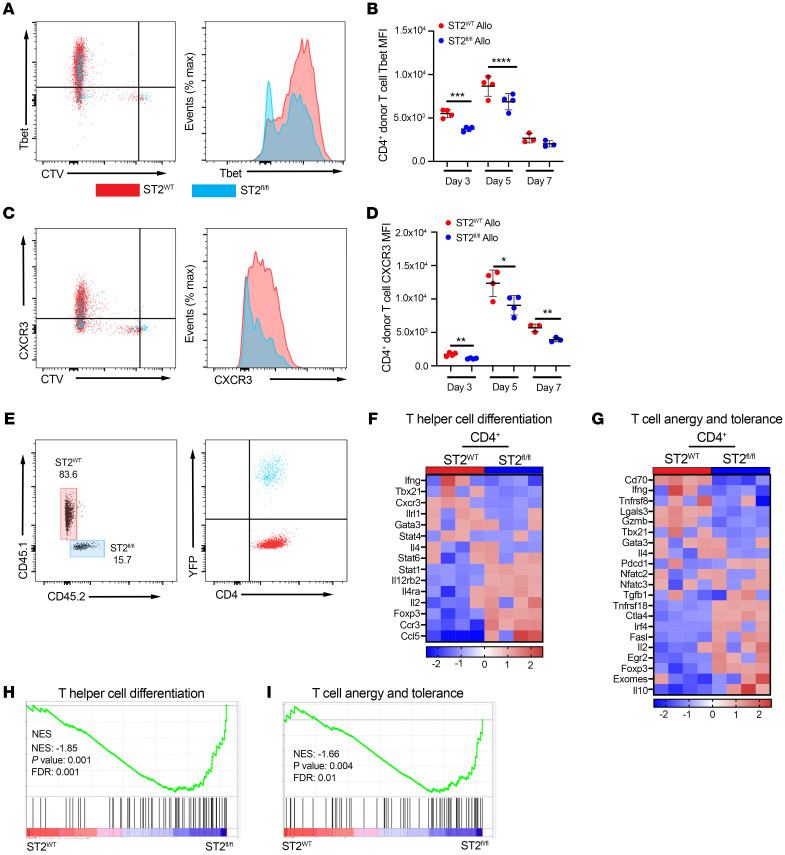
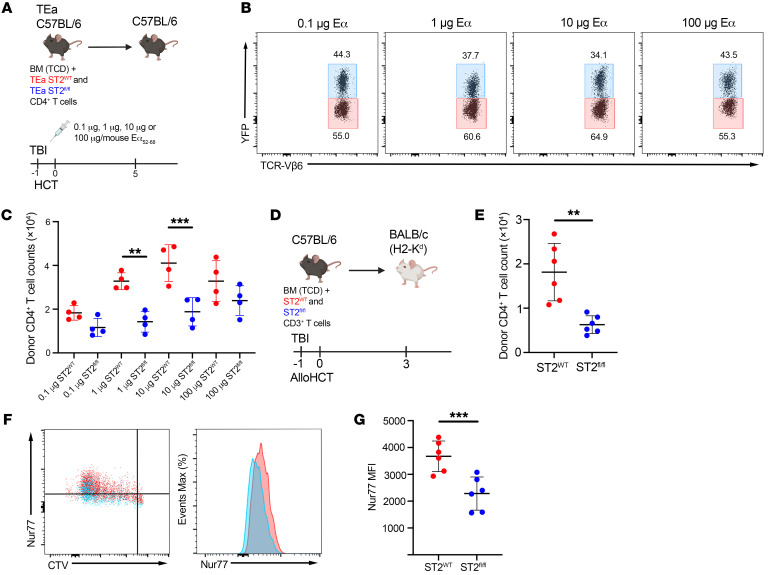
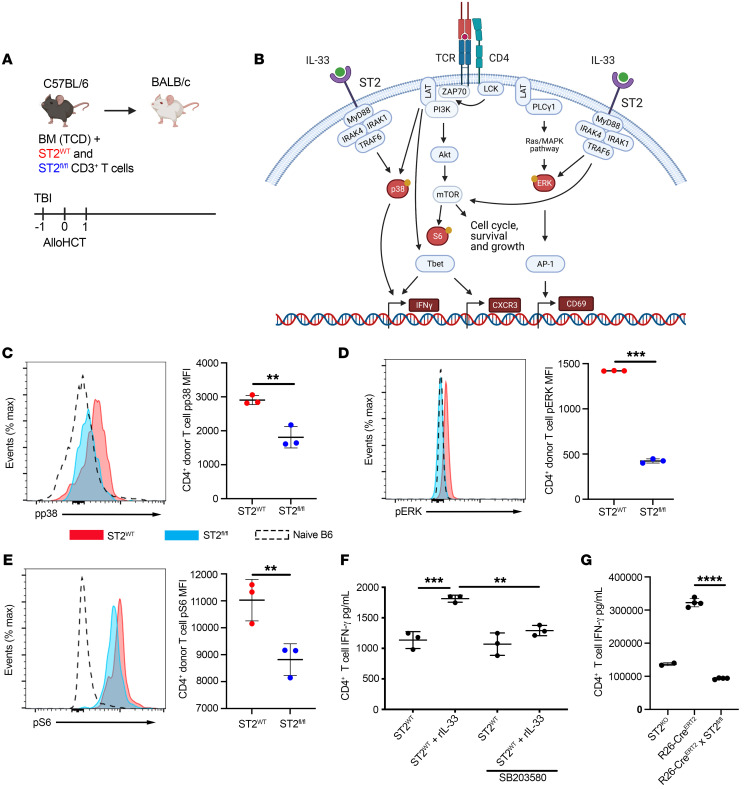
Antigen-presenting cells (APCs) integrate signals emanating from local pathology and program appropriate T cell responses. In allogeneic hematopoietic stem cell transplantation (alloHCT), recipient conditioning releases damage-associated molecular patterns (DAMPs) that generate proinflammatory APCs that secrete IL-12, which is a driver of donor Th1 responses, causing graft-versus-host disease (GVHD). Nevertheless, other mechanisms exist to initiate alloreactive T cell responses, as recipients with disrupted DAMP signaling or lacking IL-12 develop GVHD. We established that tissue damage signals are perceived directly by donor CD4+ T cells and promoted T cell expansion and differentiation. Specifically, the fibroblastic reticular cell-derived DAMP IL-33 is increased by recipient conditioning and is critical for the initial activation, proliferation, and differentiation of alloreactive Th1 cells. IL-33 stimulation of CD4+ T cells was not required for lymphopenia-induced expansion, however. IL-33 promoted IL-12-independent expression of Tbet and generation of Th1 cells that infiltrated GVHD target tissues. Mechanistically, IL-33 augmented CD4+ T cell TCR-associated signaling pathways in response to alloantigen. This enhanced T cell expansion and Th1 polarization, but inhibited the expression of regulatory molecules such as IL-10 and Foxp3. These data establish an unappreciated role for IL-33 as a costimulatory signal for donor Th1 generation after alloHCT.

Keywords: Bone marrow transplantation; Costimulation; Immunology; Th1 response; Transplantation.


Conflict of interest statement

Conflict of interest: BRB receives remuneration as an advisor to Magenta Therapeutics and BlueRock Therapeutics; receives research funding from BlueRock Therapeutics, Rheos Medicines, and the Childrens’ Cancer Research Fund; and is a cofounder of Tmunity Therapeutics. HRT receives renumeration as a scientific advisor to Slate Biotech and research funding from ECM Therapeutics. WS is a cofounder of, equity holder in, and paid consultant for Bluesphere Bio.

Figures

Figure 1
Figure 1. Administration of IL-33 after alloHCT increases the severity of GVHD independent of IL-12.
(AE) On d–1 before transplant, BALB/c recipient mice received lethal TBI (8 Gy) and cohorts received anti–IL-12p40 (α–IL-12p40) (500 μg/mouse/d) or IgG as control, and this treatment was repeated every 3 days (d2, d5, and d8). On d0, recipients received 1 × 10⁷ WT C57BL/6 (B6) T cell–depleted bone marrow (TCD-BM) alone or with 2 × 10⁶ B6 CD3+ T cells (B) or 2 × 10⁶ il12rb2–/– B6 CD3+ T cells (C) by i.v. injection. Cohorts were treated i.p. with rIL-33 (from d3 to d7 after alloHCT; 0.5 μg/mouse/d) or PBS. (A) Model schematic as it relates to IgG or α–IL-12p40 (B and C) donor T cells (D and E) and rIL-33 treatments (BE). (B) Survival graph depicting the influence of rIL-33 with anti–IL-12p40–treated group or (D) on il12rb2–/– CD3+ T cells. (C) Clinical scores depicting the influence of rIL-33 with α–IL-12p40–treated group or(E) on il12rb2–/– CD3+ T cells. Kaplan-Meier survival curve was used for B and D; C and E show clinical scores. n = 6–9/group. *P < 0.05; ***P < 0.001.
Figure 2
Figure 2. IL-33 stimulation after alloHCT expands ST2+/+ CD4+ donor T cells and contributes to GVHD lethality independently of IL-12.
(AG) On d–1, BALB/c recipient mice (AF) received α–IL-12p40 or IgG as control (as in Figure 1) and received lethal TBI. On d0, mice received 1 × 10⁷ B6 TCD-BM with 2 × 10⁶ CD90.2+ B6 St2–/– (ST2KO) or CD90.1+St2+/+ (ST2WT) CD3+T cells. Total splenocytes were assessed at d7 by flow cytometry. (A) Model schematic. (B) Representative ST2 expression on donor CD4+CD90.1+H2-Kd– ST2WT (red) and CD4+CD90.1H2-Kd– ST2KO (blue) cells from recipient’s spleens at d7. (C) Frequency of ST2+ donor CD90.1ST2KO and CD90.1+ST2WT CD4+ T cells. (D) Donor CD90.1ST2KO and CD90.1+ST2WT CD4+ T cells counts in recipients that received α–IL-12p40 or IgG. (E) Representative CD44 expression on CD90.1ST2KO (blue) and CD90.1+ST2WT (red) CD4+ T cells and quantification of CD44 MFI. (F) Representative Tbet expression on CD90.1ST2KO (blue) and CD90.1+ST2WT (red) CD4+ T cells and quantification of Tbet MFI. (G) Survival graph depicting the influence of donor T cell ST2 deletion alone or with IL-12 neutralization on GVHD lethality. Data in BF are represented as mean ± SD. Kaplan-Meier survival curve was used for G. n = 6–8/group. *P < 0.05; **P < 0.01; ***P < 0.001; ****P < 0.0001, 1-way ANOVA (CF).
Figure 3
Figure 3. alloHCT conditioning increases recipient IL-33 expression in the spleen and is necessary for donor T cell expansion independently of IL-12.
(AE) On d–1, CD90.1+il33–/– or CD90.1+il33+/+ B6 recipient mice received lethal TBI (11 Gy), and some cohorts received anti–IL-12p40 or IgG as control (as described in Figure 1). On d0, mice received 1 × 10⁷ H2-Kd+CD90.2+ BALB/c TCD-BM with 2 × 10⁶ H2-Kd+CD90.2+ BALB/c CD3+T cells. Donor H2-Kd+ splenocytes were assessed at d1, d3, and d7 by immunofluorescence microscopy and at d7 by flow cytometry. (A) Model schematic as it relates to imaging (BD) and antibody (IgG or anti–IL-12p40) treatments (E). (B) Representative spleen image from each cohort on d3. (C) Frequency of IL-33+ cells in the recipient and naive spleens; 1 complete scanned cross section was analyzed per mouse. (D) Frequency of H2-Kd+ donor T cells in recipient spleens at d3, analyzed from 1 complete scanned cross section per mouse. (E) Donor CD90.2+CD4+ cell counts from the spleen on d7. Data in BF are represented as mean ± SD. n = 3–4/group. *P < 0.05; ***P < 0.001; ****P < 0.0001, 1-way ANOVA (B and E); Student’s t test (D).
Figure 4
Figure 4. FRCs increase IL-33 after irradiation to stimulate ST2-dependent donor CD4+ T cell expansion.
(AI) WT B6 mice received lethal TBI (11 Gy; Rad [radiation treated]) on d0. On d1, spleen and LN samples were compared with those from nonirradiated WT and il33–/– B6 mice. (AE) Flow cytometric analysis of splenic stromal cell isolates. (A) Representative dot plots of live TER119CD45 pregated stromal cells highlighting PDPN+CD31FRCs (red) and CD31+PDPN blood endothelial cells (BECs) (blue). (B) IL-33 expression by FRCs and BECs. il33–/– B6 mice served as a negative control. (C) MFI for IL-33 in the IL33+ gate of BECs and FRCs. (D) Representative plots showing IL-33 expression in PDPN+FRC subsets using CD157 to identify TRCs. (E) IL-33 MFI in the IL33+ gate of splenic TRC. (F) Spleen staining for IL-33 (red) and fibroblast (desmin; white) and vascular (CD31; green) markers. The magnified region highlights IL-33 within desmin+ white pulp FRCs. Dotted lines depict red pulp (RP) and white pulp (WP) borders. Scale bars: 50 μm. (G) Representative plots of LN stromal isolates gated as in A and highlighting PDPN+CD31FRCs (red) versus CD31+PDPN+ lymphatic endothelial cells (LECs) (blue). (H) IL-33 expression in FRCs versus LECs. (I) MFI for IL-33 in the IL33+ gate of FRCs and LECs. (J) Purified B6 LN FRCs were either irradiated (3.5 Gy) or left untreated, and after 24 hours, FRCs were cultured with TCD and irradiated (3.5 Gy) B6 splenocytes and BALB/c St2+/+ or St2–/– T cells. Flow cytometry was used to quantify CD4+ T cells on d3. Data are represented as mean ± SD. *P < 0.05; ***P < 0.001; ****P < 0.0001, 1-way ANOVA. Data are representative of at least 2 experiments.
Figure 5
Figure 5. Early donor CD4+ T cell expansion is dependent on IL-33.
(AH) BALB/c (allo) and B6 (syn) recipient mice received lethal TBI (8 Gy or 11 Gy, respectively) on d–1. On d0, the recipient mice received 1 × 10⁷ WT B6 TCD-BM with 1 × 10⁶ CD3+ T cells from CD45.2+ CD4-Cre×R26-LSL-YFP×St2fl/fl (ST2fl/fl) and 1 × 10⁶ CD3+ T cells from St2+/+ CD45.1+ (ST2WT) B6 mice. T cells were labeled with CTV prior to adoptive transfer. T cells were harvested from the spleen on d1, d2, d3, d5, and d7 after alloHCT and from the SI lamina propria on d5 and d7 and assessed by flow cytometry. (A) Model schematic. (B) Representative plots of ST2 expression on donor CD4+CD45.1+H2-Kd– ST2WT (red, quadrant frequencies) and CD4+CD45.2+H2-Kd–YFP+ ST2fl/fl (blue) cells isolated from the spleen of the same allo recipient. (C) Frequency of ST2 on donor CD45.1+ or CD45.2+CTVlo donor T cells on d3, d5, and d7. (DF) Representative plot of CD45.1+YFP and CD45.2+YFP+ donor CD4+ T cells of an allo recipient (D) and total ST2WT (red) versus ST2fl/fl (blue) donor CD4+ T cells from the spleen of (E) allo or (F) syn recipients on the indicated day. (G) Representative plot of CD4+ donor ST2WT (red) versus ST2fl/fl (blue) from the SI lamina propria of an allo recipient. (HI) total ST2WT (red) versus ST2fl/fl (blue) donor CD4+ T cell counts from the SI (H) allo recipients or (I) syn recipients. Data in AI are represented as mean ± SD. n = 3–4/group. Data are representative of 2 independent experiments. *P < 0.05; **P < 0.01, 2-way ANOVA (CI).
Figure 6
Figure 6. IL-33 stimulation augments early donor CD4+ T cell activation.
(AG) CD3+ T cells from CD45.2+ CD4-Cre×R26-LSL-YFP×St2fl/fl (ST2fl/fl) B6 (1 × 10⁶) and St2+/+ CD45.1+ (ST2WT) B6 (1 × 10⁶) mice were labeled with CTV and cotransferred with 1 × 10⁷ WT B6 TCD-BM into lethally irradiated BALB/c and B6 recipients. T cells were isolated from the spleens on d1, d2, d3, d5, and d7 and assessed by flow cytometry. (A) Representative CD69 expression on ST2WT (red) CD45.1+CTV+ or ST2fl/fl (blue) CD45.2+CTV+ donor CD4+ T cells from the same allo recipient spleen on d1. (B) Quantification of CD69 MFI on CD45.1+ or CD45.2+ CTV+ donor CD4+ T cells from allo recipient spleens on d1. (C) Quantification of frequency of CD45.1+ or CD45.2+CTV+ donor CD69+ CD4T cells at d1. (D) Representative plot (CTV versus CD62L) and histogram of CD62L expression on ST2WT (red) or ST2fl/fl (blue) donor CD4+ T cells from an allo recipient spleen on d3. (E) Quantification of CD62L MFI on d3, d5, and d7. (F) Representative plot (CTV versus CD44) and histogram of CD44 expression on ST2WT (red) or ST2fl/fl (blue) donor CD4+ T cells from an allo recipient spleen on d3. (G) Quantification of CD44 MFI on d3, d5, and d7. Data shown in BG are represented as mean ± SD. n = 3–4/group. Data are representative of 2 experiments. *P < 0.05; **P < 0.01; ***P <0.001, 1-way ANOVA (B and C); 2-way ANOVA (E and G).
Figure 7
Figure 7. IL-33 stimulation of donor CD4+ T cells drives Th1 differentiation while inhibiting regulatory gene expression.
(AD) CTV-labeled CD3+ T cells from CD45.2+ CD4-Cre×R26-LSL-YFP×St2fl/fl (ST2fl/fl) B6 (1 × 10⁶) and St2+/+ CD45.1+ (ST2WT) B6 (1 × 10⁶) mice were cotransferred with 1 × 10⁷ WT B6 TCD-BM into irradiated BALB/c and B6 recipients. Splenocytes were harvested on d1, d2, d3, d5, and d7 for flow analysis. (A) Representative plot (CTV versus Tbet) and histogram of Tbet expression on ST2WT (red) or ST2fl/fl (blue) donor CD4+ T cells from the same allo spleen (d5). (B) Quantification of Tbet MFI on d3, d5, and d7. (C) Representative plot (CTV versus CXCR3) and histogram of CXCR3 expression on ST2WT (red) or ST2fl/fl (blue) donor CD4+ T cells from the same allo spleen (d7). (D) Quantification of CXCR3 MFI on d3, d5, and d7. (EI) CTV-labeled CD3+ T cells from ST2fl/fl and ST2WT B6 mice were cotransferred into irradiated BALB/c as described in AD. CD4+ T cells were sorted from the same spleen on d5 for St2+/+ H2-Kd–CD45.1+YFP (ST2WT) and St2fl/fl H2-Kd–CD45.2+YFP+ (ST2fl/fl) directly into cDNA prep cell lysis buffer. (E) Representative sort plot of CD4+CD45.1+YFP and CD4+CD45.2+YFP+ donor cells. (F and G) Heatmaps of T helper cell differentiation and T cell anergy and tolerance-associated genes enriched in ST2WT (red) and ST2fl/fl (blue) donor CD4+ T cells. (H and I) Leading edge plots of GSEA of ST2WT (red) or ST2fl/fl (blue) donor CD4+ T cells compared with transcriptional profiles of T helper cell differentiation and T cell anergy and tolerance. Data in AD are represented as mean ± SD with n = 3–4/group. Data are representative of 2 independent experiments. Data in EI show n = 4/group. *P < 0.05; **P < 0.01; ***P < 0.001; ****P < 0.0001, 2-way ANOVA (B and D).
Figure 8
Figure 8. IL-33 boosts TCR signaling to support alloreactive CD4+ T cell expansion.
(AC) B6 mice received lethal TBI (11 Gy) on d–1 and 1 × 10⁷ WT B6 TCD-BM with 1 × 10⁶ TEa and 1 × 10⁶ CD4-Cre×R26-LSL-YFP×St2fl/fl TEa B6 CD4+ T cells on d0. They also received the indicated doses of Eα52–68 peptide i.p. Splenic T cells were assessed on d5 by flow cytometry. (A) Model schematic. (B) Representative plots of ST2WT (TCR-Vβ6+YFP; red) and ST2fl/fl TEa (TCR-Vβ6+YFP+; blue) CD4+ T cells and (C) quantification of their numbers on d5. (DG) CTV-labeled CD3+ T cells from CD45.2+ CD4-Cre×R26-LSL-YFP×St2fl/fl B6 (1 × 10⁶) and St2+/+ CD45.1+ B6 (1 × 10⁶) mice were cotransferred with 1 × 10⁷ WT B6 TCD-BM into lethally irradiated BALB/c recipients. ST2WT (red) and ST2fl/fl (blue) CD4+ T cells from the same spleen were assessed by flow cytometry on d3. (D) Model schematic. (E) Comparison of donor ST2WT (red) and ST2fl/fl (blue) CD4+ T cells counts from the same spleen on d3. (F) Representative plots and histograms of Nur77 expression. (G) Nur77 MFI on d3 from ST2WT (red) and ST2fl/fl (blue) donor CD4+ T cells. Data in B and C are represented as mean ± SD with n = 4/group. Data in EG are represented as mean ± SD with n = 4–6/group. Data are representative of 2 independent experiments. **P < 0.01; ***P < 0.001, 1-way ANOVA (C); paired Student’s t test (EG).
Figure 9
Figure 9. Alloantigen-driven TCR signaling networks are enhanced by IL-33 stimulation.
(A) Model schematic. (B) Diagram of overlapping TCR and ST2-signaling pathways. (CE) CTV-labeled CD3+ T cells from CD45.2+ CD4-Cre×R26-LSL-YFP×St2fl/fl B6 (1 × 10⁶) and St2+/+ CD45.1+ B6 (1 × 10⁶) mice were cotransferred with 1 × 10⁷ WT B6 TCD-BM into lethally irradiated BALB/c recipients. ST2WT (red) and ST2fl/fl (blue) CD4+ T cells from the same spleen were assessed by flow cytometry on d1. (C) Representative histograms of p-p38 and quantification of p-p38 MFI; (D) pERK expression and quantification of pERK MFI; (E) pS6 expression and quantification of pS6 MFI on d1 from ST2WT (red) and ST2fl/fl (blue) donor CD4+ T cells (CE). (F) Sorted naive CD4+ T cells from St2+/+ B6 were stimulated in vitro with anti-CD3/CD28 beads, IL-12, IL-2, and anti–IL-4 for 4d, followed by a 3-hour rest and 24-hour IL-33 stimulation (or no stimulation) with or without p38 inhibition (SB203580). IFN-γ in supernatants was assessed by ELISA. (G) Sorted naive CD4+ T cells from St2+/+ B6 were stimulated in vitro with anti-CD3/CD28 beads, IL-12, IL-2, anti–IL-4, IL-33, and TAM for 4 days, and IFN-γ in supernatants was determined by ELISA. Data in CF are represented as mean ± SD with n = 3–4/group. Data are representative of 2 experiments. Data in G show n = 2–4/group. *P < 0.05; **P < 0.01; ***P < 0.001; ****P < 0.0001, Student’s t test (CE); 1-way ANOVA (F and G).

Comment in

Similar articles

Cited by

References

    1. Bayraktar UD, et al. Ex vivo T cell-depleted versus unmodified allografts in patients with acute myeloid leukemia in first complete remission. Biol Blood Marrow Transplant. 2013;19(6):898–903. doi: 10.1016/j.bbmt.2013.02.018. - DOI - PMC - PubMed
    1. Bleakley M, et al. Outcomes of acute leukemia patients transplanted with naive T cell-depleted stem cell grafts. J Clin Invest. 2015;125(7):2677–2689. doi: 10.1172/JCI81229. - DOI - PMC - PubMed
    1. Klein OR, et al. Nonmyeloablative haploidentical bone marrow transplantation with post-transplantation cyclophosphamide for pediatric and young adult patients with high-risk hematologic malignancies. Biol Blood Marrow Transplant. 2017;23(2):325–332. doi: 10.1016/j.bbmt.2016.11.016. - DOI - PMC - PubMed
    1. Hill GR, et al. Current concepts and advances in graft-versus-host disease immunology. Annu Rev Immunol. 2021;39:19–49. doi: 10.1146/annurev-immunol-102119-073227. - DOI - PMC - PubMed
    1. Leventhal JR, Ildstad ST. Tolerance induction in HLA disparate living donor kidney transplantation by facilitating cell-enriched donor stem cell Infusion: The importance of durable chimerism. Hum Immunol. 2018;79(5):272–276. doi: 10.1016/j.humimm.2018.01.007. - DOI - PubMed

Publication types