. 2022 Jun 15;132(12):e145666.
doi: 10.1172/JCI145666.

BCG therapy downregulates HLA-I on malignant cells to subvert antitumor immune responses in bladder cancer

Affiliations

BCG therapy downregulates HLA-I on malignant cells to subvert antitumor immune responses in bladder cancer

Mathieu Rouanne et al. J Clin Invest. .

Abstract

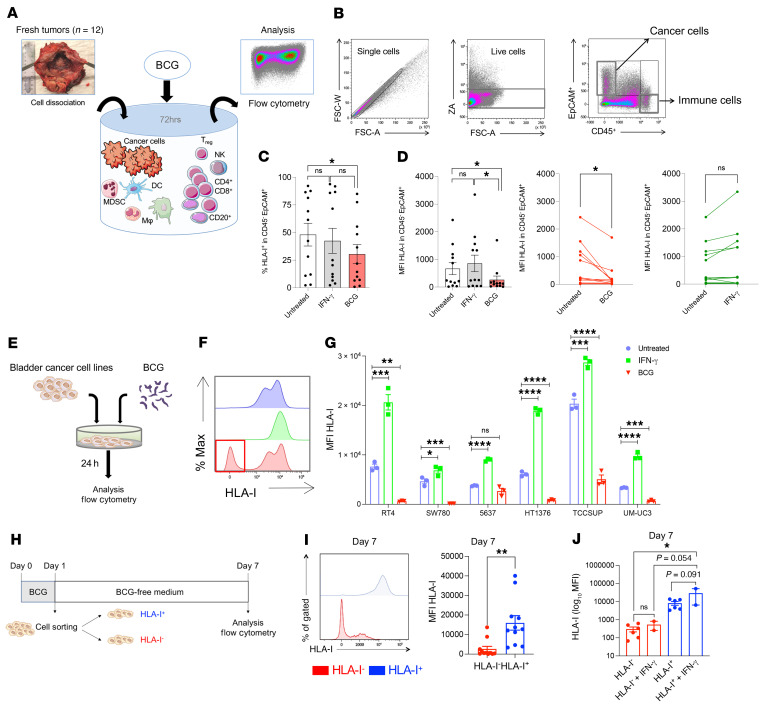
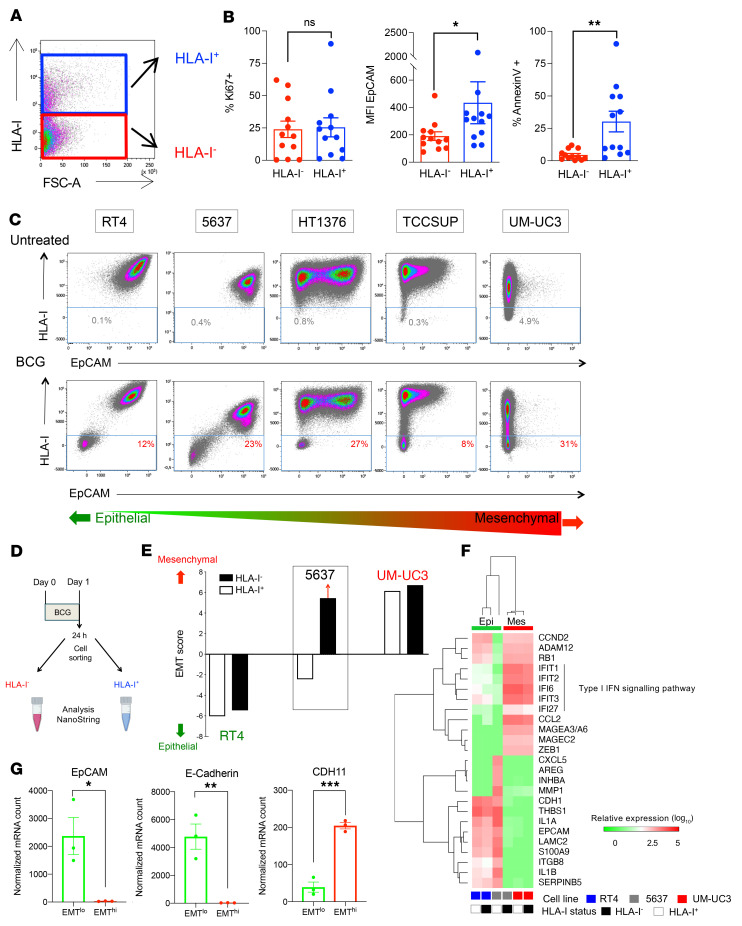
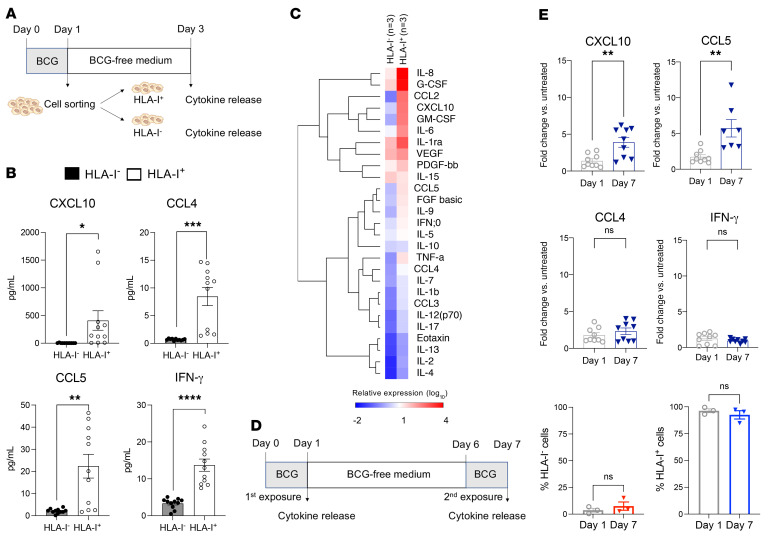
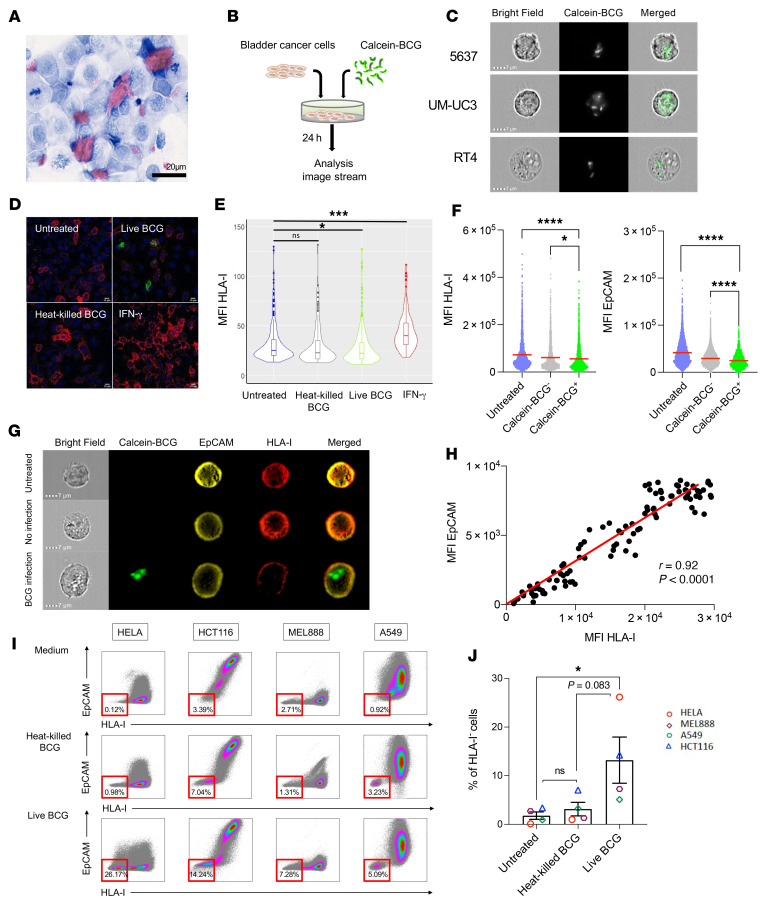
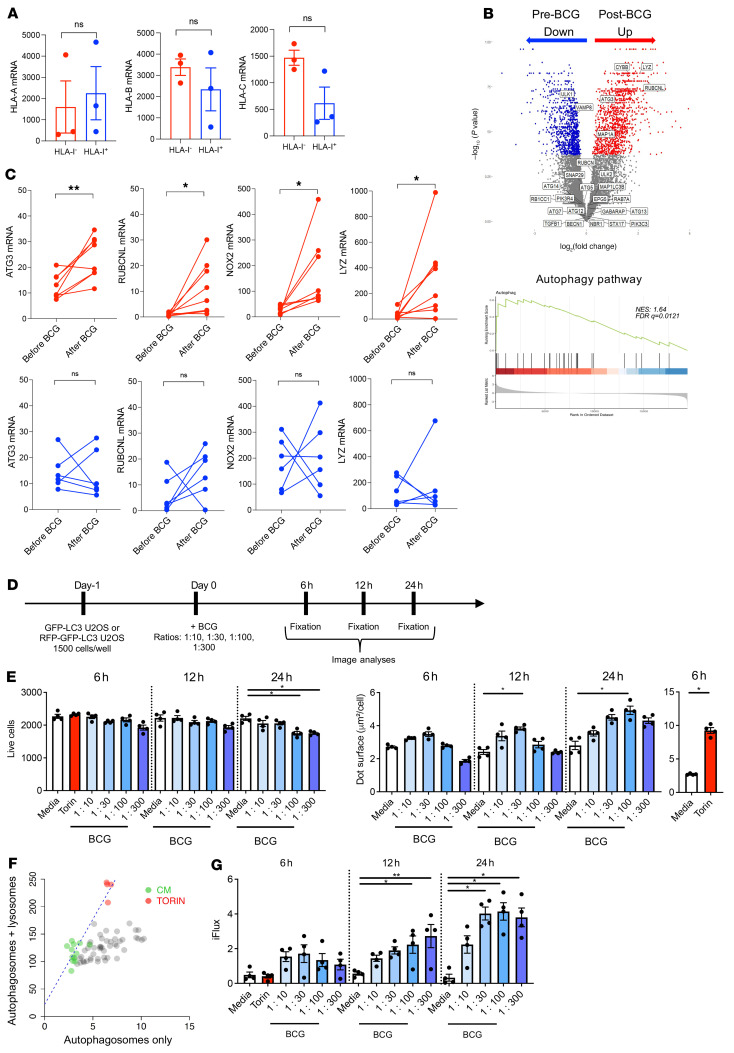
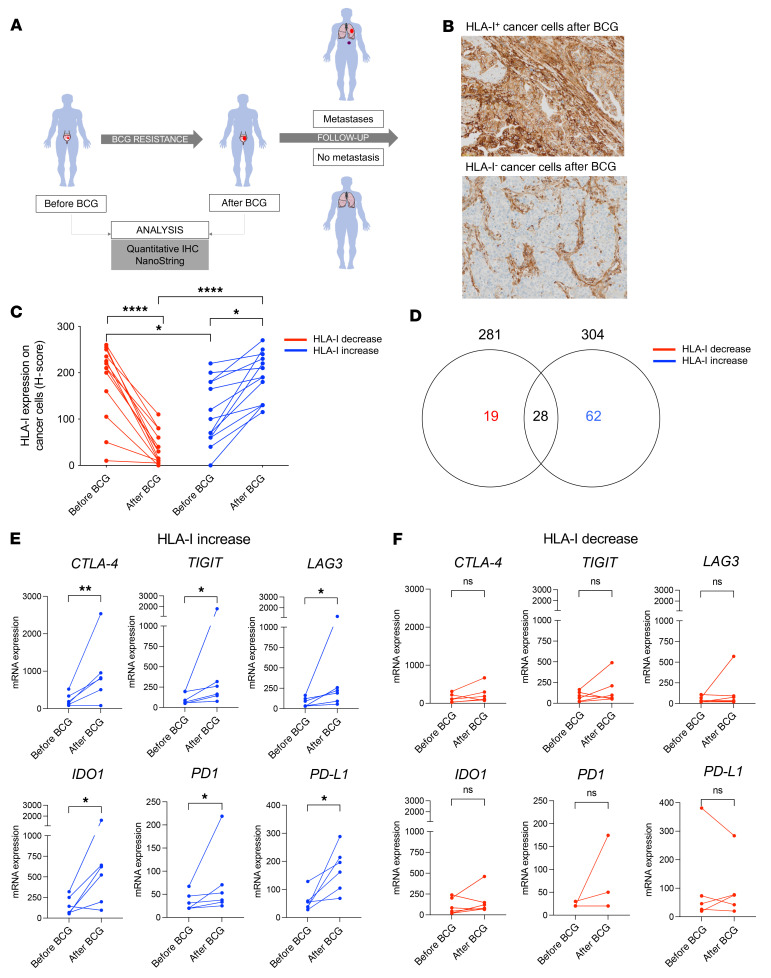
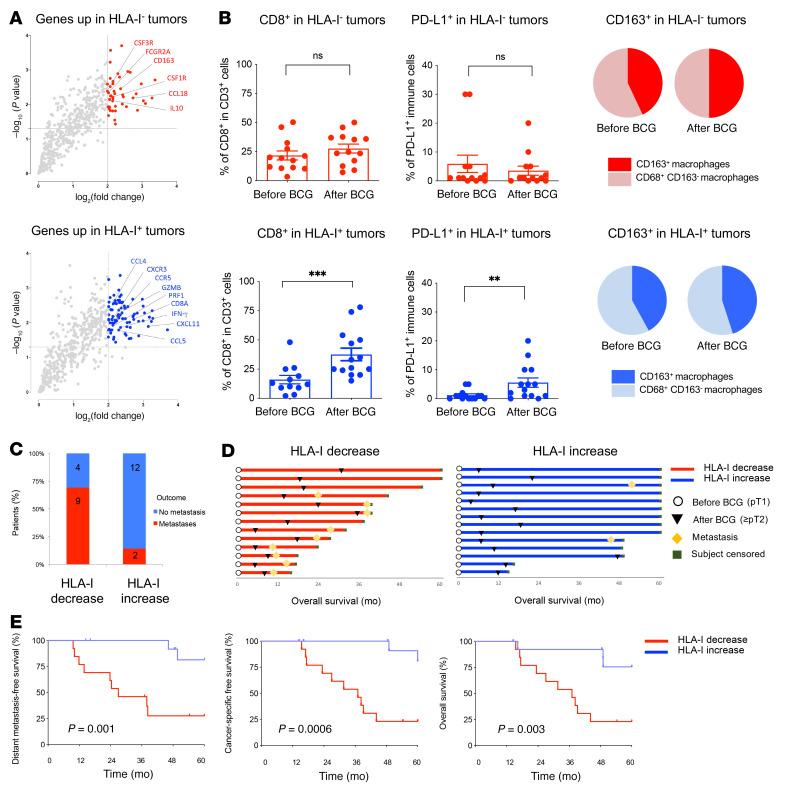
Patients with high-risk, nonmuscle-invasive bladder cancer (NMIBC) frequently relapse after standard intravesical bacillus Calmette-Guérin (BCG) therapy and may have a dismal outcome. The mechanisms of resistance to such immunotherapy remain poorly understood. Here, using cancer cell lines, freshly resected human bladder tumors, and samples from cohorts of patients with bladder cancer before and after BCG therapy, we demonstrate 2 distinct patterns of immune subversion upon BCG relapse. In the first pattern, intracellular BCG infection of cancer cells induced a posttranscriptional downregulation of HLA-I membrane expression via inhibition of autophagy flux. Patients with HLA-I-deficient cancer cells following BCG therapy had a myeloid immunosuppressive tumor microenvironment (TME) with epithelial-mesenchymal transition (EMT) characteristics and dismal outcomes. Conversely, patients with HLA-I-proficient cancer cells after BCG therapy presented with CD8+ T cell tumor infiltrates, upregulation of inflammatory cytokines, and immune checkpoint-inhibitory molecules. The latter patients had a very favorable outcome. We surmise that HLA-I expression in bladder cancers at relapse following BCG does not result from immunoediting but rather from an immune subversion process directly induced by BCG on cancer cells, which predicts a dismal prognosis. HLA-I scoring of cancer cells by IHC staining can be easily implemented by pathologists in routine practice to stratify future treatment strategies for patients with urothelial cancer.

Keywords: Bacterial infections; Cancer; Immunology; MHC class 1; Oncology.


Conflict of interest statement

Conflict of interest: Over the past 2 years, JCS has received consultancy fees and shares from Relay Therapeutics and Gritstone bio; was on the board of directors of Hookipa Pharmaceuticals (2018–2021); was full-time employee (2017–2019) at AstraZeneca; and has been a full-time employee at Amgen since August 2021. Over the past 7 years, AM has received institutional funding grants from AstraZeneca, Merus, Bristol Myers Squibb (BMS), Boehringer Ingelheim, Transgene, Fondation MSD Avenir, and Sanofi; is member of the Clinical Trial Steering Committee for NCT02528357 (GlaxoSmithKline [GSK]), NCT03334617 (AstraZeneca); is a member of the Data Safety and Monitoring Board for NCT02423863 (sponsor: Oncovir) and NCT03818685 (sponsor: Centre Léon Bérard); has participated on the scientific advisory boards of the following companies: Merck Serono, eTheRNA, Lytix Biopharma, Kyowa Kirin Pharma, Novartis, BMS, Symphogen, Genmab, Amgen, Biothera, Nektar, Tesaro/GSK, Oncosec, Pfizer, Seattle Genetics, AstraZeneca/Medimmune, Servier, Gritstone, Molecular Partners, Bayer, Partner Therapeutics, Sanofi, Pierre Fabre, RedX Pharma, OSE Immunotherapeutics, Medicxi, HiFiBio, IMCheck, MSD, Innate Pharma, and HotSpot Therapeutics; has received teaching/speaker honoraria from Roche/Genentech, BMS, Merck (MSD), Merck Serono, AstraZeneca/Medimmune, Amgen, Sanofi, and Servier; has received fees for scientific and medical consulting from Roche, Pierre Fabre, Onxeo, EISAI, Bayer, Genticel, Rigontec, Daichii Sankyo, Imaxio, Sanofi/BioNTech, Molecular Partners, Pillar Partners, Benta Pharma Industries (BPI), and Faron; has received nonfinancial support (travel expenses) from AstraZeneca, BMS, Merck (MSD), and Roche; and is co-founder and shareholder of Centessa; holds a patent titled “Humanized and chimeric monoclonal antibodies to CD81” (US patent application serial no. 62/351,054). LZ is founder of EverImmune, a cancer/microbiome biotechnology company; is a member of the board of directors of Transgene; is a member of the scientific advisory board of Transgene, EpiVax, Lytix Biopharma; has received past research contracts with Merus, Roche, and Tusk and honoraria from Transgene; has current research contracts with Innovate Pharma, Kaleido, Pileje, Incyte, BMS, GSK, and Transgene; and is an employee of Gustave Roussy and the Faculté de Médecine Paris XI. GK is on the board of directors of the BMS Foundation (France); receives grants and research support form Daiichi Sankyo, Eleor, Kaleido, Lytix Pharma, PharmaMar, Samsara, Sotio, and Vasculox/Tioma; is founder and shareholder of EverImmune, Osasuna Therapeutics, Samsara Therapeutics, and Therafast Bio ; and is an employee of the University of Paris, AP-HP, Gustave Roussy. OK receives grant and research support from Daiichi Sankyo, Eleor, Kaleido, Lytix Pharma, PharmaMar, Samsara, Sotio, and Vasculox/Tioma; is founder and shareholder of Samsara Therapeutics; and is an employee of INSERM, Gustave Roussy. JPT is the scientific founder and chairman of BioCheetah Pte Ltd (Singapore), a company involved in urine-based bladder cancer diagnostics. LT has received research grants from the BMS Foundation and Terumo and honoraria or consulting fees from Boston Scientific, General Electric, and Ipsen.

Figures

Figure 1
Figure 1. BCG induces HLA-I downregulation on cancer cells.
(A) Cell suspensions from freshly dissociated human bladder tumors were cultured in triplicate in complete medium (untreated), stimulated with IFN-γ, or coincubated with BCG. (B) Gating strategy adopted to detect CD45+ immune cells and CD45EpCAM+ cancer cells by flow cytometric analysis. (C) Proportions of HLA-I+CD45EpCAM+ cells among live tumor cells following ex vivo BCG or IFN-γ stimulation of fresh human tumors (n = 12; 1-way ANOVA with Tukey’s post test). (D) MFI of HLA-I on live CD45EpCAM+ cancer cells upon ex vivo BCG or IFN-γ exposure (n = 12 paired samples; 1-way ANOVA with Tukey’s post test). (E) High-grade (n = 4) and low-grade (n = 2) human bladder cancer cell lines were cultured in vitro in triplicate under 3 conditions: untreated, stimulated with IFN-γ, or coincubated with BCG. (F) Histogram showing HLA-I downregulation in a subset of cancer cells upon BCG exposure. (G) HLA-I MFI by flow cytometry 24 hours after in vitro BCG or IFN-γ exposure (n = 3 conditions per cell line; 1-way ANOVA with Tukey’s post test). (H) HLA-I+ and HLA-I cancer cells were sorted after 24 hours of coincubation with BCG. HLA-I+ and HLA-I cancer cells were cultured in BCG-free medium for 6 additional days, followed by flow cytometric analysis on day 7 to measure HLA-I expression on the cancer cells. (I) Sustained HLA-I MFI of cancer cells after 6 days in BCG-free medium. Left inset: Illustrative MFI from HLA-I+ (blue) and HLA-I (red). Graph shows cumulative data points of HLA-I MFI from 5 distinct cancer cells lines (n = 5 independent experiments using RT4, 5637, HT1376, TCCSUP, and UM-UC3 cancer cell lines; unpaired, 2-tailed t test). (J) HLA-I+ and HLA-I cancer cells were restimulated with IFN-γ for 24 hours after 3 days of culturing in BCG-free medium (1-way ANOVA with Tukey’s post test). All data are presented as the mean ± SEM. *P < 0.05, **P < 0.005, ***P < 0.001, and ****P < 0.0001.
Figure 2
Figure 2. BCG induces EMT characteristics in the subset of HLA-I cancer cells.
(A)Flow cytometric dot plot showing HLA-I+ and HLA-I cancer cells among live cells following ex vivo BCG stimulation of fresh human tumors for 72 hours. (B) MFI of EpCAM (n = 12; 1-way ANOVA with Tukey’s post test) and relative proportions of proliferative Ki67+ and apoptotic annexin-V+ cells (n = 12; paired, 2-tailed t test) among live cancer cells by flow cytometry. (C) Flow cytometric dot plots for HLA-I and EpCAM expression in live cancer cells. Dot plots illustrate the control condition at the top and the BCG condition at the bottom. Cancer cells were ordered according to their baseline expression of EpCAM (MFI), ranging from the left (epithelial type, RT4) to the right (mesenchymal type, UM-UC3). (D) Cancer cells (RT4, 5637, and UM-UC3) were coincubated with BCG for 24 hours and sorted on the basis of their HLA-I membrane expression. Total RNA extraction of HLA-I+ and HLA-I cancer cells was performed. (E) The EMT score based on NanoString IO360 transcriptomic data was obtained for HLA-I+ and HLA-I cancer cells. HLA-I 5637 cancer cells showed the strongest shift toward a mesenchymal score. (F) Unsupervised hierarchical clustering analysis of cancer cells according to EMT status, depicted per cell line (columns), HLA-I status (columns), and genes expressed (rows). (G) Epithelial (CDH1 [E-cadherin] and EPCAM) and mesenchymal (CDH11) absolute mRNA expression after BCG (red, EMThi UM-UC3 and 5637 HLA-I; green, EMTlo RT4 and 5637 HLA-I+). Unpaired, 2-tailed t test. All data are presented as the mean ± SEM. *P < 0.05, **P < 0.005, ***P < 0.001.
Figure 3
Figure 3. BCG induces greater inflammatory responses in HLA-I+ than in HLA-I cancer cells, and these responses are further enhanced upon BCG reexposure.
(A) Cytokine and chemokine release in the supernatant was measured separately in HLA-I+ and HLA-I cancer cells 24 hours after coincubation with BCG and independent culturing in BCG-free medium for 3 days (n = 3 independent experiments in triplicate per cell line). (B) HLA-I+ cancer cells released significant levels of CXCL10, CCL4, CCL5, and IFN-γ upon BCG exposure, as opposed to HLA-I cancer cells, which released low levels of cytokines. (C) Heatmap showing cytokine and chemokine relative expression in HLA-I+ and HLA-I cancer cells 24 hours after coincubation with BCG. (D) BCG restimulation assay evaluating cytokine and chemokine recall responses of cancer cells (5637 cell line). The first stimulation was for 24 hours, followed by 5 days of culturing in BCG-free medium and a second BCG exposure for 24 hours. Cytokine and chemokine production was measured after the first and the second stimulations. (E) Cancer cells initially primed with BCG displayed significantly increased levels of CXCL10 and CCL5 upon restimulation with BCG 7 days later (upper panels), but this secondary exposure to BCG did not modify the secretion levels of CCL4 or IFN-γ (middle panels) or the proportions of cancer cells expressing HLA-I (lower panels). *P < 0.05, **P < 0.005, ***P < 0.001, and ****P < 0.0001, by unpaired, 2-tailed Student’s t test.
Figure 4
Figure 4. BCG-infected cancer cells downregulate HLA-I and EpCAM membrane protein expression.
(A) Ziehl-Neelsen staining for UM-UC3 cancer cells coincubated with BCG (MOI of 10) for 24 hours showed isolated bacteria inside cancer cells and agglomerates of BCG outside of cancer cells. Scale bar: 20 μm. (B) Experimental setting to evaluate the coincubation of cancer cells (RT4, 5637, UM-UC3) with calcein-labeled BCG. (C) Intracytoplasmic visualization of calcein-labeled BCG inside the cytoplasm of cancer cells. Original magnification, ×60. (D) Immunofluorescence staining of HLA-I (red), and calcein (green) in human bladder cancer cells following in vitro exposure to calcein-labeled BCG, heat-killed, calcein-labeled BCG, or IFN-γ for 24 hours. Original magnification, ×63. (E) HLA-I MFI quantification per confocal image analysis on cancer cells cocultured with heat-killed or live BCG. HLA-I MFI data is given for every single cell acquired for untreated (n = 244 cells), BCG (n = 239), heat-killed BCG (n = 160), and IFN-γ (n = 175). Only live BCG induced a significant downregulation of HLA-I expression on cancer cells (1-way ANOVA with Tukey’s post test). (F) MFI for HLA-I and EpCAM in BCG infected (intracellular calcein-BCG+) versus noninfected (calcein-BCG) cancer cells. Controls were untreated cancer cells (1-way ANOVA with Tukey’s post test). (G) Representative images of BCG-untreated, BCG-infected, and BCG-noninfected cancer cells 24 hours after BCG coincubation. Original magnification, ×60. (H) Spearman’s correlation for the MFI of HLA-I and EpCAM in 100 cancer cells, 24 hours after BCG coincubation. (I) HLA-I and EpCAM expression on melanoma (MEL888), lung (A549), colorectal (HCT116), and cervical (HeLa) carcinoma cells when cultured with control media, heat-killed BCG, or live BCG. Relative proportion of HLA-I cancer cells (percentage) among live cells (1-way ANOVA with Tukey’s post test). (J) Proportion of HLA-I cells upon 24 hours of coincubation with either heat-killed or live BCG on HELA, HCT116, MEL888, and A549 cancer cell lines (1-way ANOVA with Tukey’s post test). Data are presented as the mean ± SEM. *P < 0.05, ***P < 0.001, and ****P < 0.0001.
Figure 5
Figure 5. BCG induces posttranscriptional downregulation of HLA-I associated with inhibition of autophagy flux.
(A) HLA-IA/-B/-C mRNA expression in HLA-I and HLA-I+ cancer cells following BCG exposure for 24 hours (unpaired, 2-tailed Student’s t test). (B) Gene expression in tumors that became HLA-I upon BCG therapy. Top: differentially expressed genes in paired human bladder tumors (n = 8; significantly up-/downregulated genes are identified by color dots; P < 0.05). Bottom: Gene set analysis showing enrichment of autophagy pathway genes (n = 8). (C) Before and after BCG therapy, paired analysis of autophagy-related gene expression levels in bladder tumors with decreasing (red) or increasing (blue) levels of HLA-I expression after BCG (paired, 2-tailed Student’s t test). (D) U2OS cells were engineered to express LC3 (autophagosome marker) and were fused to GFP with or without RFP. LC3-GFP cells, with or without RFP U2OS cells, were seeded overnight before adding BCG and cocultured for 6 hours, 12 hours, and 24 hours at different BCG MOI. Torin (1 μM; autophagy inducer) was used as a positive control and media as a negative control. (E) LC3-GFP U2OS cells were cultured for 6 hours, 12 hours, and 24 hours with BCG (MOI of 1:10, 1:30, 1:100, and 1:300), torin (1 μM), or media. Live cells counts (left) and GFP-LC3 puncta surface (right). Statistical analysis was determined by Kruskal-Wallis ANOVA and Dunn’s multiple-comparison test with media as the control. Data are from 1 of 2 independent experiments and are shown as the mean ± SEM of 4 technical replicates. (F) LC3-GFP-RFP U2OS cells were cocultured for 6 hours, 12 hours, and 24 hours with BCG (MOI of 1:10, 1:30, 1:100, and 1:300), torin (1 μM), or media. The linear regression curve is between the total surface of yellow (red plus green) and red (autophagosomes plus autophagolysosomes) dots. The negative control (media) is shown in green and the positive control (torin) in red. The gray dots indicate wells with BCG. (G) Quantification of the flux inhibition (iFlux) score. Kruskal-Wallis ANOVA and Dunn’s multiple-comparison test were performed, with media as the control. Data from 1 experiment are shown as the mean ± SEM of 4 technical replicates. *P < 0.05 and **P < 0.005.
Figure 6
Figure 6. Cancer cell HLA-I downregulation upon BCG therapy is associated with an absence of T cell checkpoint modulation in the TME.
(A) A longitudinal cohort of patients with BCG-resistant or refractory bladder cancer was identified (n = 27). Paired bladder tumors were evaluated before and after BCG immunotherapy–acquired resistance. (B) Representative images of HLA-I+ or HLA-I IHC stainings from bladder tumors with acquired resistance to BCG immunotherapy. Scale bar: 50 μm. (C) Relapsing/refractory bladder tumors displayed either downregulation (red) or upregulation (blue) of HLA-I upon BCG immunotherapy (1-way ANOVA with Tukey’s post test). (D) Venn diagram depicting the number of upregulated transcripts (P < 0.05) between paired tumors before and after BCG (n = 6) according to the evolution of HLA-I expression at the proteomic (i.e., IHC) level (left circle, number of upregulated genes in tumors with decreased HLA-I; right circle, number of upregulated genes in tumors with increased HLA-I). Only genes differentially upregulated (i.e., P < 0.05; log2 fold change ≥2) before and after BCG immunotherapy were selected from the NanoString analysis. (E and F) Paired representation of the absolute expression of immune checkpoint inhibitory receptor and ligand mRNAs before and after BCG relapse (red: HLA-I decrease, n = 6; blue: HLA-I increase, n = 6). Paired, 2-tailed Student’s t test. *P < 0.05, **P < 0.005, and ****P < 0.0001.
Figure 7
Figure 7. Two distinct mechanisms of cancer cell immune escape with opposite HLA-I dynamics steer the outcome of BCG immunotherapy.
(A) Volcano plots showing genes that were upregulated in tumors with decreased HLA-I (HLA-I tumors; upper panel, in red) or in tumors with increased HLA-I (HLA-I+ tumors; lower panel, in blue), according to HLA-I expression at the protein level (per IHC) after BCG immunotherapy. Significantly upregulated genes of interest in each group are identified by colored dots (P < 0.05 and a log2 fold change ≥2). (B) IHC immune profiling of bladder tumor samples before and after BCG (n = 27). The density of CD8+ in CD3+ cells (percentage) and of PD-L1 expression on immune cells (percentage) is shown (paired, 2-tailed Student’s t test). Cumulative pie charts show the mean level of CD163+CD68+ cells among intratumoral macrophages (CD68+) before and after BCG (n = 27). Upper panel shows tumors with decreased HLA-I (HLA-I tumors; in red), and lower panel shows tumors with increased HLA-I (HLA-I+ tumors; in blue). **P < 0.005 and ***P < 0.00, by paired, 2-tailed Student’s t test. (C) Number and proportion of patients who developed distant metastasis during follow-up according to the evolution of HLA-I expression in their bladder tumors before and after BCG (red, HLA-I decrease; blue, HLA-I increase). (D) Swimmer plot depicting overall survival, the time to development of resistance to BCG, and the timing of distant metastasis for individual patients with bladder cancer according to the evolution of HLA-I expression in their tumor before and after BCG (red, HLA-I decrease; blue, HLA-I increase). (E) Distant metastasis–free survival, cancer-specific survival, and OS in the cohort of patients with bladder cancer (n = 27) according to the evolution of HLA-I expression in their tumors before and after BCG (red, HLA-I decrease; blue, HLA-I increase). P values were determined by log-rank test.

Similar articles

Cited by

References

    1. Hedegaard J, et al. Comprehensive Transcriptional Analysis of Early-Stage Urothelial Carcinoma. Cancer Cell. 2016;30(1):27–42. doi: 10.1016/j.ccell.2016.05.004. - DOI - PubMed
    1. Tan TZ, et al. Molecular subtypes of urothelial bladder vancer: results from a meta-cohort analysis of 2411 tumors. Eur Urol. 2019;75(3):423–432. doi: 10.1016/j.eururo.2018.08.027. - DOI - PubMed
    1. Lamm DL, et al. A randomized trial of intravesical doxorubicin and immunotherapy with bacille calmette-guérin for transitional-cell carcinoma of the bladder. N Engl J Med. 1991;325(17):1205–1209. doi: 10.1056/NEJM199110243251703. - DOI - PubMed
    1. Brosch R, et al. Genome plasticity of BCG and impact on vaccine efficacy. Proc Natl Acad Sci U S A. 2007;104(13):5596–5601. doi: 10.1073/pnas.0700869104. - DOI - PMC - PubMed
    1. Chamie K, et al. Recurrence of high-risk bladder cancer: a population-based analysis. Cancer. 2013;119(17):3219–3227. doi: 10.1002/cncr.28147. - DOI - PMC - PubMed

Publication types