. 2022 May 12;65(9):6888-6902.
doi: 10.1021/acs.jmedchem.2c00235. Epub 2022 May 3.

Differential Modulation of Nuclear Receptor LRH-1 through Targeting Buried and Surface Regions of the Binding Pocket

Affiliations

Differential Modulation of Nuclear Receptor LRH-1 through Targeting Buried and Surface Regions of the Binding Pocket

Michael L Cato et al. J Med Chem. .

Abstract

Liver receptor homologue-1 (LRH-1) is a phospholipid-sensing nuclear receptor that has shown promise as a target for alleviating intestinal inflammation and metabolic dysregulation in the liver. LRH-1 contains a large ligand-binding pocket, but generating synthetic modulators has been challenging. We have had recent success generating potent and efficacious agonists through two distinct strategies. We targeted residues deep within the pocket to enhance compound binding and residues at the mouth of the pocket to mimic interactions made by phospholipids. Here, we unite these two designs into one molecule to synthesize the most potent LRH-1 agonist to date. Through a combination of global transcriptomic, biochemical, and structural studies, we show that selective modulation can be driven through contacting deep versus surface polar regions in the pocket. While deep pocket contacts convey high affinity, contacts with the pocket mouth dominate allostery and provide a phospholipid-like transcriptional response in cultured cells.


Conflict of interest statement

CONFLICTS OF INTEREST

The authors declare no conflicts of interest.

Figures
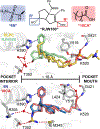
Figure 1.
Figure 1.. LRH-1 agonists 6N and 10CA contact orthogonal regions of the ligand binding pocket.
Top: Chemical structures of lead LRH-1 synthetic agonists. Bottom: Binding pose of DLPC (yellow, PDB 4DOS), RJW100 (green, PDB 5L11), 6N (blue, PDB 6OQY), and 10CA (red, PDB 7JYD). Residue sidechains (and backbones of G421 and L424) are shown as sticks (O=red, N=blue, S=yellow), water molecules are shown as spheres, and bonds are represented as dotted lines (hydrogen=red, π–π stacking=blue).
Figure 2.
Figure 2.. Combining modifications from synthetic agonists improves compound binding, potency, and thermal stability.
A. FP competition assay showing binding of small molecules to the LRH-1 LBD. B. Luciferase reporter assay (HeLa cells), comparing lead agonist potency and efficacy. C. Comparison of ligand-driven thermal stability of the LRH-1 LBD. The inflection point corresponds to the temperature at which the protein unfolds. Data shown as mean ± SEM from two independent experiments (FP), four biological replicates (luciferase), or three independent experiments (thermal shift). Data normalized to signal of DMSO (no agonist) control for luciferase reporter and thermal shift assays. D. Summary of data. Ki: inhibition constant. EC50: half maximal effective concentration. 95% confidence intervals shown in brackets.
Figure 3.
Figure 3.. LRH-1 synthetic agonists promote opposing transcriptional profiles for lipid metabolism.
A. RT-qPCR analysis of HepG2 cells treated with agonists (synthetic agonists – 10 μM, DLPC – 100 μM) for 24 hrs. Data normalized to signal of DMSO control and shown as mean ± SEM from four biological replicates. Brown-Forsythe and Welch One-Way ANOVA with Dunnett T3 Multiple Comparisons Test, #p<0.06, *p < 0.05, **p < 0.01, ***p < 0.001, ****p < 0.0001. B. GO biological process analysis of HepG2 cells treated with 6N and 6N-10CA. Genes used in analysis were those significantly (p < 0.05) up- (6N-10CA) or downregulated (6N) by compounds. Adjusted p-value cutoff of 0.05 indicated by dotted line. δPathways upregulated by DLPC. bp: biosynthetic process, mp: metabolic process, cp: catabolic process. C. mRNA fold change of genes significantly (adjusted p < 0.05) upregulated by DLPC and downregulated by 6N. Shp and Cyp7a1 are also shown for comparison with RT-qPCR data.
Figure 4.
Figure 4.. LRH-1 synthetic agonists differentially modulate coregulator signaling.
A. LRH-1 LBD peptide binding assay. Binding affinities are shown with 95% confidence intervals in brackets. Kd: dissociation constant. Data shown as mean ± SEM from four independent experiments. B. Luciferase reporter assays (HeLa cells), with LRH-1 and indicated coregulators overexpressed. Data normalized to signal of DMSO (no agonist) control. Low, medium, and high doses correspond to 1.0 e-7, 1.0 e-6, and 1.0 e-5 M (RJW100 and 10CA) and 5.0 e-8, 5.0 e-7, and 5.0 e-6 M (6N and 6N-10CA). pDest26 is the vector control for PGC-1α, SRC3, and NCOR1, while pcDNA is the vector control for p300. Data shown as mean ± SEM from four biological replicates. Two-way ANOVA with Dunnett Multiple Comparisons Test, *p < 0.05, **p < 0.01, ***p < 0.001, ****p < 0.0001.
Figure 5.
Figure 5.. 6N-10CA co-opts LBP contacts and allostery of previous LRH-1 synthetic agonists.
A. Ligand FO-FC omit map showing electron density for 6N-10CA contoured at 2.5σ. B. Co-crystal structure of 6N-10CA (purple) bound to the LRH-1 LBD (PDB 7TT8). Tif2 coactivator peptide is shown in green. C. 6N-10CA binding mode with sidechains (along with backbones of G421 and L424) of engaged residues shown as sticks (O=red, N=blue, S=yellow), water molecules shown as spheres, and bonds represented as dotted lines (hydrogen=red, π–π stacking=blue). D. Overlay of RJW100, 6N, 10CA, and 6N-10CA with nearby residue sidechains (and backbone of G421) shown as sticks. E. All-residue (Cα) difference distance analysis identifies regions of structural dissimilarity between ligand-bound states on the LBD. Distance between each residue (Å) was first determined for apo and DLPC-bound LBD. A difference distance matrix was calculated by subtracting distances in apo-LBD from the DLPC-LBD crystal structure. F. Residues used to determine structural differences around the pocket mouth are shown as sticks. Distances between indicated residues (Cα atoms) are shown for each complex (apo: PDB 4PLD; DLPC: PDB 4DOS; RJW100: PDB 5L11; 6N: PDB 6OQY; 10CA: PDB 7JYD; 6N-10CA: PDB 7TT8). G. Pathway analysis of LRH-1 LBD bound to 6N, 10CA, and 6N-10CA showing communication between the AF-B or ligand and the AF-2 (H3=pink, H4–H5=yellow, Tif2 coactivator peptide=green).
Figure 6.
Figure 6.. Pocket mouth contacts drive PL-like signaling from the AF-B.
A. Matrix showing number of paths between all residues (Cα) on LRH-1-LBD-PGC-1α bound to 6N-10CA. The AF-B (residues 400–430) is highlighted with dotted lines, and G421 is indicated with a red arrow. Regions of high communication with AF-B are highlighted and overlayed onto the LBD in (B). C. Communication between AF-B and two sites highlighted in (A) and (B). Each line represents the number of paths of communication between G421 and a residue within the two sites indicated. D. Pathway analysis of LRH-1 LBD bound to ligands indicated (H3=pink, H4–H5=yellow, H7=purple, H12=cyan, PGC-1α coactivator peptide=green). Paths between G421 (proxy for AF-B) and PGC-1α peptide are shown in blue. Number of paths between two nodes (Cα) represented by edge weight. E. Differential HDX-MS data from ligand-FL-LRH-1 complexes (vs. uncomplexed FL-LRH-1) mapped onto model of FL-LRH-1 proposed by Seacrist et al. Black regions were not observed, and grey regions indicated no significant change in deuterium uptake.
Scheme 1.
Scheme 1.. 6N-10CA synthetic route.
(a) Tetrapropylammonium per-rhuthenate, N-methylmorpholine N-oxide, H2O, MeCN, 23 °C, 16 h; (b) MeCN, conc. aq. HCl, 23 °C, 1 h; (c) MeOH, conc. aq. HCl, 23 °C, 16 h; (d) NH3 (7N in MeOH), titanium(IV) isopropoxide, 23 °C, 6h. Sodium borohydride, 16 h; (e) chlorosulfonyl isocyanate, tBuOH, DCM, 0–23 °C; (f) 1,4-dioxane: conc. aq. HCl (3:1 v/v), 40 °C, 16h. Percent yields are provided for each step.

Similar articles

Cited by

References

    1. Millard CJ; Watson PJ; Fairall L; Schwabe JW An Evolving Understanding of Nuclear Receptor Coregulator Proteins. J Mol Endocrinol 2013, 51 (3), T23–36. DOI: 10.1530/JME-13-0227. - DOI - PMC - PubMed
    1. Weikum ER; Liu X; Ortlund EA The Nuclear Receptor Superfamily: A Structural Perspective. Protein Sci 2018, 27 (11), 1876–1892. DOI: 10.1002/pro.3496. - DOI - PMC - PubMed
    1. Kojetin DJ; Burris TP Small Molecule Modulation of Nuclear Receptor Conformational Dynamics: Implications for Function and Drug Discovery. Mol Pharmacol 2013, 83 (1), 1–8. DOI: 10.1124/mol.112.079285. - DOI - PMC - PubMed
    1. Nagy L; Schwabe JW Mechanism of the Nuclear Receptor Molecular Switch. Trends Biochem Sci 2004, 29 (6), 317–324. DOI: 10.1016/j.tibs.2004.04.006. - DOI - PubMed
    1. Nakajima T; Uchida U; Anderson SF; Lee C; Hurwitz J; Parvin JD; Montminy M Rna Helicase a Mediates Association of Cbp with Rna Polymerase II. Cell 1997, 90, 1107–1112. - PubMed

Publication types

MeSH terms

Substances