. 2022 Jul 1;132(13):e150951.
doi: 10.1172/JCI150951.

Bitter taste signaling in tracheal epithelial brush cells elicits innate immune responses to bacterial infection

Affiliations

Bitter taste signaling in tracheal epithelial brush cells elicits innate immune responses to bacterial infection

Monika I Hollenhorst et al. J Clin Invest. .

Abstract

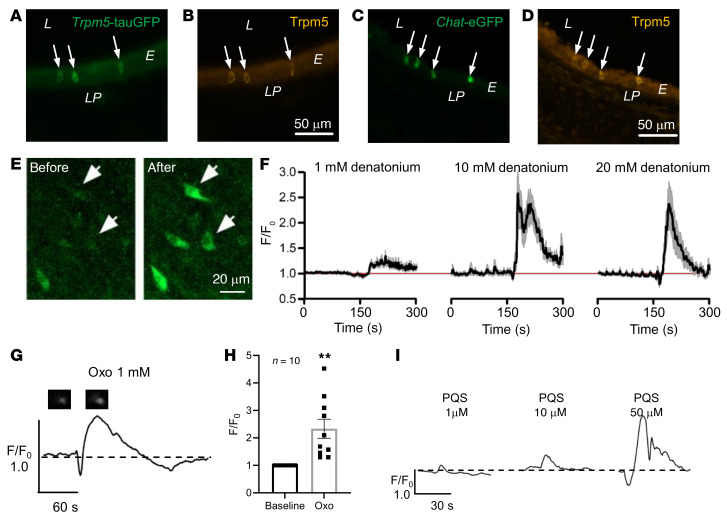
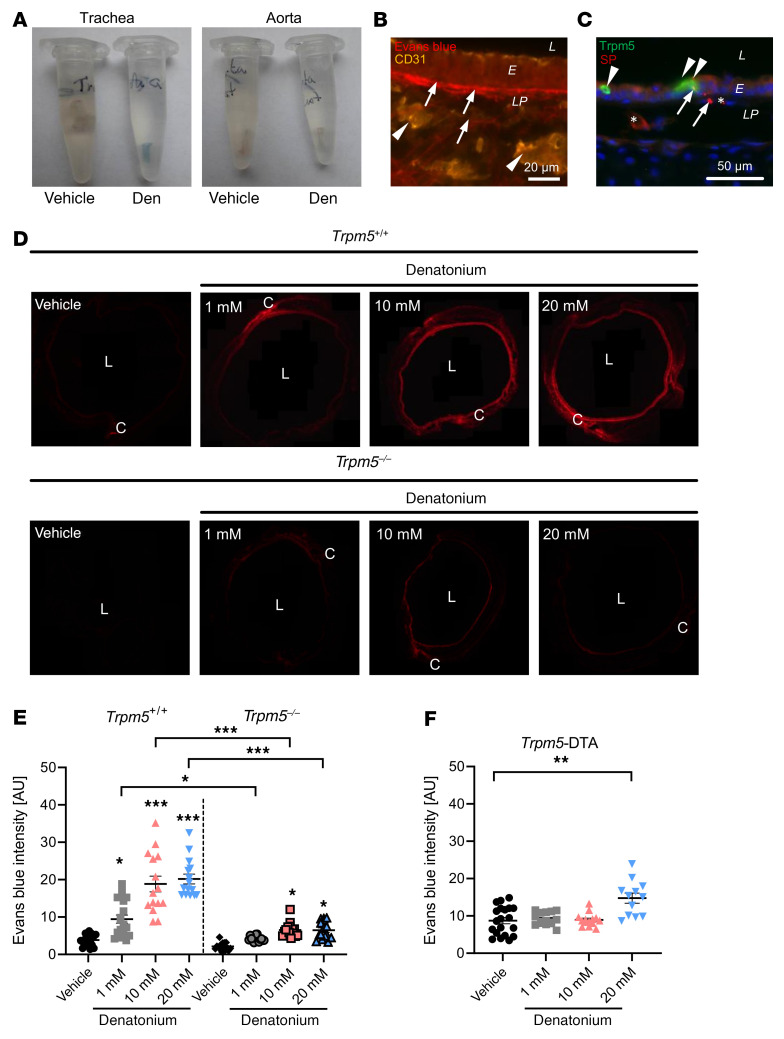
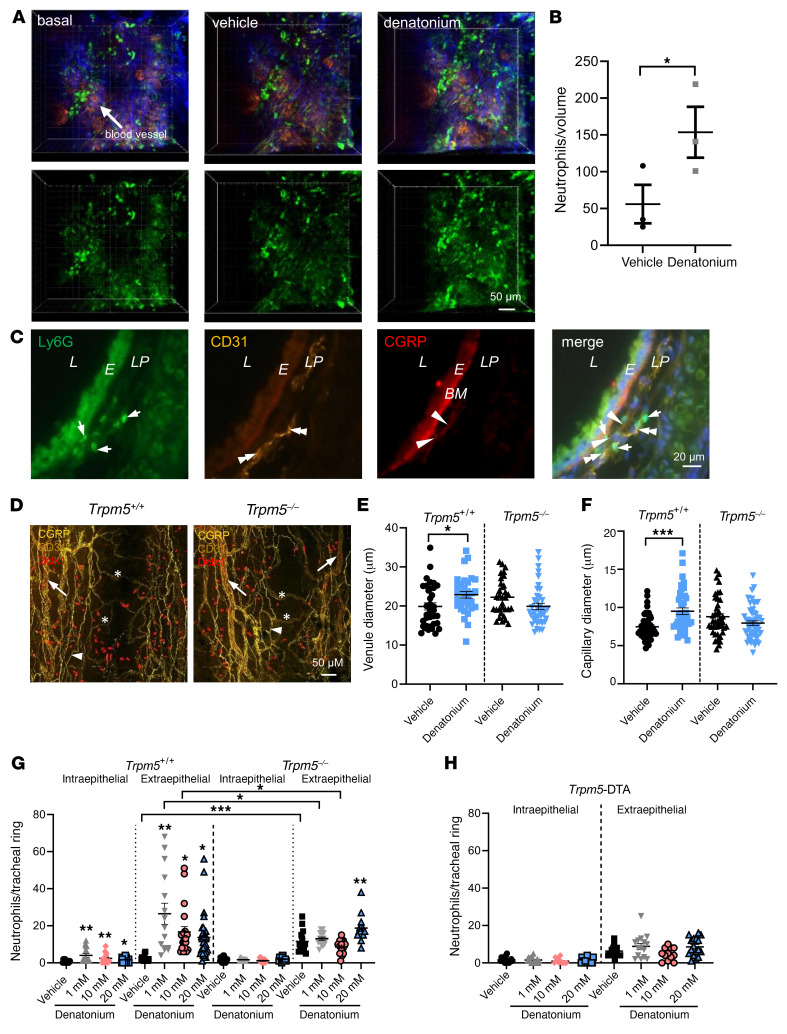
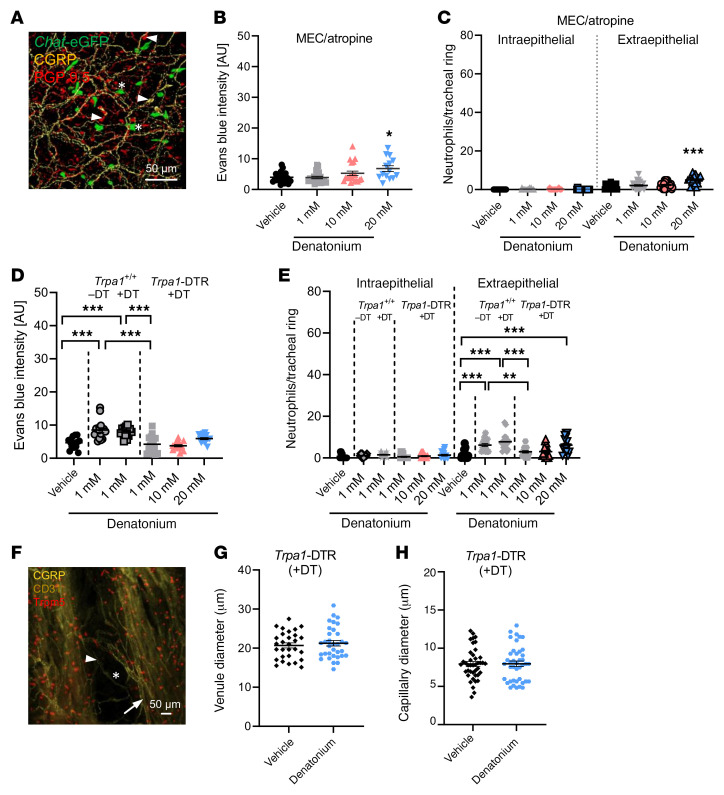
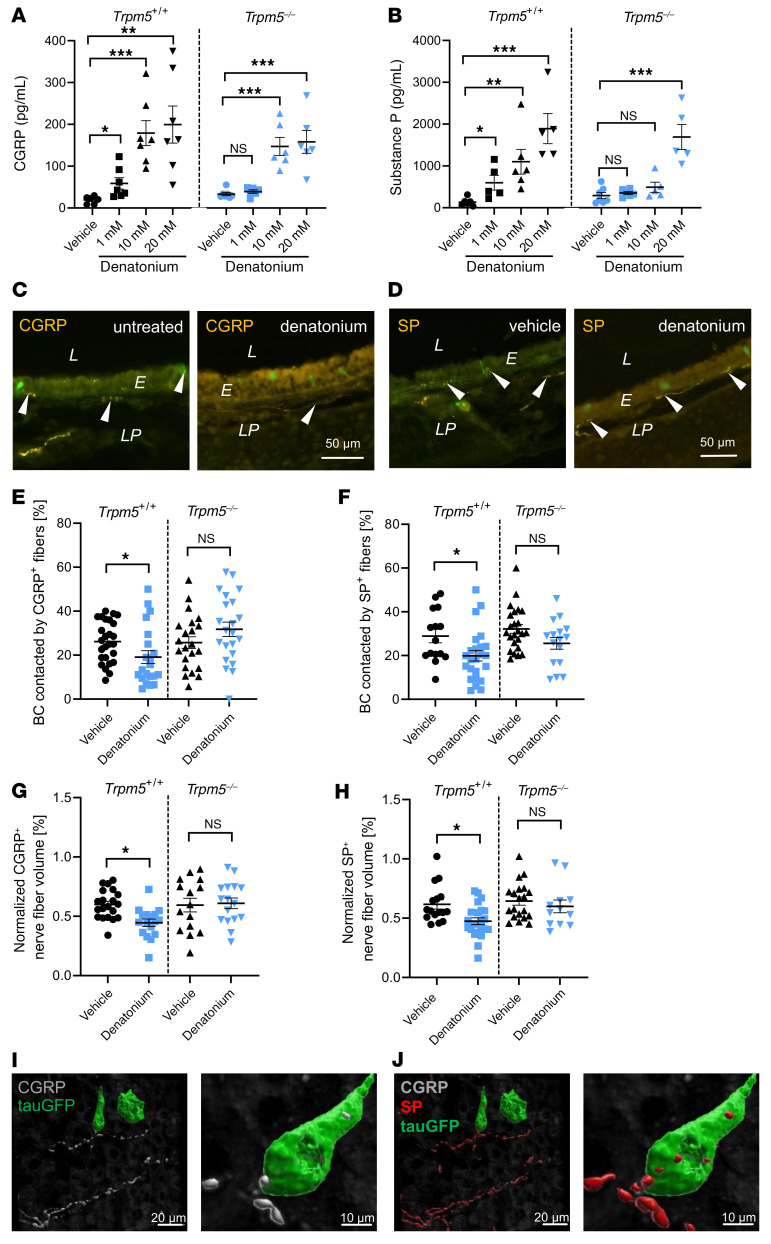
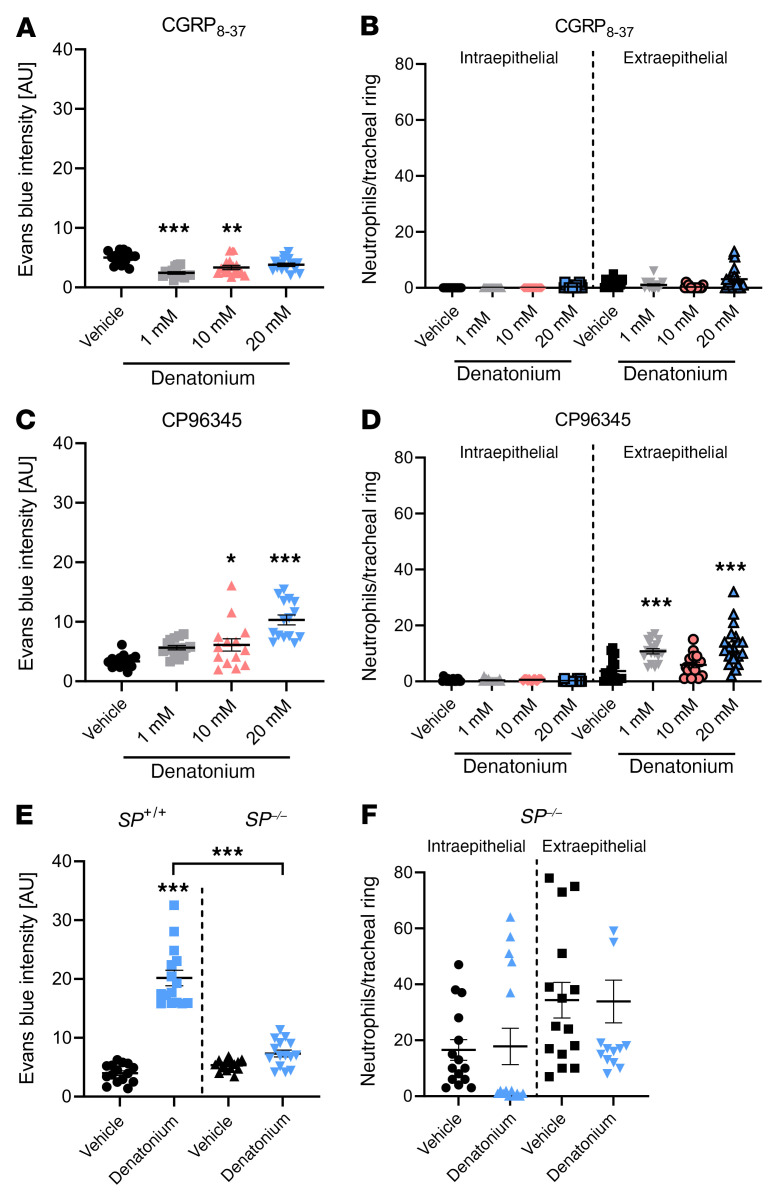
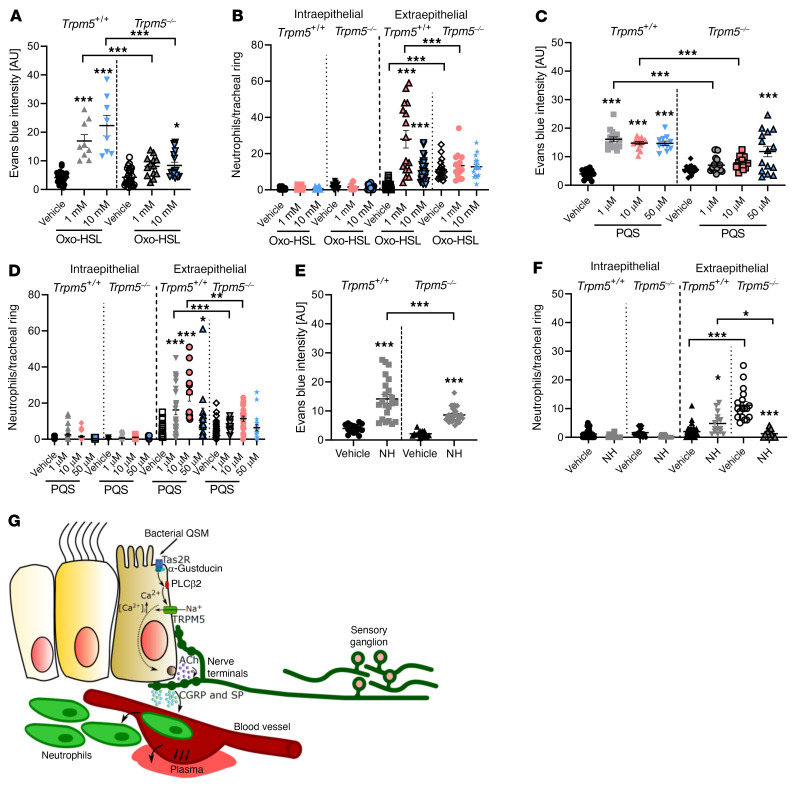
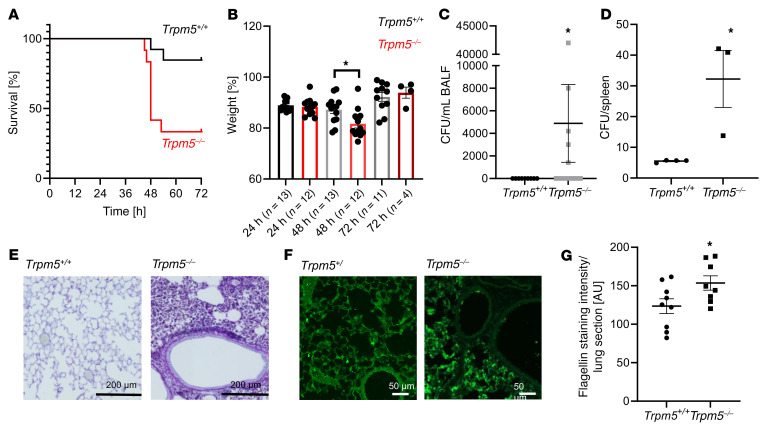
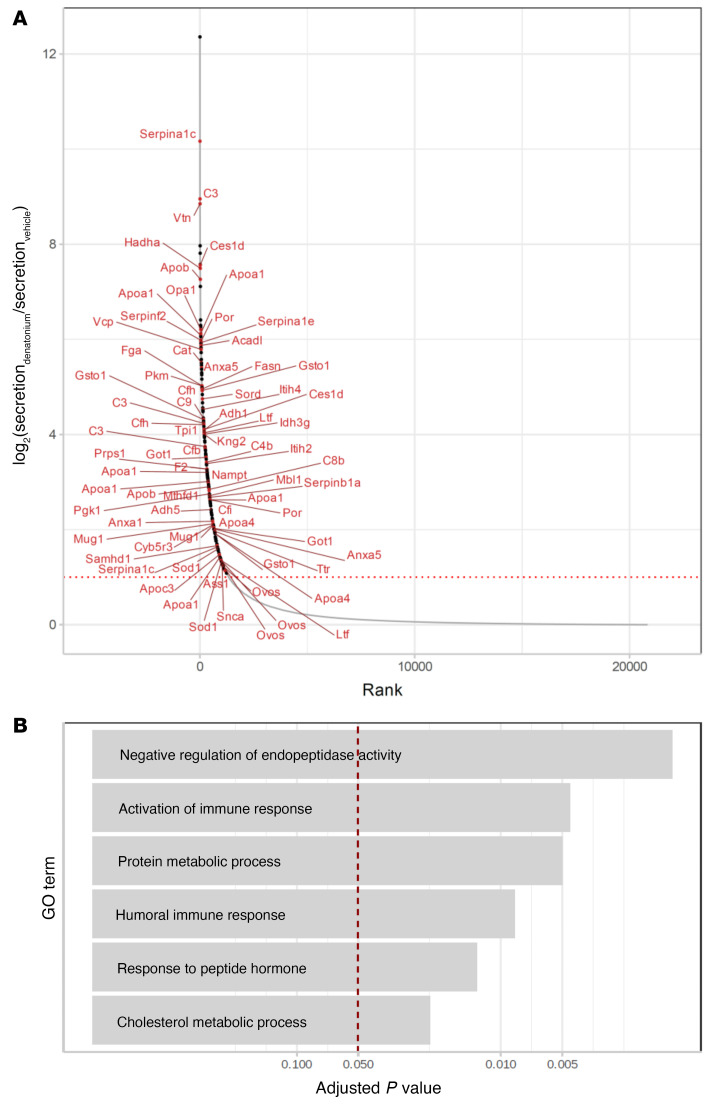
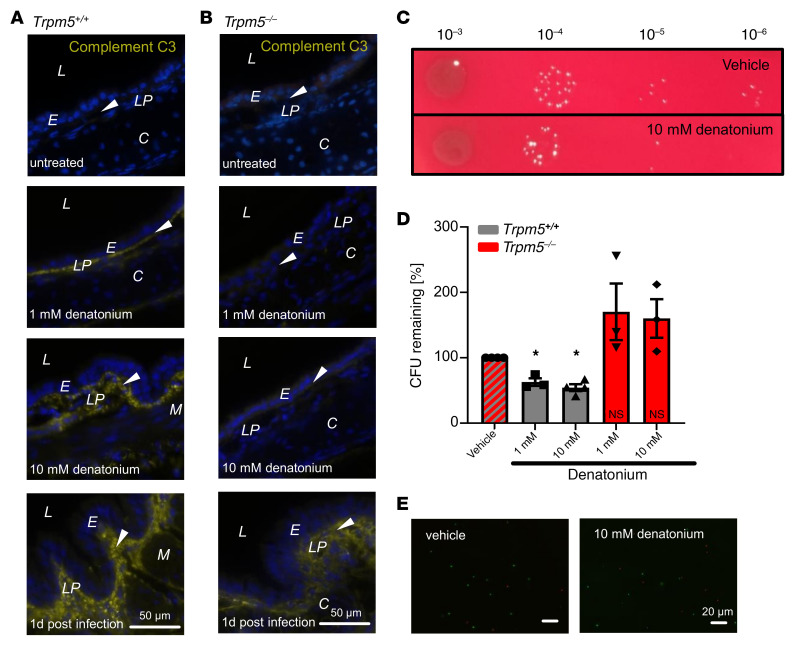
Constant exposure of the airways to inhaled pathogens requires efficient early immune responses protecting against infections. How bacteria on the epithelial surface are detected and first-line protective mechanisms are initiated are not well understood. We have recently shown that tracheal brush cells (BCs) express functional taste receptors. Here we report that bitter taste signaling in murine BCs induces neurogenic inflammation. We demonstrate that BC signaling stimulates adjacent sensory nerve endings in the trachea to release the neuropeptides CGRP and substance P that mediate plasma extravasation, neutrophil recruitment, and diapedesis. Moreover, we show that bitter tasting quorum-sensing molecules from Pseudomonas aeruginosa activate tracheal BCs. BC signaling depends on the key taste transduction gene Trpm5, triggers secretion of immune mediators, among them the most abundant member of the complement system, and is needed to combat P. aeruginosa infections. Our data provide functional insight into first-line defense mechanisms against bacterial infections of the lung.

Keywords: Immunology; Innate immunity; Pulmonology.


Figures

Figure 1
Figure 1. Measurements of intracellular calcium levels in Trpm5-GCaMP3 cells.
(A and B) Immunohistochemical staining of tracheal sections from a Trpm5-tauGFP (A and B) or Chat-eGFP (C and D) mouse using an antiserum against Trpm5. L, lumen; E, epithelium; LP, lamina propria. (E) Image of the trachea of a Trpm5-GCaMP3 mouse showing an increase in GCaMP3 fluorescence in individual Trpm5+ cells after denatonium application (20 mM). Scale bars: 50 μm (AD) and 20 μm (E). (F) Graphs showing Ca2+ transients of Trpm5+ tracheal cells from Trpm5-GCaMP3 mice responding to 1, 10, or 20 mM denatonium applied at 180 seconds (left, central, and right graph, respectively). Data shown as mean ± SEM of the normalized (F/F0) GCaMP3 fluorescence intensities. Red line shows the initial (start recording, t = 0, F/F0 = 1) level of the normalized intensities. n cells = 23 from 3 mice. (G) Representative curve for the Ca2+ response of a Trpm5+ cell stimulated with 1 mM N-(3-oxododecanoyl)-L-homoserine lactone (Oxo). Images of the Trpm5+ cell show GCaMP3 baseline fluorescence and fluorescence after stimulation. (H) Oxo (1 mM) led to a significant transient increase in [Ca2+]i in Trpm5+ cells from Trpm5-GCaMP3 mouse tracheae. Data shown as single values and mean ± SEM of the normalized (F/F0) GCaMP3 fluorescence intensities (n cells = 10 from 3 mice). **P < 0.01 by 2-tailed, unpaired Student’s t test. (I) Representative curve for the Ca2+ response of Trpm5+ cells to 1, 10, or 50 μM Pseudomonas aeruginosa quinolone signal (PQS) (1 μM: n cells = 28 from 3 tracheal pieces; 10 μM: n cells = 30 from 3 tracheal pieces; 50 μM: n cells = 40 from 4 tracheal pieces).
Figure 2
Figure 2. Evans blue (EB) extravasation in response to denatonium.
(A) Explanted tracheae (left) and aortae (right) from mice treated with vehicle control (PBS) or denatonium (den) show blue color due to EB extravasation in the trachea after denatonium treatment. EB is absent in the aorta. (B) CD31 staining with EB fluorescence in murine tracheal sections after denatonium treatment. (C) Costaining against Trpm5 (BCs, arrowheads) and SP (sensory nerve endings) showing blood vessels (*) and nuclei (blue, DAPI). Scale bars: 20 μm (B) and 50 μm (C). (D) Images of tracheal rings showing EB fluorescence of animals treated with PBS (vehicle), 1, 10, or 20 mM denatonium in WT (Trpm5+/+) or Trpm5-knockout (Trpm5–/–) mice. (E) Quantification of EB extravasation in response to 1, 10, or 20 mM denatonium. (F) Quantification of EB extravasation in BC-depleted mice (Trpm5-DTA) in response to denatonium. In E and F, data are shown as single values and mean ± SEM (n = 12–20 rings from 3–4 mice). L, lumen; E, epithelium; LP, lamina propria; C, cartilage. *P < 0.05; **P < 0.01; ***P < 0.001 by 1-way ANOVA followed by Bonferroni’s multiple-comparison correction.
Figure 3
Figure 3. Denatonium evokes neutrophil recruitment and blood vessel dilation in the trachea.
(A and B) In vivo 2-photon microscopy of neutrophils and blood vessels in the trachea of Ly6G-GFP mice. (A) Denatonium-increased neutrophil (green) extravasation from blood vessels (red) (blue: second harmonic generation signal, collagen fibers) in WT mice compared to basal and vehicle-treated (HEPES-treated) controls. (B) Evaluation of the results in A (n = 3 mice). Volume: 300 × 300 × 60 μm. Denatonium: 20 mM. (C) Tracheae stained for Ly6G, CD31, and CGRP showed neutrophil recruitment (Ly6G, green) in proximity to blood vessels (CD31, yellow) and CGRP+ nerve endings (red) at the same site (merge). Evans blue bound to the basal membrane (BM, bright red). L, lumen; E, epithelium; LP, lamina propria. Merge: nuclei stained for DAPI (blue). (D) Whole-mount staining of tracheae from Trpm5+/+ and Trpm5–/– mice. BC: Dclk1 (red); blood vessels: CD31 (yellow), venules = arrows, capillaries = stars; nerves: CGRP (yellow, arrowheads). Scale bars: 50 μm (A and D) and 20 μm (C). (E and F) Quantification of the diameter of venules (E) and capillaries (F) (n = 32–53 vessels from 4 mice). (G and H) Analysis of neutrophils per tracheal ring in WT (Trpm5+/+) mice, Trpm5–/– mice, and BC-deficient Trpm5-DTA mice (n = 12–25 rings from 4–5 mice). In B and EH, data are shown as single values and mean ± SEM. *P < 0.05; **P < 0.01; ***P < 0.001 by 2-tailed, unpaired Student’s t test (B) or 1-way ANOVA followed by Bonferroni’s multiple-comparison correction (EH).
Figure 4
Figure 4. The denatonium-induced neurogenic inflammation is mediated via cholinergic signaling and sensory nerve activation.
(A) Nerve fibers (PGP9.5+: red) containing the neuropeptide CGRP (yellow) in Chat-eGFP mice (ChAT+ cells: green, stars). Arrowheads: neuroendocrine cells labelled for PGP9.5 and/or CGRP. Scale bar: 50 μm. (B) Quantification of Evans blue (EB) extravasation in response to 1, 10, or 20 mM denatonium in WT mice treated with the AChR antagonists mecamylamine (MEC) and atropine. (C) Analysis of neutrophil numbers per tracheal ring in WT mice treated with MEC and atropine. (D) Quantification of EB extravasation in response to 1, 10, or 20 mM denatonium in Trpa1-DTR mice treated with diphtheria toxin (DT) and in response to 1 mM denatonium in naive WT or DT-treated WT (Trpa1+/+) mice. (E) Analysis of neutrophil number per tracheal ring in response to 1, 10, or 20 mM denatonium in Trpa1-DTR mice treated with DT. Naive or DT-treated WT (Trpa1+/+) mice stimulated with 1 mM denatonium served as controls. (F) Staining of venules (arrows) and capillaries (stars) in tracheae from DT-treated Trpa1-DTR mice. BC: Trpm5 (red), blood vessels: CD31 (yellow), nerves: CGRP (yellow, arrowheads). Scale bar: 50 μm. (G and H) Quantification of the venule (G) and capillary diameter (H). n = 29–41 vessels from 4 mice. In BE, G, and H, data are shown as single values and mean ± SEM (n = 14–24 rings from 3–4 mice). *P < 0.05; **P < 0.01; ***P < 0.001 by 1-way ANOVA followed by Bonferroni’s multiple-comparison correction (BE) or 2-tailed, unpaired Student’s t test (G and H).
Figure 5
Figure 5. CGRP and SP trigger tracheal neurogenic inflammation in response to denatonium.
(A and B) CGRP and SP measurements in excised tracheae with and without denatonium stimulation in WT (Trpm5+/+) and Trpm5–/– mice (n = 5–7 samples from 6–10 mice). (C and D) Staining of CGRP+ (C) and SP+ (D) nerve fibers (arrowheads) in tracheal slices of control (vehicle) and denatonium-treated WT mice. L, lumen; E, epithelium; LP, lamina propria. Scale bars: 50 μm (C and D). (E and F) Quantification of contacts between BCs and CGRP+ (E) and SP+ (F) nerve endings in whole-mount preparations of tracheae treated with vehicle or 1 mM denatonium (n = 15–29 image stacks containing 16–77 contacts/sample from 8 mice). (G and H) Treatment of tracheae with 1 mM denatonium significantly reduced the CGRP+ (G) and the SP+ (H) nerve fiber volume (normalized to the total stack volume) in Trpm5+/+ but not in Trpm5–/– mice (n = 12–23 volumes from 4 mice). (I) 3D reconstruction of a whole-mount tracheal preparation immunofluorescence with Imaris software (see Supplemental Methods). BCs (GFP, green) are approached by CGRP+ nerves. (J) Nerve endings approaching BCs are CGRP+ and SP+. Scale bars: 20 μm (left images in I and J) and 10 μm (right images). In A, B, and EH, data are shown as single values ± SEM. *P < 0.05, **P < 0.01, ***P < 0.001 by 1-way ANOVA followed by Bonferroni’s multiple-comparison correction (A and B) or 2-tailed, unpaired Student’s t test (EH).
Figure 6
Figure 6. Denatonium-induced neurogenic inflammation is CGRP and SP dependent.
(A) Quantification of Evans blue (EB) intensity in response to 1, 10, or 20 mM denatonium in Trpm5+/+ mice after treatment with the CGRP receptor antagonist CGRP8–37. (B) Analysis of neutrophils per tracheal ring in Trpm5+/+ mice treated with CGRP8–37. (C) Evaluation of EB intensity in response to 1, 10, or 20 mM denatonium in Trpm5+/+ mice treated with the NK1-R inhibitor CP96345. (D) Analysis of neutrophils per tracheal ring in Trpm5+/+ mice treated with CP96345. (E) Evaluation of EB intensity in SP–/– and WT mice (SP+/+) stimulated with vehicle or denatonium (20 mM) revealed reduced EB extravasation in SP–/– mice in response to denatonium. (F) Analysis of neutrophils per tracheal ring in SP–/– mice. In AF, n = 14–20 tracheal rings of 3–4 mice. Data are shown as single values ± SEM. *P < 0.05, **P < 0.01, ***P < 0.001 by 1-way ANOVA followed by Bonferroni’s multiple-comparison correction.
Figure 7
Figure 7. Evans blue (EB) extravasation and neutrophil recruitment in response to bacterial QSMs or bacterial culture supernatants.
(A, C, and E) Quantification of EB intensity in response to the QSMs N-(3-oxododecanoyl)-L-homoserine lactone (Oxo-HSL) and Pseudomonas aeruginosa quinolone signal (PQS) as well as supernatants of the P. aeruginosa strain NH57388A (NH) in WT (Trpm5+/+) and Trpm5-deficient (Trpm5–/–) mice. (B, D and F) Analysis of intra- and extraepithelial neutrophils per tracheal ring in WT (Trpm5+/+) and Trpm5–/– mice. In AF, data are shown as single values ± SEM (n = 8–30 rings from 3–5 mice). *P < 0.05; **P < 0.01; ***P < 0.001 by 1-way ANOVA followed by Bonferroni’s multiple-comparison correction. (G) Proposed mechanism of induction of neurogenic inflammation after stimulation of the bitter signaling cascade in tracheal epithelial BCs with bitter or bacterial substances. Substances bind to bitter taste receptors, which activates α-gustducin, leading to Ca2+ release from intracellular stores that activates Trpm5 and ACh release from BCs. The released ACh then binds to ACh receptors on sensory neurons, leading to plasma extravasation and neutrophil recruitment via CGRP and SP release and to neurogenic inflammation.
Figure 8
Figure 8. Infection of mice with the P. aeruginosa strain NH57388A.
(A) Survival rate of WT (Trpm5+/+) and Trpm5-deficient (Trpm5–/–) mice revealed decreased survival rates in Trpm5–/– mice after infection with P. aeruginosa NH57388A in the first 72 hours (n = 12–13 mice). (B) Trpm5–/– mice showed significantly greater weight loss 48 hours after infection with P. aeruginosa NH57388A compared with WT controls. Note that the weight is shown only for the mice that survived. (C) Seventy-two hours after infection, an increased bacterial load (CFU) was detected only in bronchoalveolar lavage fluid (BALF) samples of Trpm5–/– mice (n = 9–12 mice). (D) Trpm5–/– mice had an increased bacterial load (CFU/mouse) in the spleen 2 days after infection (n = 3–4 mice). (E) Representative images of gram staining of WT and Trpm5–/– lung sections 3 days after infection revealed more bacterial cells and destruction of alveoli in Trpm5–/– animals. (F) Lung sections of WT and Trpm5–/– mice stained for P. aeruginosa (green) 3 days after infection showed more flagellin staining, indicative of a higher number of bacteria and biofilm formation in Trpm5–/– animals. Scale bars: 200 μm (E) and 50 μm (F). (G) Quantification of results in F (n = 8–9 mice). In BD and G, data are depicted as mean ± SEM. *P < 0.05 by 2-tailed, unpaired Student’s t test.
Figure 9
Figure 9. Characterization of the inflammatory response of mice infected with the P. aeruginosa strain NH57388A.
(A) FACS analysis of neutrophils in Trpm5+/+ and Trpm5–/– mouse tracheae 4 hours after infection (triangles) and in controls (circles). (BD) FACS analysis of neutrophils, monocytes, and natural killer (NK) cells in bronchoalveolar lavage fluid (BALF) of Trpm5+/+ and Trpm5–/– mice infected with P. aeruginosa NH57388A for 4 hours (triangles) and healthy controls (circles). (EG) FACS analysis of neutrophils, monocytes, and alveolar macrophages of homogenized lungs of Trpm5+/+ and Trpm5–/– mice infected with P. aeruginosa NH57388A for 4 hours (triangles) and healthy controls (circles). (HJ) Multiplex ELISA of the cytokines IL-1α, G-CSF, and KC in plasma samples of mice before (circles) and after infection (triangles) with P. aeruginosa NH57388A for 4 hours. (K) ELISA of IL-5 of BALF of Trpm5+/+ and Trpm5–/– mice 4 hours after infection. In AK, data are depicted as mean ± SEM (n = 3–14 samples). *P < 0.05; **P < 0.01; ***P < 0.001 by 1-way ANOVA followed by Bonferroni’s multiple-comparison correction.
Figure 10
Figure 10. Secretome/proteome analysis of tracheae stimulated with denatonium.
(A) Log2(fold change) of peptide enrichment in the supernatants (relative to their concentration in the tracheal cells) after denatonium treatment (y axis) and the corresponding rank (x axis; derived from Bayesian linear model, unadjusted, n = 6). Large dots denote peptides with supernatant concentration after denatonium treatment significantly upregulated both absolutely (in comparison with their concentration in the supernatants of vehicle-treated cells) and relative to their cellular concentration (FDR-corrected P value ≤ 0.05, log2[fold change] ≥ 1 in both tests). Peptides belonging to the biological processes shown in B are drawn in red and labeled by the names of their genes. (B) Gene Ontology Biological Processes significantly enriched (FDR-corrected Fisher exact test P value ≤ 0.05) among the peptides upregulated by denatonium treatment.
Figure 11
Figure 11. BC activation with denatonium induces an increase in the complement component C3 and reduces growth of P. aeruginosa strain NH57388A.
(A) Staining for the complement component C3 (yellow) in naive or denatonium-treated (1 or 10 mM) mouse tracheal sections of Trpm5+/+ mice or 1 day after infection with the P. aeruginosa strain NH57388A. (B) Staining for complement component C3 (yellow) in tracheal sections of naive denatonium-treated (1 or 10 mM) Trpm5–/– mice or 1 day after infection with NH57388A. Blue: DAPI; arrowheads: basal membrane. L, lumen; E, epithelium; LP, lamina propria; C, cartilage; M, muscle. (C) P. aeruginosa killing assay. P. aeruginosa colonies after 2-hour incubation with supernatant from tracheae treated either with vehicle (RPMI, upper) or 10 mM denatonium (lower). (D) CFU of bacteria treated with supernatants from tracheae of WT and Trpm5–/– mice after stimulation with 10 mM denatonium normalized to CFU of bacteria after RPMI (vehicle) treatment. Bars indicate the mean ± SEM with single values of n = 3–4 independent experiments. Data were analyzed with 1-way ANOVA followed by Bonferroni’s multiple-comparison correction. (E) Syto9/propidium iodide staining (see Supplemental Methods) of P. aeruginosa after incubation with supernatants from WT tracheae treated either with RPMI (vehicle, left) or 10 mM denatonium (right). Scale bars: 50 μm (A and B) and 20 μm (E).

Comment in

References

    1. Krasteva G, et al. Cholinergic chemosensory cells in the trachea regulate breathing. Proc Natl Acad Sci U S A. 2011;108(23):9478–9483. doi: 10.1073/pnas.1019418108. - DOI - PMC - PubMed
    1. Hollenhorst MI, et al. Tracheal brush cells release acetylcholine in response to bitter tastants for paracrine and autocrine signaling. FASEB J. 2020;34(1):316–332. doi: 10.1096/fj.201901314RR. - DOI - PubMed
    1. Kaske S, et al. TRPM5, a taste-signaling transient receptor potential ion-channel, is a ubiquitous signaling component in chemosensory cells. BMC Neurosci. 2007;8(1):49. doi: 10.1186/1471-2202-8-49. - DOI - PMC - PubMed
    1. Hofmann T, et al. TRPM5 is a voltage-modulated and Ca2+-activated monovalent selective cation channel thomas. Curr Biol. 2003;13(13):1153–1158. doi: 10.1016/S0960-9822(03)00431-7. - DOI - PubMed
    1. Saunders CJ, et al. Cholinergic neurotransmission links solitary chemosensory cells to nasal inflammation. Proc Natl Acad Sci U S A. 2014;111(16):6075–6080. doi: 10.1073/pnas.1402251111. - DOI - PMC - PubMed

Publication types