. 2022 Jun 15;132(12):e150807.
doi: 10.1172/JCI150807.

CAR T cell manufacturing from naive/stem memory T lymphocytes enhances antitumor responses while curtailing cytokine release syndrome

Affiliations

CAR T cell manufacturing from naive/stem memory T lymphocytes enhances antitumor responses while curtailing cytokine release syndrome

Silvia Arcangeli et al. J Clin Invest. .

Abstract

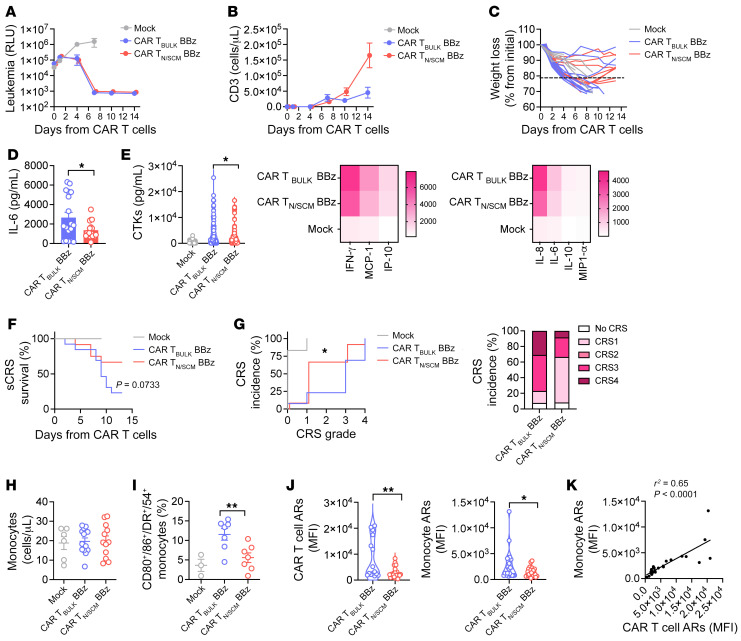
Chimeric antigen receptor (CAR) T cell expansion and persistence represent key factors to achieve complete responses and prevent relapses. These features are typical of early memory T cells, which can be highly enriched through optimized manufacturing protocols. Here, we investigated the efficacy and safety profiles of CAR T cell products generated from preselected naive/stem memory T cells (TN/SCM), as compared with unselected T cells (TBULK). Notwithstanding their reduced effector signature in vitro, limiting CAR TN/SCM doses showed superior antitumor activity and the unique ability to counteract leukemia rechallenge in hematopoietic stem/precursor cell-humanized mice, featuring increased expansion rates and persistence together with an ameliorated exhaustion and memory phenotype. Most relevantly, CAR TN/SCM proved to be intrinsically less prone to inducing severe cytokine release syndrome, independently of the costimulatory endodomain employed. This safer profile was associated with milder T cell activation, which translated into reduced monocyte activation and cytokine release. These data suggest that CAR TN/SCM are endowed with a wider therapeutic index compared with CAR TBULK.

Keywords: Cancer immunotherapy; Immunology; Immunotherapy; T cells; Therapeutics.


Figures

Figure 1
Figure 1. CAR TN/SCM display an indolent effector signature in vitro.
(A) Schematic representation of CAR T cell manufacturing. Briefly, double-positive CD62L+CD45RA+ TN/SCM cells were isolated by FACS and bulk unselected T cells (TBULK) were employed as control. TN/SCM and TBULK were activated with TransAct (anti-CD3/anti-CD28 [αCD3/28]), transduced with a lentiviral vector (LV) encoding a CD19.28z CAR, and expanded in culture with IL-7 and IL-15. (B) CD19.28z CAR expression (mean fluorescence intensity, MFI; n = 5), (C) TSCM enrichment (n = 16), (D) CD4+/CD8+ ratio (n = 20), and (E) HLA-DR expression (percentage of positive cells, n = 18) at the end of CAR T cell manufacturing. (F) Fold expansion at different days of culture (n = 12). (G) Degranulation assay performed by coculturing CAR TN/SCM, CAR TBULK, and Mock control with CD19+ targets for 24 hours (n = 14 donors challenged against NALM-6, BV173, and ALL-CM CD19+ target cell lines). (H) Killing activity expressed as elimination index (see Methods) and measured by coculturing CAR T cells with CD19+ tumor cells for 4 days at different effector/target (E:T) ratios (n = 15 for CAR TBULK, n = 14 for CAR TN/SCM against NALM-6 cell line; n = 7 for CAR TBULK, n = 6 for CAR TN/SCM against BV173 cell line; n = 8 for CAR TN/SCM, n = 9 for CAR TBULK against ALL-CM cell line). (I) Cytokine (CTK) production after 24-hour coculture of T cells with CD19+ tumor cells at a 1:10 E:T ratio (n = 5 donors challenged against NALM-6, BV173, and ALL-CM cell lines). (J) T cell proliferation after 4-day coculture with CD19+ tumor cells, measured by intracellular staining of Ki-67 (n = 15 donors challenged against NALM-6, BV173, and ALL-CM cell lines). Data are represented as mean ± SEM or mean ± SEM together with overlapping scattered values. *P < 0.05, **P < 0.01, ***P < 0.001, ****P < 0.0001 by paired t test (BE, G, and L) or 2-way ANOVA (F, H, and I).
Figure 2
Figure 2. CAR TN/SCM display superior antitumor activity and expansion in HuSGM3 mice.
(A) Schematic representation of the HSPC-humanized mouse model for efficacy testing. SGM3 mice were infused with HSPCs and, after hematopoietic reconstitution, injected with Lucia+NGFR+ NALM-6 leukemia cells and treated with low doses of CD28-costimulated CAR TN/SCM (n = 17), CAR TBULK (n = 17), or Mock control (n = 7). (B) NALM-6–derived bioluminescence signal measured at different time points after treatment and expressed as relative light units (RLU). (C) T cell expansion in the peripheral blood of NALM-6–bearing mice measured at different time points after treatment. (D) IFN-γ serum levels measured on day 4 after treatment and day 5 after NALM-6 rechallenge. (E) T cell memory phenotype of CAR TBULK and CAR TN/SCM on day 14 after treatment. Left panel: Dot plot of 2 representative mice (TSCM: CD45RA+CD62L+; TCM: CD45RACD62L+; TEM: CD45RACD62L; TEMRA: CD45RA+CD62L). Right panel: Frequency of TCM cells in mice from the 2 cohorts (analysis performed for n = 7 mice/group). (F and G) Evaluation of signs and symptoms typical of CRS development in HuSGM3 leukemia–bearing mice after treatment, represented by weight loss (F), serum levels of IL-6 (G, left), and murine serum amyloid A (SAA; G, right). Data are represented as mean ± SEM together with overlapping scattered values. ***P < 0.001; ****P < 0.0001 by 2-way ANOVA (BD and F) or unpaired t test (E and G).
Figure 3
Figure 3. CAR TN/SCM retain an enhanced in vivo fitness after leukemia encounter.
SGM3 mice were infused with HSPCs and, after hematopoietic reconstitution, injected with Lucia+NGFR+ NALM-6 leukemia cells and treated with low doses of CD28-costimulated CAR TN/SCM (n = 3) or CAR TBULK (n = 5) as described in Figure 2. (A) A median of approximately 74,000 CD3+ lymphocytes derived from the peripheral blood of both CAR TN/SCM– and CAR TBULK–treated mice on day 14 after treatment were interrogated by BH-SNE and K-means algorithms. Data were plotted according to BH-SNE1 and BH-SNE2 specifically calculated variables and the events were split into 2 density plots according to the CAR T cell population they belong to. (B) CAR TN/SCM and CAR TBULK specifically identified clusters after application of Flow-SOM algorithm to both BH-SNE1 and BH-SNE2 variables. CAR TN/SCM– and CAR TBULK–specific clusters described in terms of (C) T cell memory subset composition, together with (D) expression of inhibitory and activation receptors (IRs and ARs). (E) Heatmap visualization of both inhibitory and activation receptors expressed by CAR TN/SCM– and CAR TBULK–specific metaclusters, in which mean fluorescence intensity (MFI) levels were normalized on the basis of the maximum expressed value of each analyzed parameter in the whole examined sample.
Figure 4
Figure 4. CAR TN/SCM are less prone to induce severe CRS.
(A) SGM3 mice were infused with HSPCs and, after hematopoietic reconstitution (HuSGM3), injected with Lucia+NGFR+ NALM-6 leukemia cells. When a high tumor burden was reached, mice were treated with high doses of CD28-costimulated CAR TN/SCM (n = 9), CAR TBULK (n = 9), or Mock control (n = 6). (B) NALM-6–derived bioluminescence signal measured at different time points after treatment and expressed as relative light units (RLU). (C) T cell expansion in the peripheral blood of mice, (D) weight loss evaluation, and (E) IL-6 serum levels at different time points after treatment. (F) Serum amyloid A (SAA) levels 24 hours after T cell infusion (n = 6 for CAR TBULK, n = 6 for CAR TN/SCM, n = 3 for Mock). (G) Peak serum cytokine (CTK) levels and (H) heatmap visualization of peak serum cytokine levels on day 4 after treatment. Data are represented as the mean ± SEM and values are scaled according to a graded-color range depending on relative minimum and maximum levels. (I) Severe CRS–related (sCRS-related) Kaplan-Meier survival analysis of mice. (J) CRS grading. Left panel: Kaplan-Meier curves. Right panel: Histograms summarizing CRS grading. Data are represented as mean ± SEM together with overlapping scattered values and box and violin plots. *P < 0.05, **P < 0.01, ***P < 0.001, ****P < 0.0001 by 2-way ANOVA (BE), unpaired t test (F and G), Mantel-Cox 2-sided log-rank test (I), or Gehan-Breslow-Wilcoxon test (J).
Figure 5
Figure 5. CAR TN/SCM are less toxic, independently of the costimulation provided.
Experiments were conducted as described in Figure 4A but with CAR T cells carrying the 4-1BB costimulatory domain. (A) NALM-6–derived bioluminescence signal measured at different time points after treatment and expressed as relative light units (RLU) (n = 13 for CAR TBULK, n = 12 for CAR TN/SCM, n = 6 for Mock). (B) T cell expansion in the peripheral blood of mice. (C) Weight loss evaluation at different time points after treatment. (D and E) IL-6 and other cytokine (CTK) serum levels, with their heatmap visualization, on day 4 after treatment (n = 18 for CAR TBULK, n = 19 for CAR TN/SCM, n = 6 for Mock). (F) Severe CRS–related (sCRS-related) Kaplan-Meier survival analysis of mice. (G) CRS grading. Left panel: Kaplan-Meier curves. Right panel: Histograms summarizing CRS grading. (H) Monocyte absolute number immediately before T cell infusion (n = 13 for CAR TBULK, n = 12 for CAR TN/SCM, n = 6 for Mock). (I) Percentage of activated monocytes coexpressing CD80, CD86, CD54, and HLA-DR activation receptor markers (ARs) 1 day after treatment (n = 7 for CAR TBULK and CAR TN/SCM, n = 3 for Mock). (J) Evaluation of AR upregulation on CAR T cells (CD54, CD86) and monocytes (CD54, CD86, CD163) expressed as MFI on day 1 after treatment (n = 11 for CD54 and n = 7 for CD86 evaluated on CAR TN/SCM, n = 9 for CD54 and n = 6 for CD86 evaluated on CAR TBULK, n = 6 for CD163 in the CAR TBULK cohort, n = 7 for CD163 in the CAR TN/SCM cohort). (K) Correlation between CAR T cell and monocyte activation statuses on day 1 after treatment. Data are represented as box and violin plots, mean ± SEM together with overlapping scattered values, or scaled according to a graded-color range depending on relative minimum and maximum levels, when referring to the heatmap. *P < 0.05, **P < 0.01 by 2-way ANOVA (AC), unpaired t test (D, E, and HJ), Mantel-Cox 2-sided log-rank test (F), or Gehan-Breslow-Wilcoxon test (G).
Figure 6
Figure 6. CAR TN/SCM better calibrate monocyte activation and cytokine production.
(A) Absolute number (a.n.) of CAR T cells coexpressing activation markers (CD25, CD69, HLA-DR) 24 hours after coculture with NALM-6 cells (CAR TBULK/CAR TN/SCM 28z n = 11, left; CAR TBULK/CAR TN/SCM BBz n = 8, right). (B) Schematic representation of tripartite cocultures consisting of NALM-6 leukemia cells, CAR T cells, and autologous monocytes. Untransduced TBULK (Mock) and TN/SCM (MockN/SCM) were used as controls. CTKs, cytokines. (C) IL-6 production (Mock n = 3; Mock N/SCM n = 3; CAR TBULK/CAR TN/SCM 28z n = 5, left; CAR TBULK/CAR TN/SCM BBz n = 4, right) and (D) heatmap visualization of cytokine release 24 hours after plating. P = 0.0319 for the comparison between CAR TBULK BBz and CAR TN/SCM BBz in D. (E and F) RNA sequencing analysis of monocytes retrieved from tripartite cocultures including 4-1BB–costimulated CAR T cells and analyzed by RNA sequencing. (E) Pre-ranked GSEA depicting the expression profile of monocytes employing the activation gene set GSE5099 (CAR TBULK n = 4, CAR TN/SCM n = 3). (F) Heatmap illustrating expression values (log2-transformed RPKM) of selected genes retrieved from different pathways in monocytes as inflammatory response, activation, and inflammasome complex. Percentage of (G) CD28- and (H) 41BB-costimulated CAR T cells expressing granzyme A, granzyme B, and perforin 24 hours after coculture with NALM-6 cells (CAR TBULK/CAR TN/SCM 28z n = 6/7, CAR TBULK/CAR TN/SCM BBz n = 5). Data are represented as mean ± SEM together with overlapping scattered values and box and violin plots. *P < 0.05; **P < 0.01 by paired t test (A, C, D, G, and H).
Figure 7
Figure 7. CAR TN/SCM can be generated from patients with B-ALL.
CD62L+CD45RA+ double-positive T cells from patients with B-ALL were isolated by FACS and bulk unselected T cells were employed as control. TN/SCM and TBULK were activated with TransAct, transduced with lentiviral vector encoding either a CD19.28z CAR or a CD19.BBz CAR, and expanded in culture with IL-7 and IL-15. (A) T cell fold expansion at the end of culture protocol (CAR TBULK/CAR TN/SCM 28z n = 3, CAR TBULK/CAR TN/SCM BBz n = 3). (B) TSCM enrichment, (C) CD8+ frequency, and (D) HLA-DR expression at the end of manufacturing. (E) T cell proliferation after a 4-day coculture with NALM-6 cells, measured by intracellular staining of Ki-67. (F) Killing activity expressed as elimination index (see Methods) and measured by coculturing CAR T cells with NALM-6, BV173, and ALL-CM CD19+ tumor cells for 4 days at a 1:20 effector/target (E:T) ratio (CAR TBULK/CAR TN/SCM 28z n = 9, CAR TBULK/CAR TN/SCM BBz n = 6). (G) Cytokine (CTK) production after 24-hour coculture of CAR T cells with CD19+ cell lines at a 1:10 E:T ratio. Full circles refer to CAR constructs carrying the CD28 costimulatory domain, while open circles refer to CAR constructs carrying 4-1BB. Data are represented as mean ± SEM together with overlapping scattered values. *P < 0.05 by paired t test.

References

    1. Maude SL, et al. Tisagenlecleucel in children and young adults with B-cell lymphoblastic leukemia. N Engl J Med. 2018;378(5):439–448. doi: 10.1056/NEJMoa1709866. - DOI - PMC - PubMed
    1. Park JH, et al. Long-term follow-up of CD19 CAR therapy in acute lymphoblastic leukemia. N Engl J Med. 2018;378(5):449–459. doi: 10.1056/NEJMoa1709919. - DOI - PMC - PubMed
    1. Porter DL, et al. Chimeric antigen receptor T cells persist and induce sustained remissions in relapsed refractory chronic lymphocytic leukemia. Sci Transl Med. 2015;7(303):303ra139. - PMC - PubMed
    1. Majzner RG, Mackall CL. Clinical lessons learned from the first leg of the CAR T cell journey. Nat Med. 2019;25(9):1341–1355. doi: 10.1038/s41591-019-0564-6. - DOI - PubMed
    1. Seimetz D, et al. Approval of first CAR-Ts: have we solved all hurdles for ATMPs? Cell Med. 2019;11:2155179018822781. - PMC - PubMed

Publication types