. 2022 Aug;20(8):1546-1560.
doi: 10.1111/pbi.13832. Epub 2022 May 17.

Function deficiency of GhOMT1 causes anthocyanidins over-accumulation and diversifies fibre colours in cotton (Gossypium hirsutum)

Affiliations

Function deficiency of GhOMT1 causes anthocyanidins over-accumulation and diversifies fibre colours in cotton (Gossypium hirsutum)

Liping Ke et al. Plant Biotechnol J. 2022 Aug.

Abstract

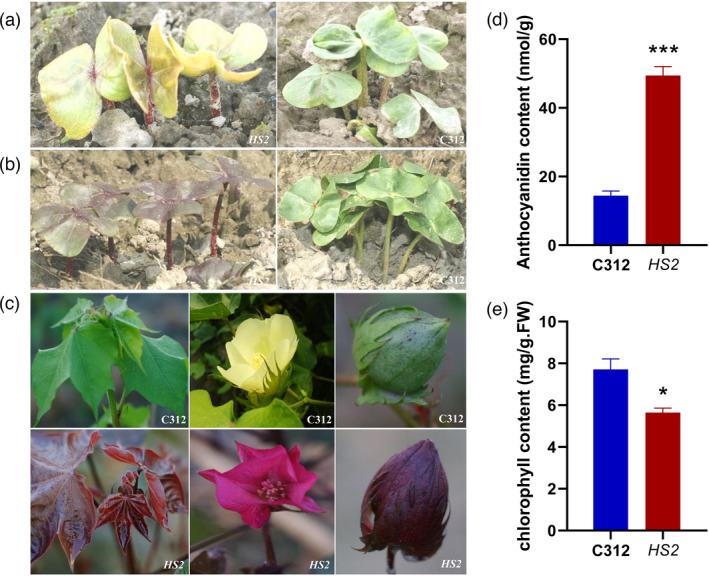
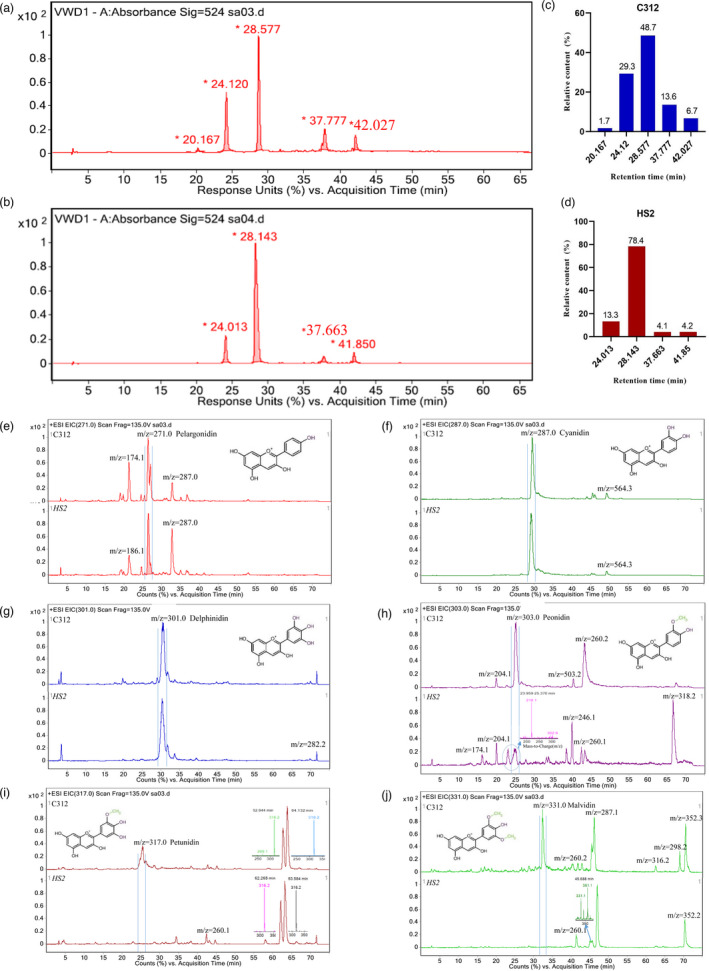
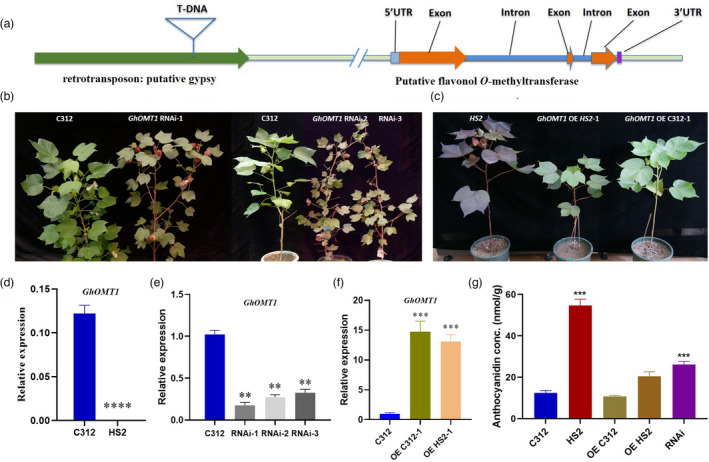
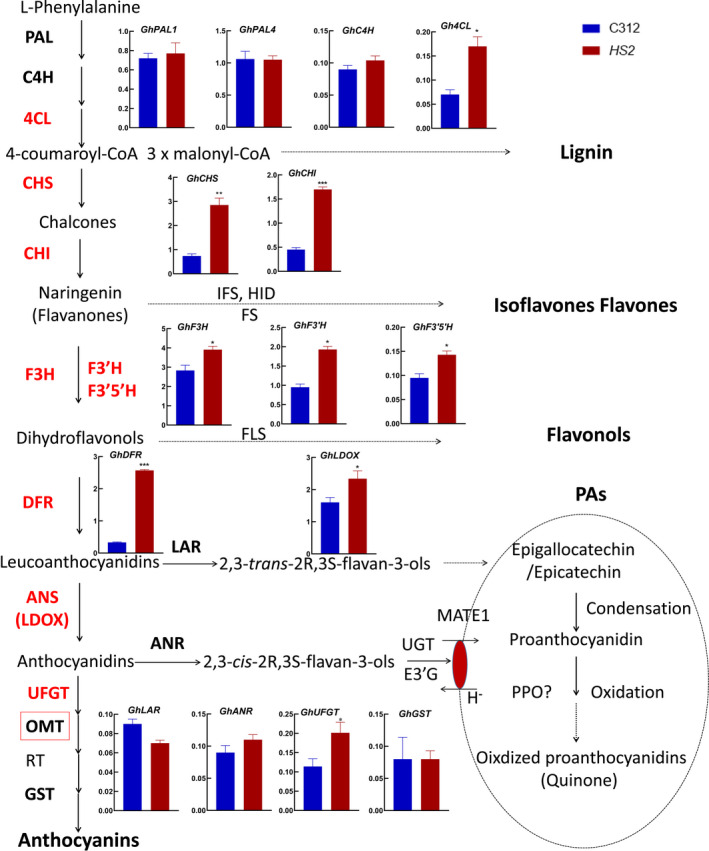
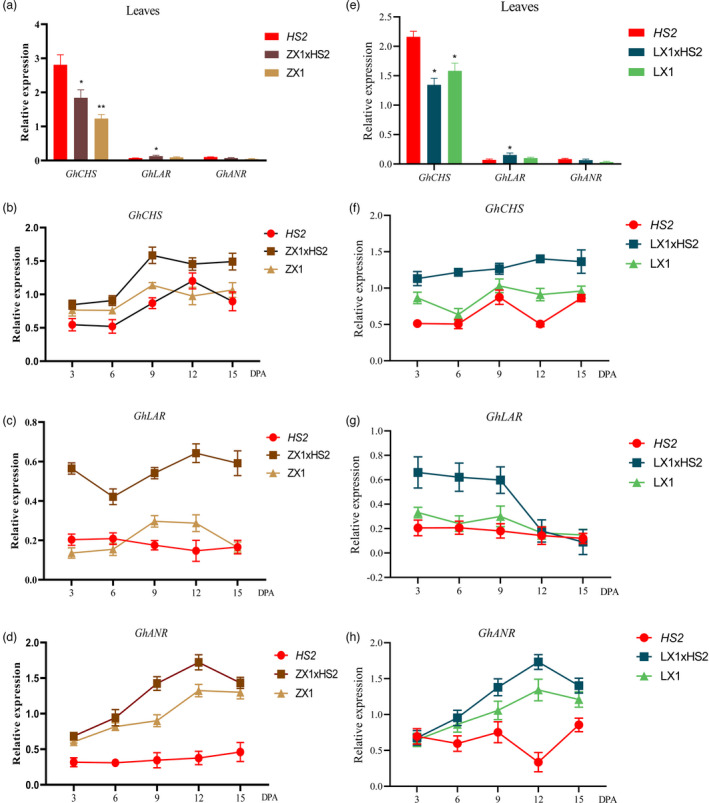
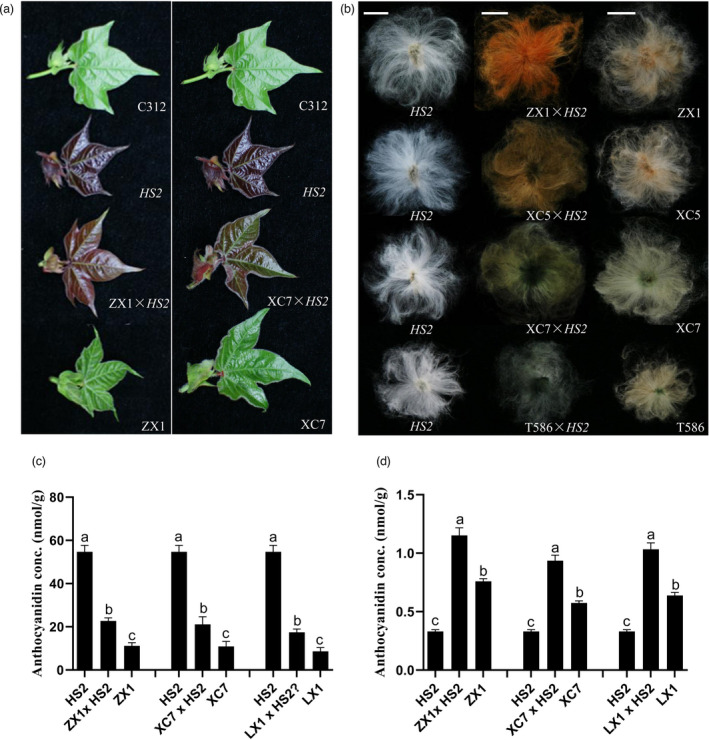
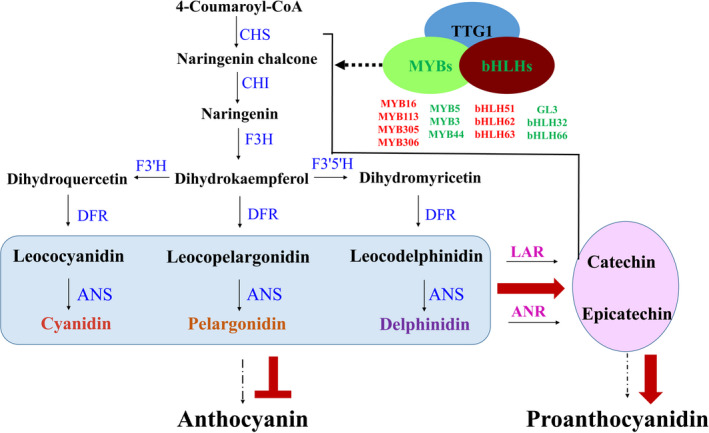
Naturally coloured cotton (NCC) fibres need little or no dyeing process in textile industry to low-carbon emission and are environment-friendly. Proanthocyanidins (PAs) and their derivatives were considered as the main components causing fibre coloration and made NCCs very popular and healthy, but the monotonous fibre colours greatly limit the wide application of NCCs. Here a G. hirsutum empurpled mutant (HS2) caused by T-DNA insertion is found to enhance the anthocyanidins biosynthesis and accumulate anthocyanidins in the whole plant. HPLC and LC/MS-ESI analysis confirmed the anthocyanidins methylation and peonidin, petunidin and malvidin formation are blocked. The deficiency of GhOMT1 in HS2 was associated with the activation of the anthocyanidin biosynthesis and the altered components of anthocyanidins. The transcripts of key genes in anthocyanidin biosynthesis pathway are significantly up-regulated in HS2, while transcripts of the genes for transport and decoration were at similar levels as in WT. To investigate the potential mechanism of GhOMT1 deficiency in cotton fibre coloration, HS2 mutant was crossed with NCCs. Surprisingly, offsprings of HS2 and NCCs enhanced PAs biosynthesis and increased PAs levels in their fibres from the accumulated anthocyanidins through up-regulated GhANR and GhLAR. As expected, multiple novel lines with improved fibre colours including orange red and navy blue were produced in their generations. Based on this work, a new strategy for breeding diversified NCCs was brought out by promoting PA biosynthesis. This work will help shed light on mechanisms of PA biosynthesis and bring out potential molecular breeding strategy to increase PA levels in NCCs.

Keywords: anthocyanidin methylation; fibre colour; flavonoid O-methyltransferase gene; naturally coloured cotton; proanthocyanidin biosynthesis.


Conflict of interest statement

No conflict of interest declared.

Figures

Figure 1
Figure 1
The phenotypes of empurpled mutant HS2 and the parental line C312. (a, b) Freshly germinated seedlings of HS2 (left) and C312 (right) at 8:00 a.m. (a) and 16:00 p.m. (b); (c) Coloured leaves, flowers and bolls of C312 (up) and HS2 (down) plants; (d) Anthocyanidins content in the leaves of C312 and HS2. (e) Chlorophyll contents in the leaves of C312 and HS2. (d, e: mean ± sd; n = 7; Student’s t‐test, *P < 0.05, ***P < 0.001).
Figure 2
Figure 2
Analysis of anthocyanidin gradients in C312 and HS2. (a, b) HPLC‐LC/MS chromatograms of anthocyanins in C312 (a) and HS2 (b); c, d. Statistics of the relative proportion of different anthocyanin components in C312 (c) and HS2 (d) respectively. (e–j) Six main anthocyanidins profiles in cotton leaves determined by LC/MS ESI positive ion scanning in C312 and HS2. (e) Pelargonidin ([M + H]+ = 271); (f) Cyanidin ([M + H]+ = 287); (g) Delphinidin ([M + H]+ = 301); (h) Peonidin ([M + H]+ = 303); (i) Petunidin ([M + H]+ = 317); (j) Malvidin ([M + H]+ = 331). Peaks marked with vertical lines indicate the specific anthocyanidin monomer in each picture.
Figure 3
Figure 3
T‐DNA insertion caused GhOMT1 deficiency and anthocyanidins accumulation. (a) A T‐DNA inserted in a putative gypsy retrotransposon upstream of GhOMT1 gene; (b) Phenotypes of GhOMT1 RNA interfered lines (GhOMT1 RNAi) and C312; (c) Phenotypes of GhOMT1 overexpressed lines. Left: HS2, Middle: GhOMT1 overexpressed in HS2 (GhOMT1‐OE HS2), Right: GhOMT1 overexpressed in C312 (GhOMT1‐OE C312); (d) The transcript level of GhOMT1 in leaves of C312 and HS2. (e) The transcript level of GhOMT1 in leaves of C312 and GhOMT1 RNAi lines. (f) The transcript level of GhOMT1 in leaves of GhOMT1 overexpressed line in C312 and HS2. (g) Anthocyanidin content in C312, HS2, GhOMT1 overexpressed and GhOMT1 RNAi lines. (d, e, f, g: mean ± sd; n = 7 (d), n = 3 (e), n = 5 (f), n = 5 (g); Student’s t‐test, **P < 0.01,***P < 0.001).
Figure 4
Figure 4
Expression analysis of genes involved in phenylpropanoid pathway, anthocyanins pathway and PA pathway in C312 and HS2. Main products and enzymes in phenylpropanoid pathway, anthocyanins pathway and PA pathway are shown in diagram. Genes that encode enzymes in bold were analysed by qRT‐PCR and the relative expression levels in C312 and HS2 were listed nearby. The relative genes of enzymes in red were significantly up‐regulated in HS2 while that in black did not show apparent changes. Significance analysis was performed by Student’s t‐test between C312 and HS2 (mean ± sd; n = 5; *P < 0.05, **P < 0.01).
Figure 5
Figure 5
The transcript levels of GhCHS, GhLAR and GhANR in HS2, ZX1, LX1 and their F4 lines. (a) The transcript levels of GhCHS, GhLAR and GhANR in leaves in HS2, ZX1 and their F4 lines; (b–d). The transcript levels of GhCHS (b), GhLAR (c) and GhANR (d) in developing fibres of HS2, ZX1 and F4 lines from ZX1×HS2; (e). The transcript levels of GhCHS, GhLAR and GhANR in leaves in HS2, LX1 and their F4 lines; (f–h). The transcript levels of GhCHS (f), GhLAR (g) and GhANR (h) in developing fibres of HS2, LX1 and F4 lines from LX1×HS2. DPA: Days Post‐Anthesis.
Figure 6
Figure 6
Leaf, fibre and anthocyanidin contents in HS2, NCCs and their F4 lines with fibre colour stably improved. (a) Leaves of C312, HS2, homozygous stable F4 lines derived from ZX1×HS2, XC7×HS2 and naturally coloured cotton (ZX1 and XC7); (b) Fibres of HS2, NCC and homozygous stable F4 lines (from left to right: HS2; F4 progenies from the crosses; NCCs ZX1, T586, XC5 or XC7). Hybrid crosses and their parent lines marked in the pictures. (c) Anthocyanidin content in leaves of HS2, NCC lines, and their stable fibre colour improved lines. (d) Anthocyanidin content in 20 DPA fibres of HS2, NCC lines, and their stable fibre colour improved lines. DPA: Days Post‐Anthesis. ‘a’ to ‘c’ indicate statistically significant differences between the anthocyanidin contents of the indicated seedlings, as determined by one‐way analysis of variance (ANOVA), followed by Tukey’s least significant difference (LSD) test (P < 0.05).
Figure 7
Figure 7
A comprehensive diagram to enhance PA levels. Flow chart of increasing proanthocyanidin levels in fibres by promoting biosynthesis of common substrates (leoanthocyanidins and anthocyanidins in blue box), enhancing activities of LAR and ANR to form flavan‐3‐ols and blocking anthocyanidin to form anthocyanins simultaneously, or regulating potential TFs to increase the total anthocyanidins and PAs. Red arrows indicated the direction to increase PA biosynthesis. The dotted arrows indicated some steps omitted. The up‐regulated TFs of MBW (MYB‐bHLH‐WDR) complexes in HS2 were labelled as red colour and down‐regulated TFs labelled as green colour (listed in Table S2).

References

    1. Abrahams, S. , Tanner, G.J. , Larkin, P.J. and Ashton, A.R. (2002) Identification and biochemical characterization of mutants in the proanthocyanidin pathway in Arabidopsis. Plant Physiol. 130, 561–576. - PMC - PubMed
    1. Akita, Y. , Kitamura, S. , Hase, Y. , Narumi, I. , Ishizaka, H. , Kondo, E. , Kameari, N. et al. (2011) Isolation and characterization of the fragrant cyclamen O‐methyltransferase involved in flower coloration. Planta, 234, 1127–1136. - PubMed
    1. Anders, S. , Pyl, P.T. and Huber, W. (2015) HTSeq–a Python framework to work with high‐throughput sequencing data. Bioinformatics, 31(2), 166–169. - PMC - PubMed
    1. Bassolino, L. , Zhang, Y. , Schoonbeek, H.J. , Kiferle, C. , Perata, P. and Martin, C. (2013) Accumulation of anthocyanins in tomato skin extends shelf life. New Phytol. 200, 650–655. - PubMed
    1. Berni, R. , Cai, G. , Hausman, J.‐F. and Guerriero, G. (2019) Plant fibers and phenolics: A review on their synthesis, analysis and combined use for biomaterials with new properties. Fibers, 7, 80.

Publication types