. 2022 May 9;57(9):1160-1176.e5.
doi: 10.1016/j.devcel.2022.04.004. Epub 2022 May 2.

Single-cell analysis of human testis aging and correlation with elevated body mass index

Affiliations

Single-cell analysis of human testis aging and correlation with elevated body mass index

Xichen Nie et al. Dev Cell. .

Abstract

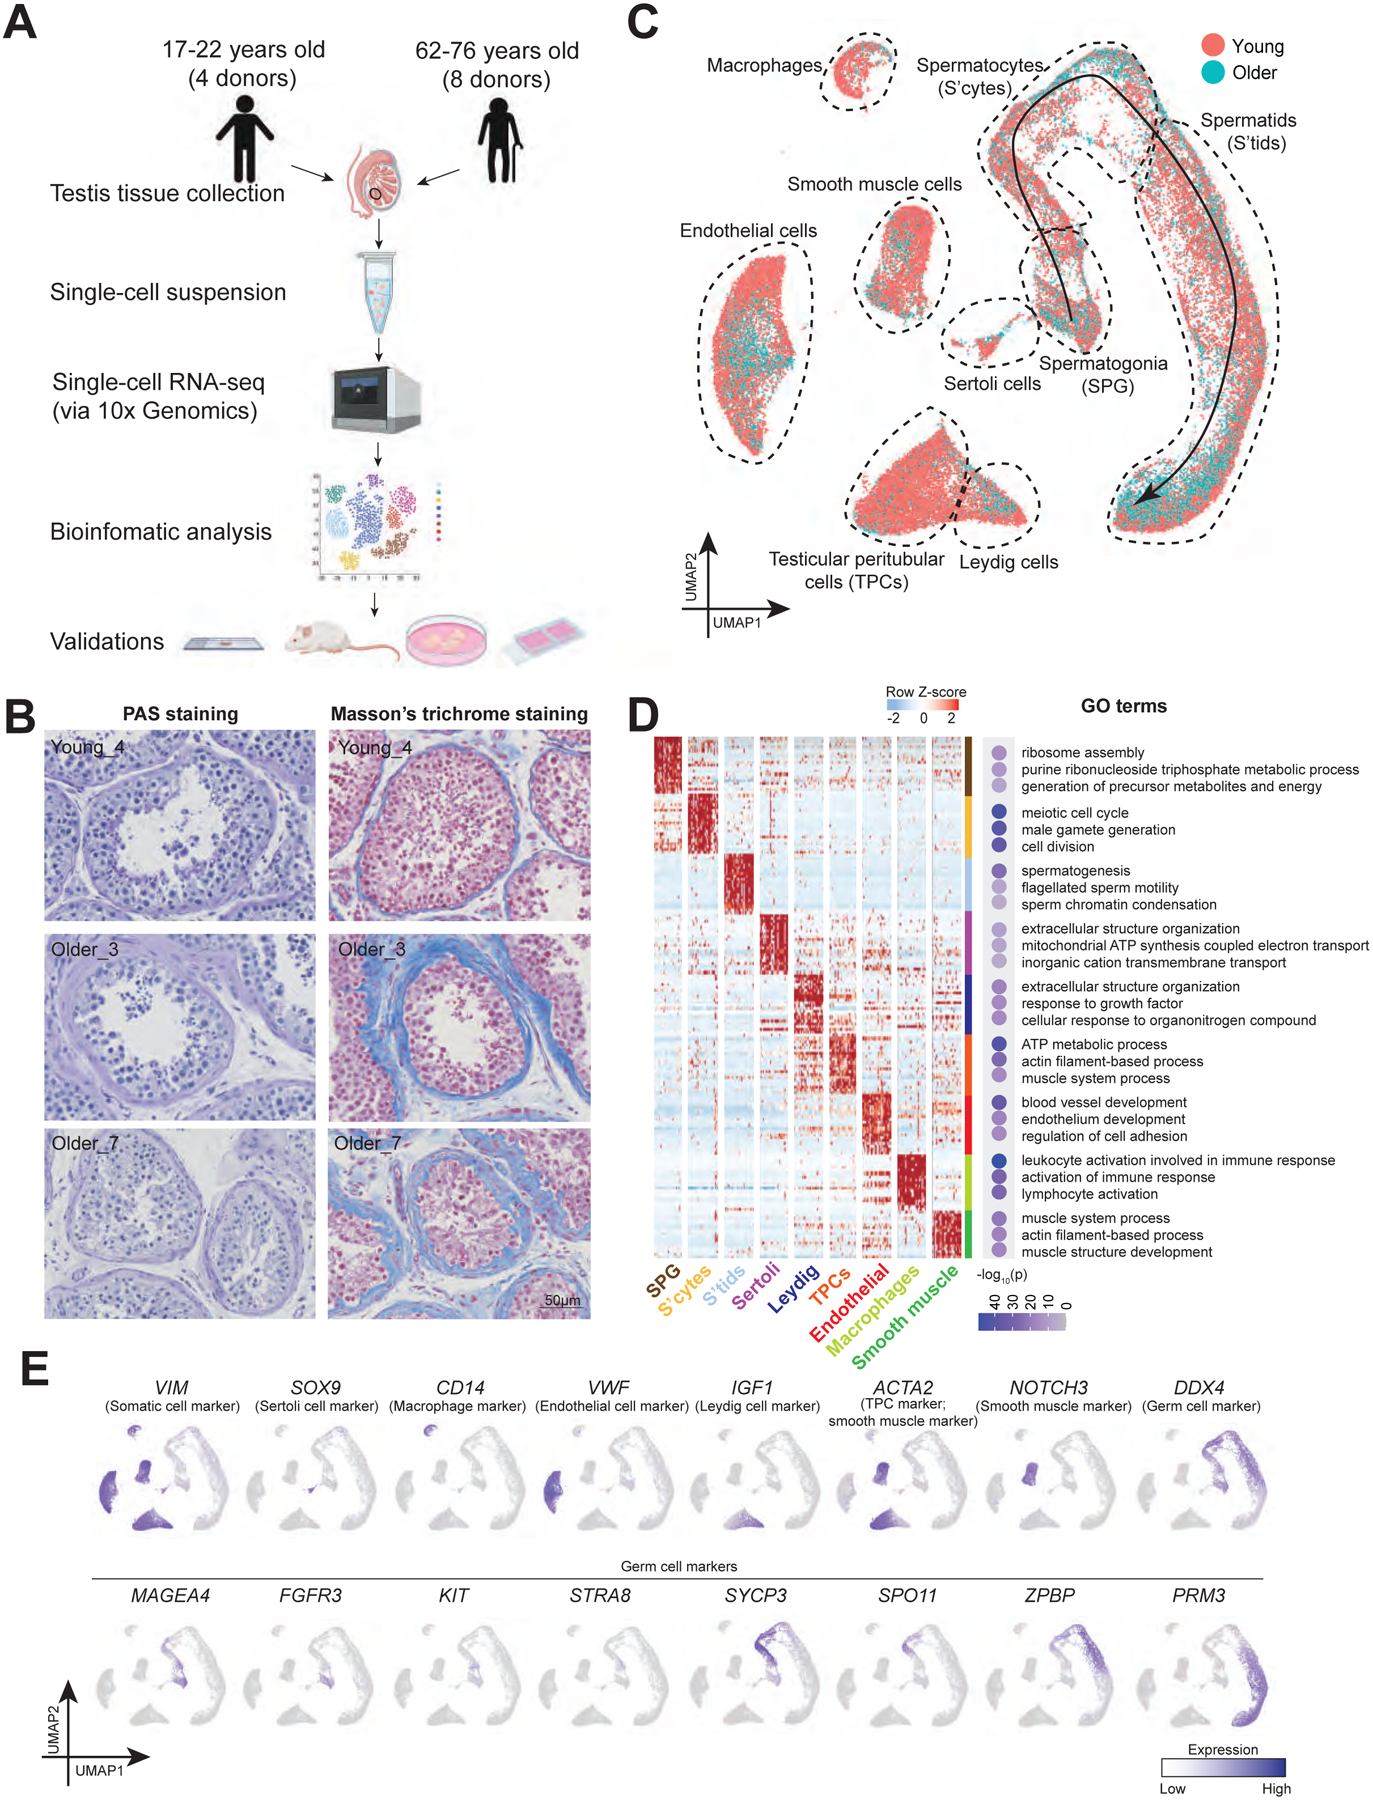
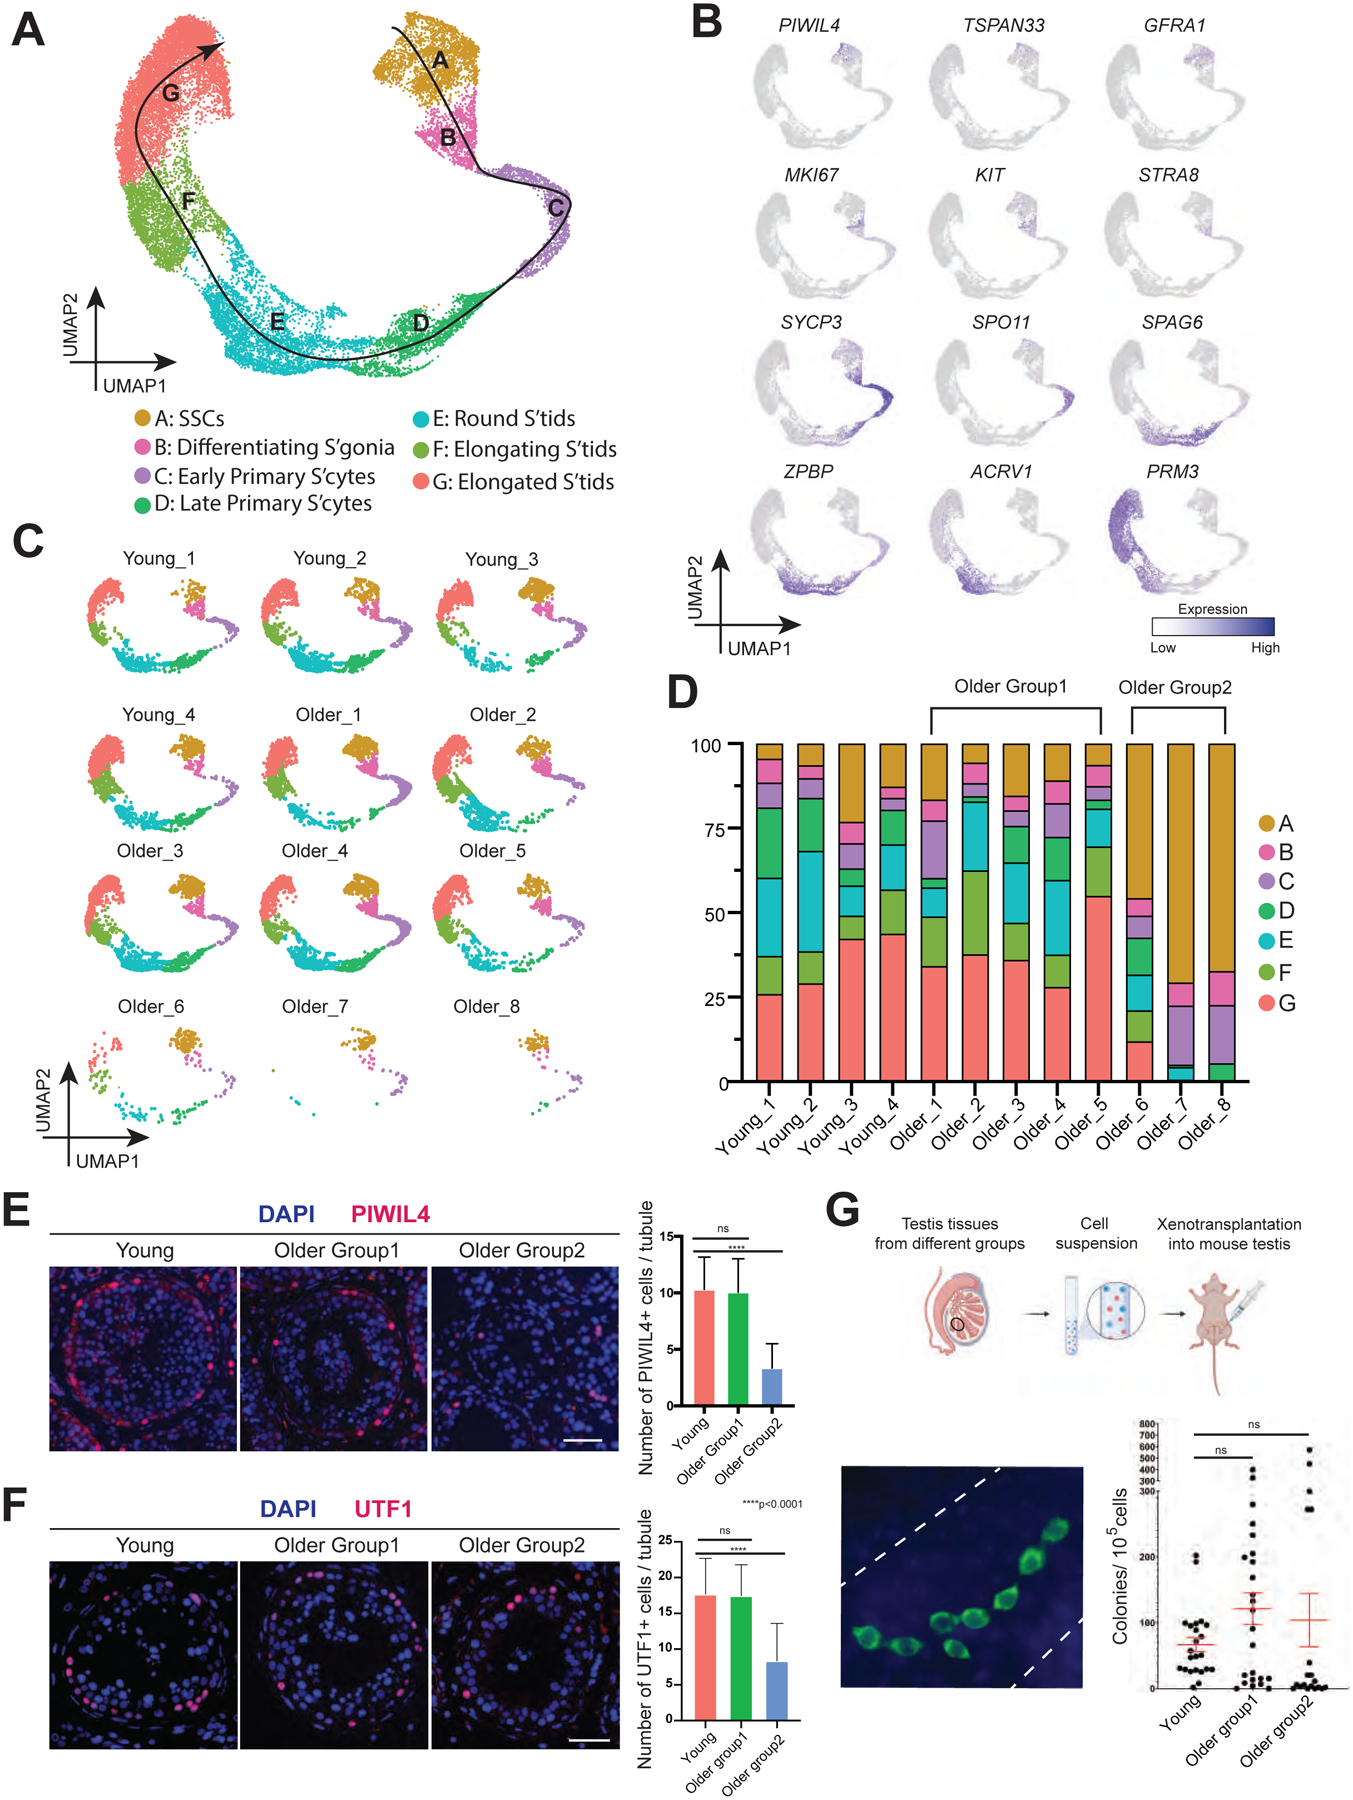
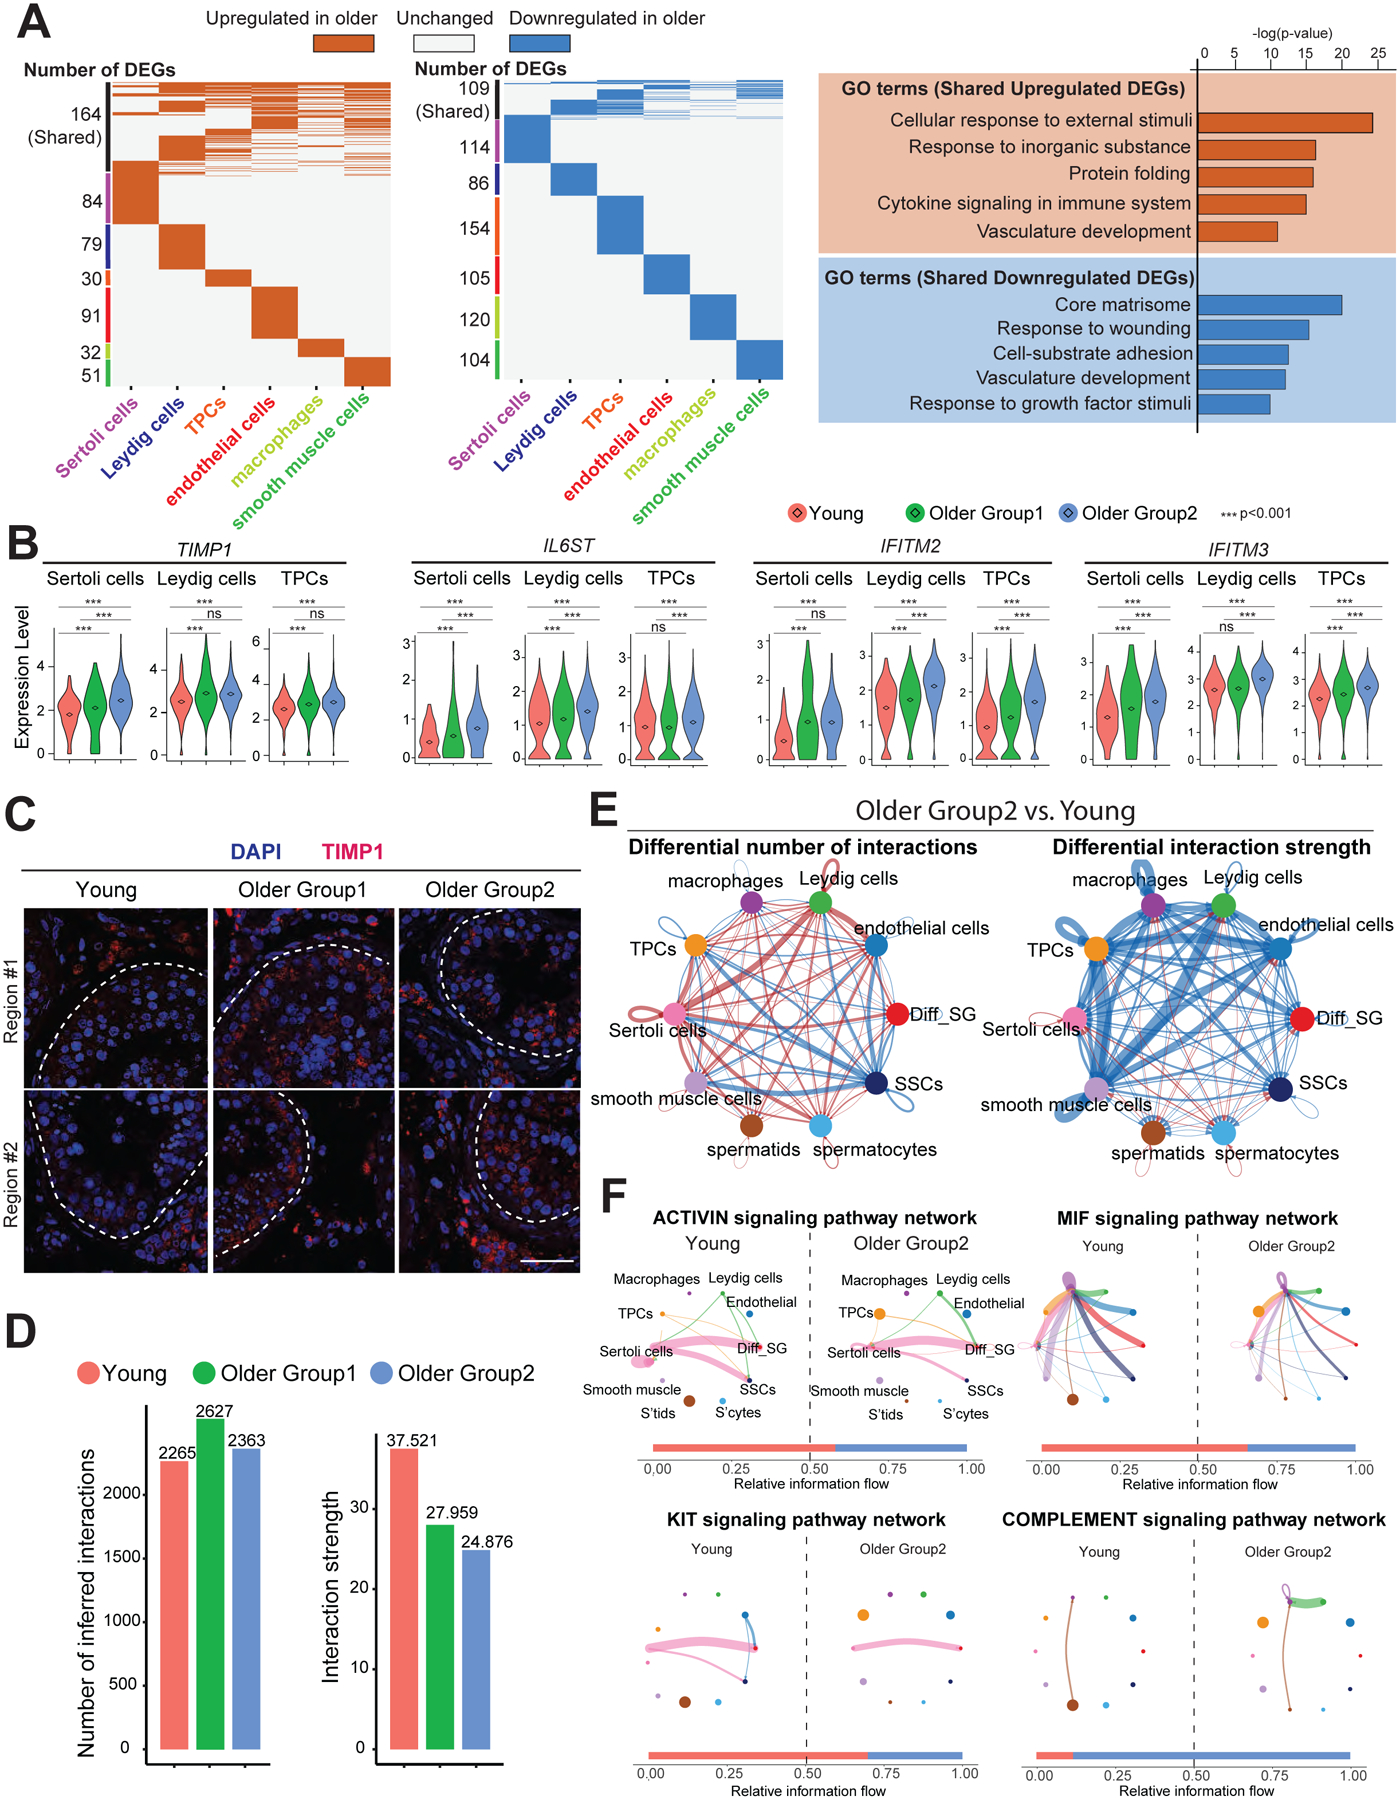
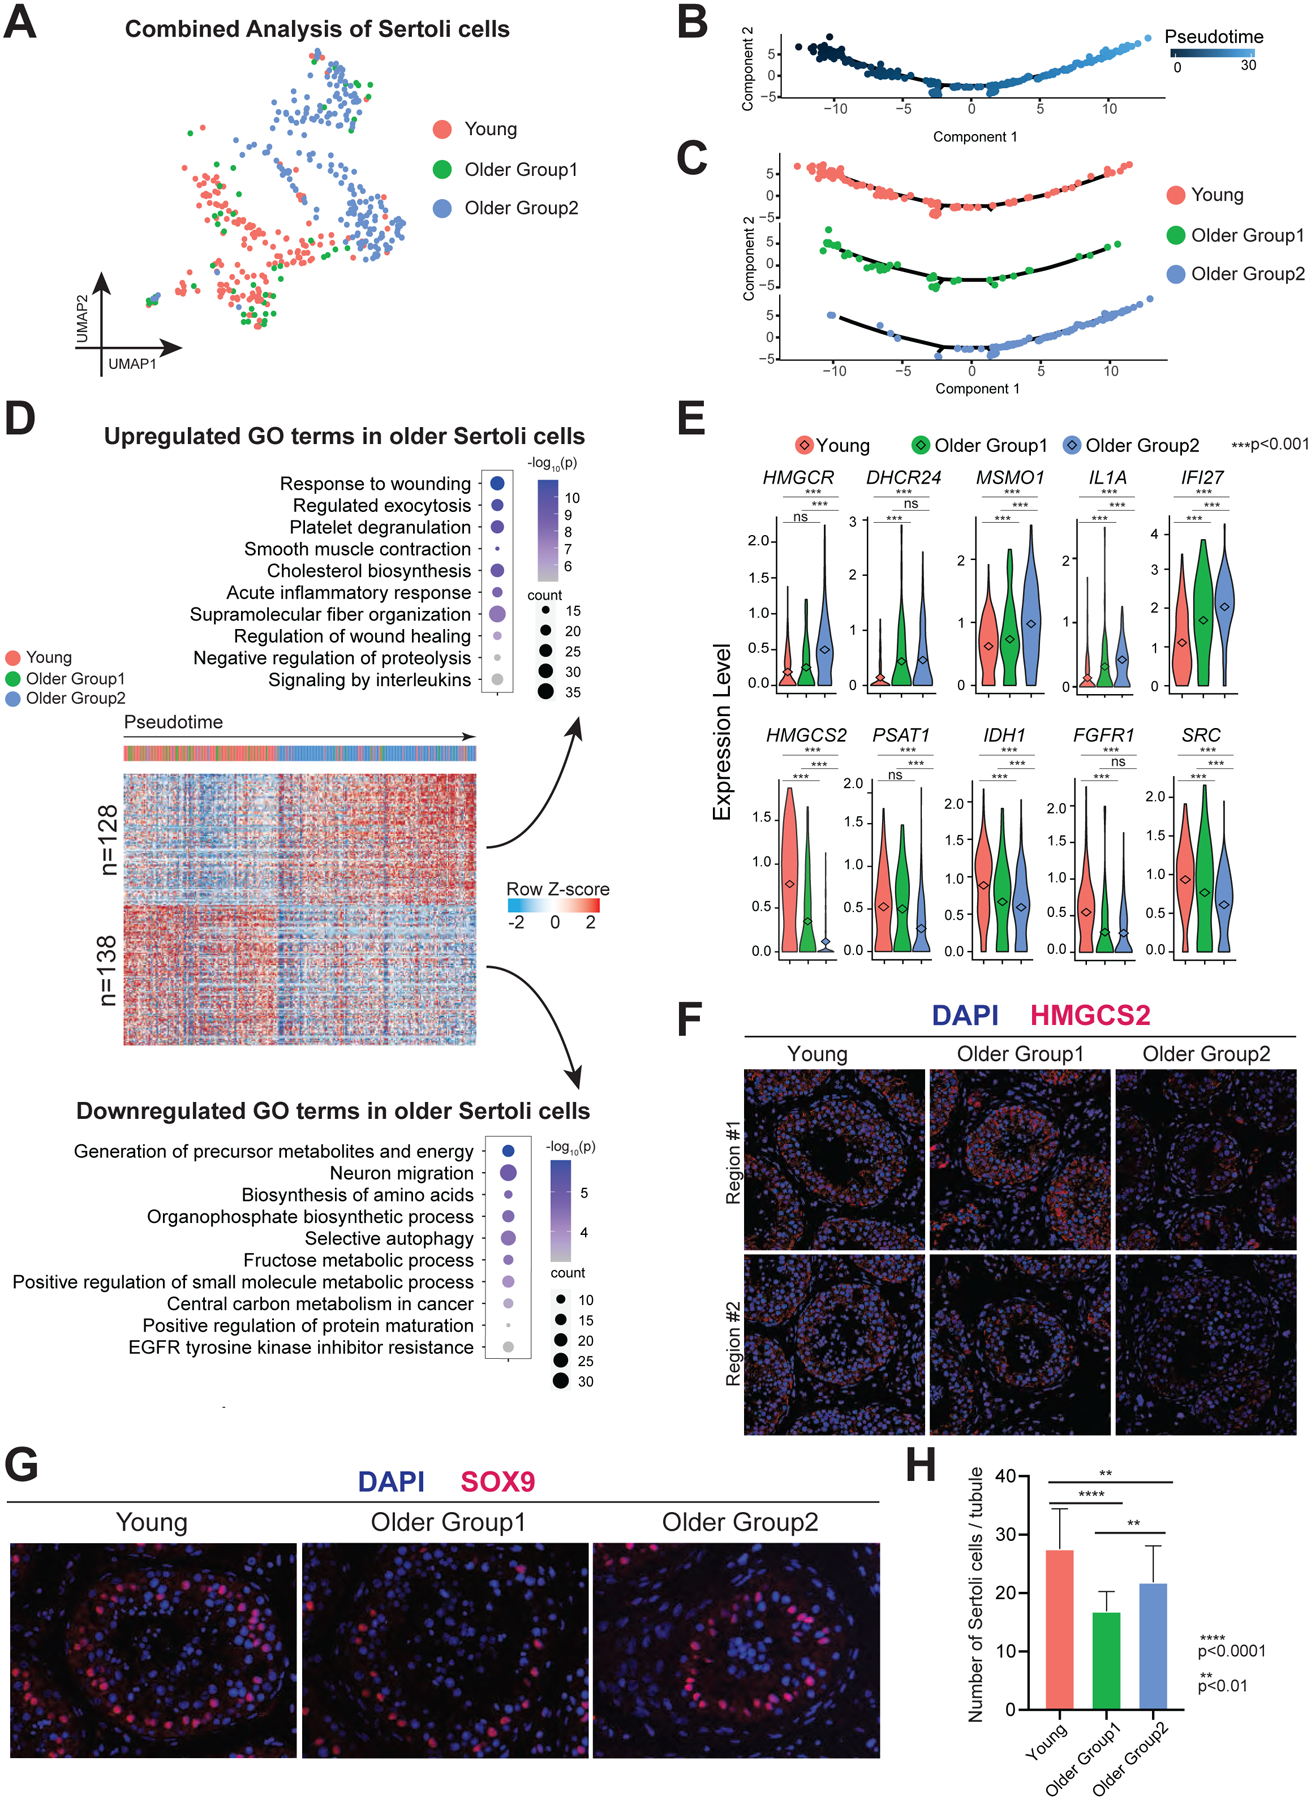
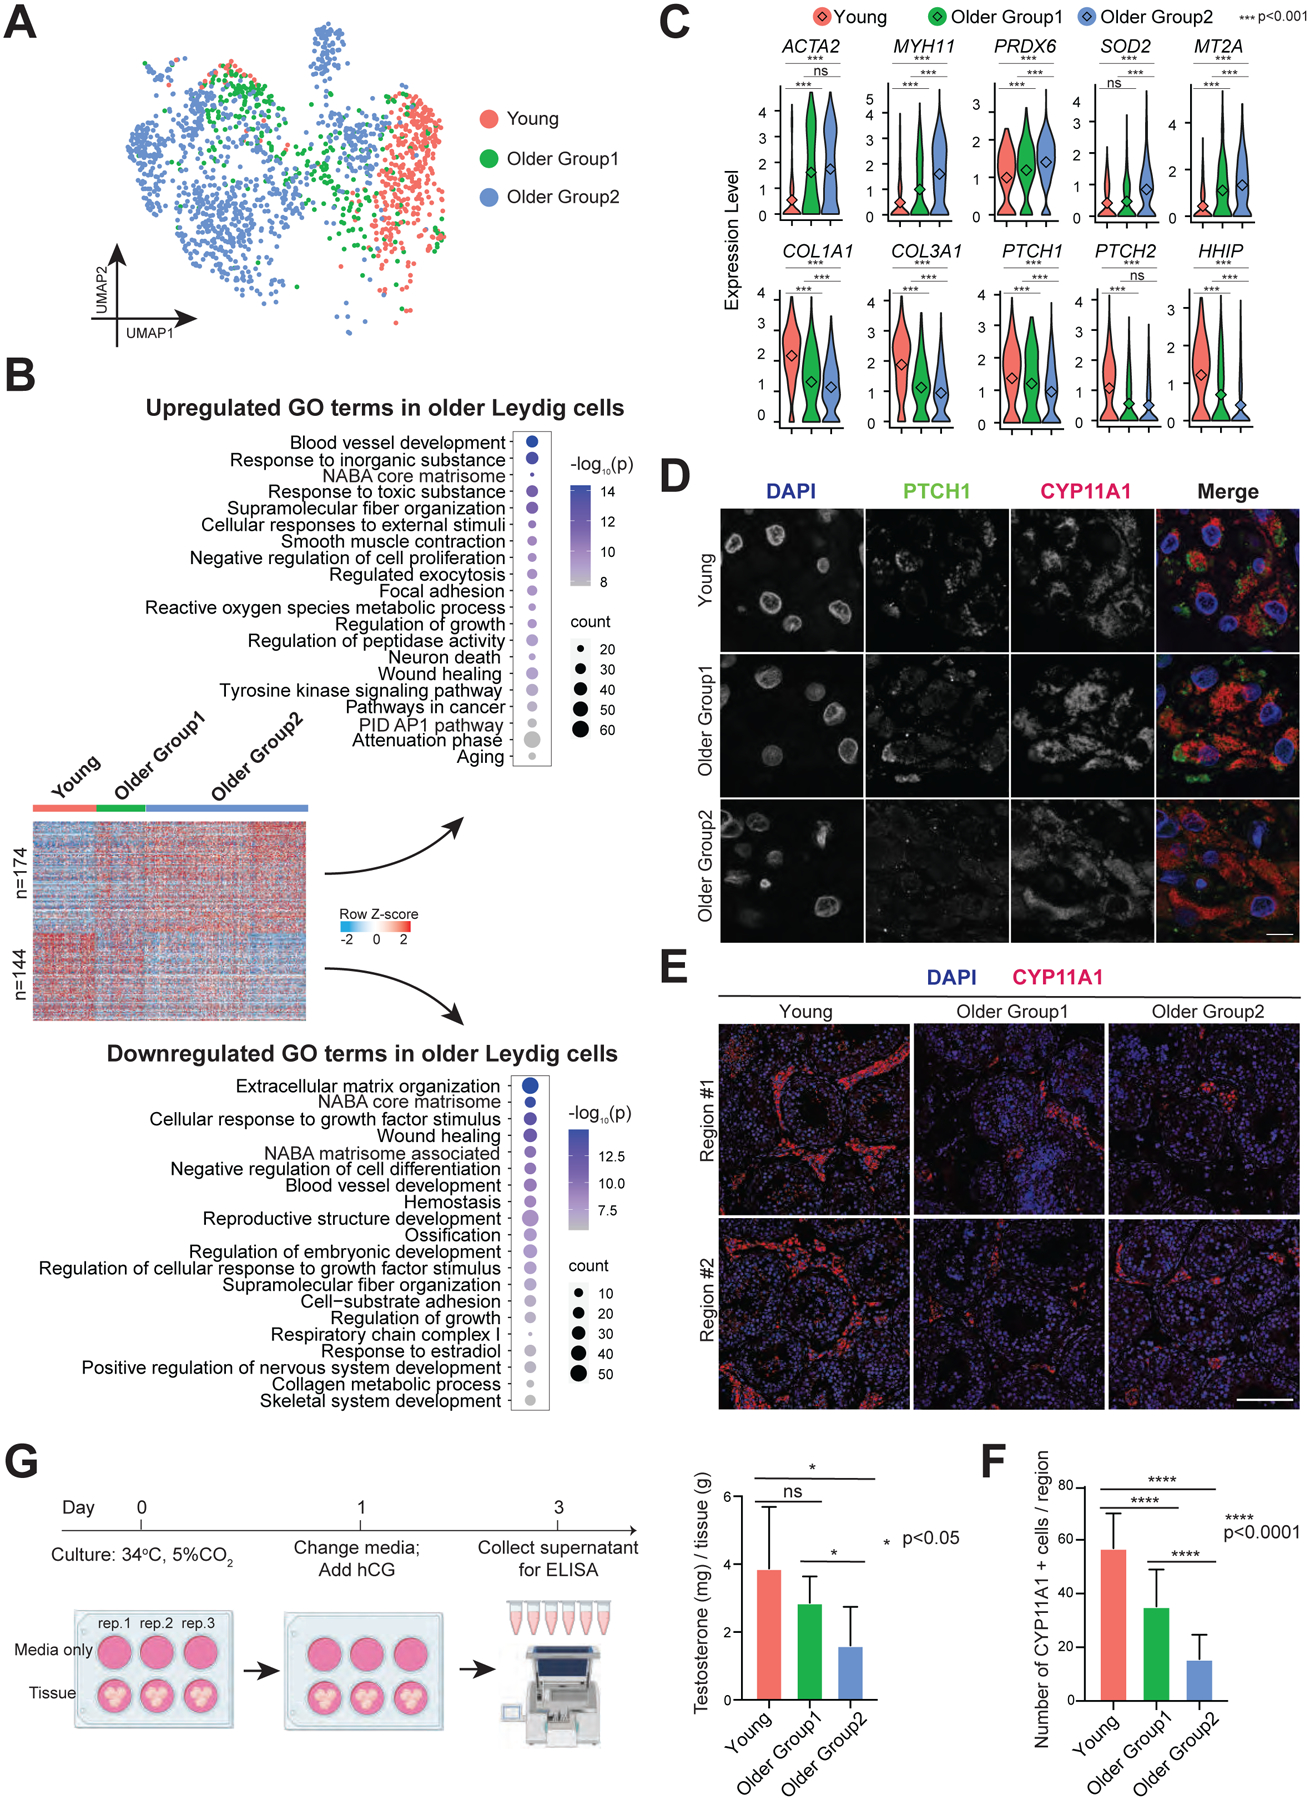
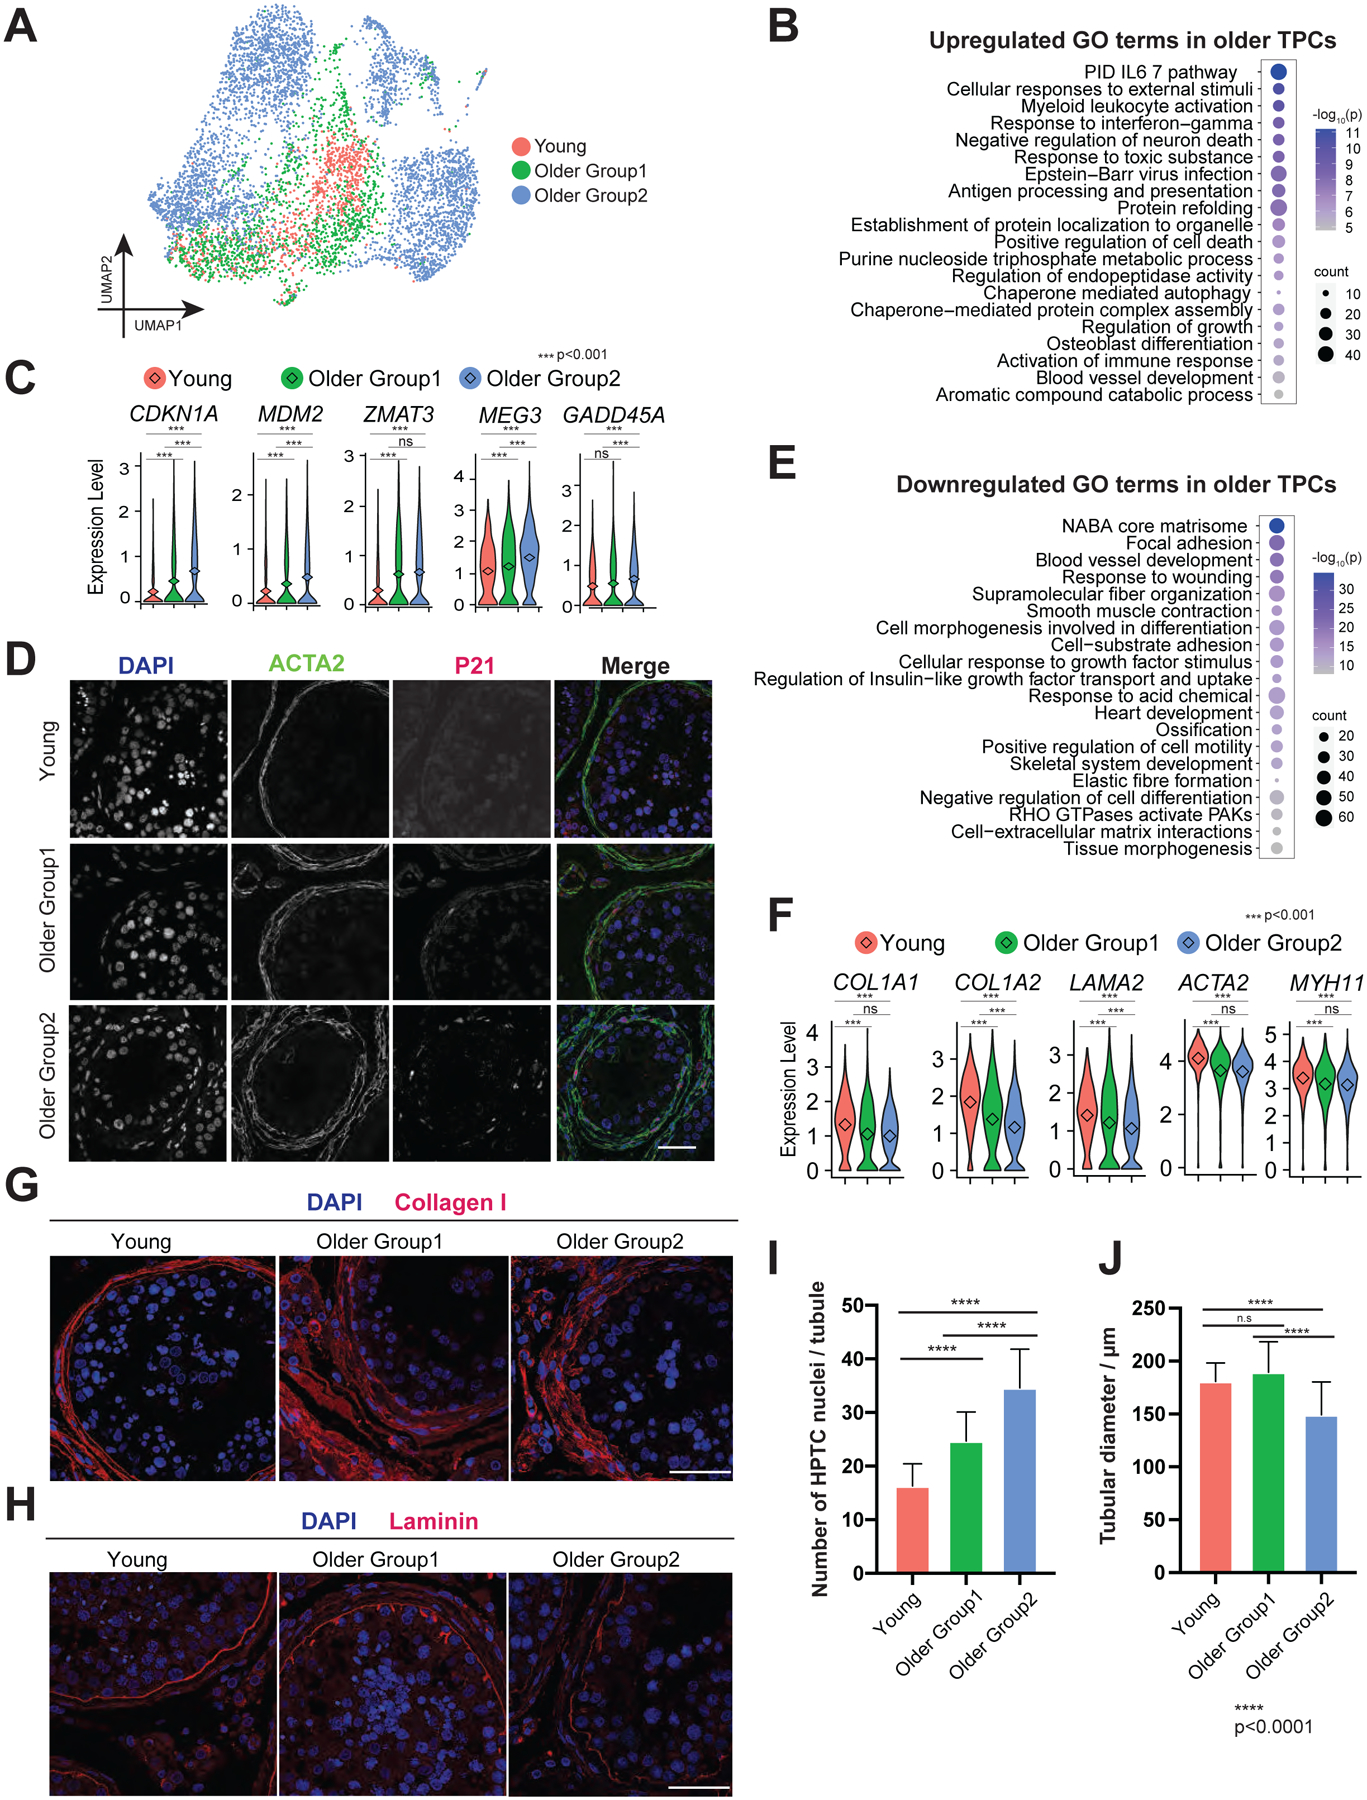
Aging men display reduced reproductive health; however, testis aging is poorly understood at the molecular and genomic levels. Here, we utilized single-cell RNA-seq to profile over 44,000 cells from both young and older men and examined age-related changes in germline development and in the testicular somatic cells. Age-related changes in spermatogonial stem cells appeared modest, whereas age-related dysregulation of spermatogenesis and somatic cells ranged from moderate to severe. Altered pathways included signaling and inflammation in multiple cell types, metabolic signaling in Sertoli cells, hedgehog signaling and testosterone production in Leydig cells, cell death and growth in testicular peritubular cells, and possible developmental regression in both Leydig and peritubular cells. Remarkably, the extent of dysregulation correlated with body mass index in older but not in younger men. Collectively, we reveal candidate molecular mechanisms underlying the complex testicular changes conferred by aging and their possible exacerbation by concurrent chronic conditions such as obesity.

Keywords: Leydig cell; Sertoli cell; male infertility; obesity; peritubular myoid cell; single-cell RNA sequencing; spermatogenesis; spermatogonial stem cell; testis aging; testis niche.


Conflict of interest statement

Declaration of interests The authors declare no competing interests.

Figures

Figure 1.
Figure 1.. Single cell transcriptome profile of testicular cells from young and older men
(A) Schematic of the experimental workflow. (B) Periodic acid–Schiff (PAS) staining (left) and Masson’s trichrome staining (right) of sections of testes from young and older donors, respectively, demonstrating morphological changes during aging and variations among older human testes. (C) UMAP plot showing the annotated testicular cell types from both young and older men (n=12). Each dot represents a single testicular cell, and is colored based on its donor of origin. (D) Left: Heatmap showing the top 200 differentially expressed genes of each cell cluster from (C). The scaled gene expression levels are colored according to Z-score. Right: The corresponding top three GO terms enriched in the marker genes of each cell cluster with −log10(P-value) colored according to the color key at the bottom. (E) Expression of selected markers identifying major testicular cell types cast on the UMAP plot. Purple (or grey) represents a high (or low) expression level as shown on the color key at the right bottom. See also Figure S1.
Figure 2.
Figure 2.. Strong variation in spermatogenic dynamics observed in men with advanced age
(A) UMAP plot showing the annotated germ cells captured from Fig 1C. (B) Expression patterns of selected markers cast on the UMAP plot in Fig 2A. Purple (or grey) represents a high (or low) expression level as shown on the color key at the right bottom. (C) Deconvolution of the UMAP plot of Fig 2A according to donors of origin. (D) Bar plot showing the percentage of major germ cell types for each individual. Older donors with complete spermatogenesis are classified as Older Group1, while older donors with spermatogenic impairment are classified as Older Group2. (E) Left: Immunofluorescence images of a State 0 marker, PIWIL4 (red) across three donor groups. Nuclei were counterstained with DAPI (blue). Right: Quantification of the number of PIWIL4-positive cells in cross-section of each seminiferous tubule in different groups. Bars represent the mean, with standard deviation (SD) of 20 independent tubules per group. n = 6 human samples. ns, no significance. ****p < 0.0001 (two-tailed t-test). Scale bar, 50 μm. (F) Left: Immunofluorescence images of a State 0/1 marker, UTF1 (red) across three donor groups. Nuclei were counterstained with DAPI (blue). Right: Quantification of the number of UTF1-positive cells in cross-section of each seminiferous tubule in different groups. Bars represent the mean with SD of 20 independent tubules per group. n = 6 human samples. ns, no significance. ****p < 0.0001 (two-tailed t-test). Scale bar, 50 μm. (G) Top: Schematic of the human to nude mouse xenotransplantation experiment. Bottom left: Immunofluorescence images of whole-mount staining of recipient mouse testes, using an anti-primate antibody. Human spermatogonia colonies were observed after two months of xenotransplant. Scale bar, 50 μm. Bottom right: Quantification of the number of colonies per 105 viable cells transplanted per testis in different groups. Bars represent the mean with SD. n = 9 human samples. See also Figure S2.
Figure 3.
Figure 3.. Global alterations of the testicular somatic cells and somatic-germline interactions in older human testis
(A) Left: Heatmap showing common and unique upregulated DEGs between young and older men in each major testicular somatic cell type. Middle: Heatmap showing common and unique downregulated DEGs between young and older men in each major testicular somatic cell type. Right: Representative GO terms of shared upregulated (top) or downregulated (bottom) DEGs between young and older somatic cells and their associated p-value. (B) Violin plots showing upregulated DEGs of older testicular somatic cells related to inflammation. Diamond inside the violin represents the mean. (C) Immunofluorescence images of TIMP1 (red) show the elevated TIMP1 staining signal in older testis. Nuclei were counterstained with DAPI (blue). Dashed lines indicate seminiferous tubule membranes. Two donors from each group are shown. Scale bar, 50 μm. (D) Bar plots showing the number of inferred interactions (left) or interaction strength (right) in the cell-cell communication network analyzed by CellChat across the three groups. (E) Circle plots (by CellChat analysis) depict the differential number of interactions (left) or interaction strength (right) in the cell-cell communication network between Young and Older Group2, respectively, indicating SSCs lose interactions with testicular somatic cells during aging. Red or blue edges represent increased or decreased signaling in Older Group2 compared to Young, respectively. (F) Circle plots showing selected inferred differential signaling networks. The edge width represents the communication probability. Bar graph at the bottom of each panel illustrates representative information flow in Older Group2 (blue) and Young (red). See also Figure S2.
Figure 4.
Figure 4.. Sertoli cells from older men display metabolic dysregulation
(A) UMAP plot showing focused analysis of Sertoli cells from Fig 1C. (B) Pseudotime trajectory of Sertoli cells analyzed by Monocle. (C) Deconvolution of pseudotime trajectory of Fig 4B according to Young/Older Groups, predicting gradual change from Young through Older Group1 to Older Group2. (D) Heatmap showing both upregulated and downregulated DEGs in Older Groups of Sertoli cells with columns/cells placed in pseudotime order defined in Figure 4C. The scaled gene expression levels are colored according to Z-score. The top 10 upregulated or downregulated GO terms enriched in the DEGs are listed with p-value and gene numbers. (E) Violin plots showing upregulated DEGs of older Sertoli cells on the top panel and downregulated DEGs of older Sertoli cells at the bottom panel. The diamond inside the violin plot represents the mean. (F) Immunofluorescence images of HMGCS2 (red) in different groups show a significant decrease in staining signal in Older Group2 testis. Nuclei were counterstained with DAPI (blue). Two donors from each group are shown. Scale bar, 50 μm. (G) Immunofluorescence images of a Sertoli cell marker, SOX9 (red) in different groups (Young, Older Group1, and Older Group2). Nuclei were counterstained with DAPI (blue). Scale bar, 50 μm. (H) Quantification of the number of Sertoli cells (SOX9 positive) in cross-section of each seminiferous tubule in different groups. Bars represent the mean with SD of 20 independent tubules per group. n = 6 human samples. ****p < 0.0001, **p < 0.01 (two-tailed t-test). See also Figure S3.
Figure 5.
Figure 5.. Leydig cells from older men display declined functionality, including lower production of testosterone
(A) UMAP plot showing focused analysis of Leydig cells from Fig 1C. (B) Heatmaps showing both upregulated and downregulated DEGs in older Leydig cells. The scaled gene expression levels are colored according to Z-score. The top 20 upregulated or downregulated GO terms enriched in the DEGs are listed with p-value and gene numbers. (C) Violin plots showing upregulated DEGs of older Leydig cells within the top panel and downregulated DEGs of older Leydig cells within the bottom panel. The diamond inside the violin plot represents the mean. (D) Immunofluorescence images of PTCH1 (green) with a Leydig cell marker, CYP11A1 (red) in different groups, revealing decreased PTCH1 expression in older Leydig cells. Nuclei were counterstained with DAPI (blue). Two donors from each group are shown. Scale bar, 10 μm. (E) Immunofluorescence images of a Leydig cell marker, CYP11A1 (red) in different groups. Nuclei were counterstained with DAPI (blue). Two donors from each group are shown. Scale bar, 50 μm. (F) Quantification of the number of Leydig cells (CYP11A1 positive) in cross-section of each microscopic field (0.04 mm2) in different groups, demonstrating reduced Leydig cells during aging. Bars represent the mean with SD of 20 independent tubules per group. n = 6 human samples. ****p < 0.0001 (two-tailed t-test). (G) Left: Schematic of tissue explant culture used to test testosterone production of older Leydig cells. Right: Quantification of testosterone production in Young, Older Group1, and Older Group2, indicating older testis produce less testosterone. Bars represent the mean with SD of 9 donors with 3 technical replicates per sample. *p < 0.05, ns: no significance (two-tailed t-test). See also Figure S4.
Figure 6.
Figure 6.. TPCs display morphological and functional alternations in older testes
(A) UMAP plot showing focused analysis of TPCs from Fig 1C. (B) Dot plot showing the top 20 upregulated GO terms enriched in the DEGs of older TPCs with p-value and gene numbers. (C) Violin plots with mean expression level highlighted inside showing upregulated DEGs of older TPCs. (D) Immunofluorescence images of p21 (encoded by CDKN1A, red) with a TPC marker, ACTA2 (green) in different groups, revealing increased p21 expression in older TPC cells. Nuclei were counterstained with DAPI (blue). Arrows indicate p21 positive cells. n = 6 human samples. Scale bar, 50 μm. (E) Dot plot showing the top 20 downregulated GO terms in older TPCs with p-value and gene numbers. (F) Violin plots showing downregulated DEGs of older TPCs. The diamond inside the violin plot represents the mean. (G) Immunofluorescence images of Collagen I (red), revealing increased Collagen I deposition in older PTC cells. n = 6 human samples. Scale bar, 50 μm. (H) Immunofluorescence images of Laminin (red), revealing abnormal laminin deposition in older PTC cells. n = 6 human samples. Scale bar, 50 μm. (I) Quantification of the number of TPCs in cross-section of each seminiferous tubule in different groups, revealing a progressive increase in the numbers of TPCs around the walls of seminiferous tubules from Young through Older Group1 to Older Group2. Bars represent the mean with SD of 20 independent tubules per group. n = 6 human samples. ****p < 0.0001, **p < 0.01 (two-tailed t-test). (J) Quantification of the diameter of seminiferous tubules in different groups. Bars represent the mean with SD of 20 independent tubules per group. n = 6 human samples. ****p < 0.0001, **p < 0.01 (two-tailed t-test). See also Figure S5 and Figure S6.

References

    1. Albrecht M, Rämsch R, Köhn FM, Schwarzer JU, and Mayerhofer A (2006). Isolation and Cultivation of Human Testicular Peritubular Cells: A New Model for the Investigation of Fibrotic Processes in the Human Testis and Male Infertility. None 91, 1956–1960. - PubMed
    1. Azenabor A, Ekun AO, and Akinloye O (2015). Impact of Inflammation on Male Reproductive Tract. J Reprod Infertil 16, 123–129. - PMC - PubMed
    1. Bray I, and Gunnell D (2006). Advanced paternal age: How old is too old? J Epidemiol Community Health 60, 851–853. - PMC - PubMed
    1. Brinster RL, and Zimmermann JW (1994). Spermatogenesis following male germ-cell transplantation. PNAS 91, 11298–11302. - PMC - PubMed
    1. Broer L, Codd V, Nyholt DR, Deelen J, Mangino M, Willemsen G, Albrecht E, Amin N, Beekman M, de Geus EJC, et al. (2013). Meta-analysis of telomere length in 19,713 subjects reveals high heritability, stronger maternal inheritance and a paternal age effect. Eur J Hum Genet 21, 1163–1168. - PMC - PubMed

Publication types

Substances