. 2022 May 3;13(1):2398.
doi: 10.1038/s41467-022-29833-0.

Structural basis for the synthesis of the core 1 structure by C1GalT1

Affiliations

Structural basis for the synthesis of the core 1 structure by C1GalT1

Andrés Manuel González-Ramírez et al. Nat Commun. .

Abstract

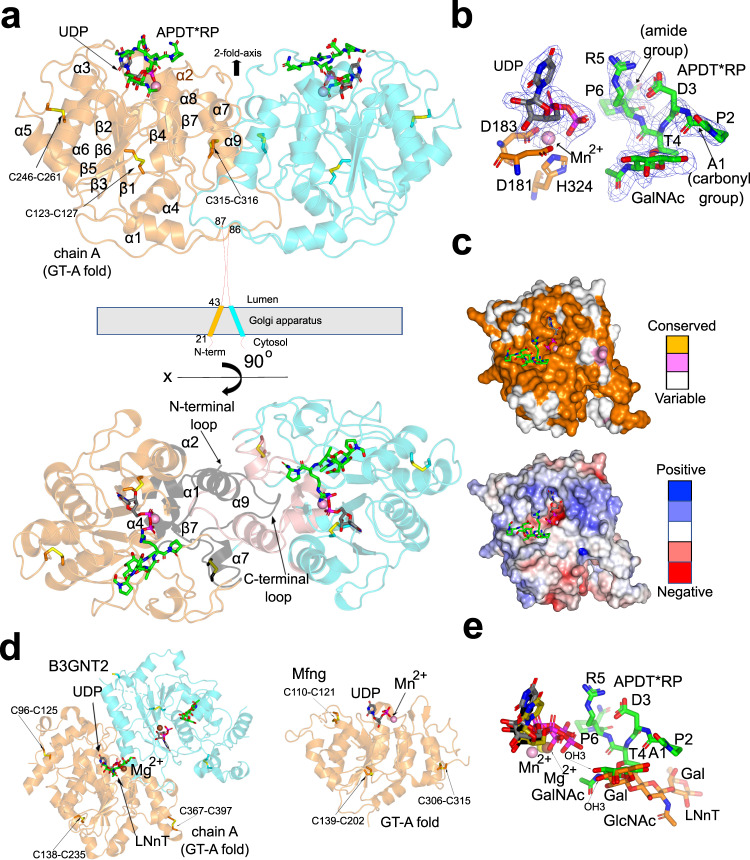
C1GalT1 is an essential inverting glycosyltransferase responsible for synthesizing the core 1 structure, a common precursor for mucin-type O-glycans found in many glycoproteins. To date, the structure of C1GalT1 and the details of substrate recognition and catalysis remain unknown. Through biophysical and cellular studies, including X-ray crystallography of C1GalT1 complexed to a glycopeptide, we report that C1GalT1 is an obligate GT-A fold dimer that follows a SN2 mechanism. The binding of the glycopeptides to the enzyme is mainly driven by the GalNAc moiety while the peptide sequence provides optimal kinetic and binding parameters. Interestingly, to achieve glycosylation, C1GalT1 recognizes a high-energy conformation of the α-GalNAc-Thr linkage, negligibly populated in solution. By imposing this 3D-arrangement on that fragment, characteristic of α-GalNAc-Ser peptides, C1GalT1 ensures broad glycosylation of both acceptor substrates. These findings illustrate a structural and mechanistic blueprint to explain glycosylation of multiple acceptor substrates, extending the repertoire of mechanisms adopted by glycosyltransferases.


Conflict of interest statement

The authors declare no competing interests.

Figures

Fig. 1
Fig. 1. Enzyme kinetics experiments of DmC1GalT1T43-Q388 on (glyco)peptides and α-O-methyl-GalNAc.
a Glycosylation kinetics of DmC1GalT1T43-Q388 against (glyco)peptides and α-O-methyl-GalNAc. b Plots comparing the Kmapp, kcatapp and the catalytic efficiency (kcatapp/Kmapp) between the different substrates. Additional kinetic data are given in Supplementary Table 1. Initial velocities were obtained in duplicate (n = 2 independent experiments) for each peptide concentration. Error bars represent the standard error calculated by the GraphPad Prism fit of the data sets. Source data are provided as a Source Data file.
Fig. 2
Fig. 2. STD NMR experiments and ITC experiments.
a Off resonance (Off Res) and STD spectra of APDT*RP and P4 in the absence and presence of UDP (on resonance frequency at −0.5 ppm) (upper panel). STD NMR-derived epitope mapping for APDT*RP and P4 (lower panel). The different colored spheres indicate the normalized STD signal (in %) observed for each proton. The proton resonances that overlap in the spectrum are identified in the figure and displayed with *. b ITC data for the binding of APDT*RP and P4 to DmC1GalT1. Top: raw thermogram (thermal power versus time). Bottom: binding isotherm (normalized heats versus molar ratio). The ITCs for APDT*RP and P4 were performed in the absence and presence of an excess of UDP. All our ITCs thermograms have low Wiseman “c”-parameters (c < 1), explaining why the initial plateau is missing. Despite this, data reliability is still valid as previously described before,, and in particular the estimated Kds from the low Wiseman “c”-parameters are still reliable as the possible error in n estimation has almost no effect in the Ka parameter adjustment. Note that the Wiseman “c”-parameter is the product of the receptor concentration and the association constant, Ka. The experiments were performed in duplicate (n = 2 independent experiments). c Graph depicting the Kds for APDT*RP in the presence of UDP, and P4/P7 in the presence or absence of UDP. Error bars represent the error calculated through iteration fit of the data sets by the Origin 7 (Microcal).
Fig. 3
Fig. 3. Crystal structure of DmC1GalT1S73-Q388 in a ternary complex with UDP-Mn2+-APDT*RP.
a Ribbon structure of the dimeric form of DmC1GalT1 complexed to UDP-Mn2+ and APDTR*P (upper panel). Chain A and B of DmC1GalT1 are colored in orange and cyan, respectively. The UDP nucleotide is depicted with gray carbon atoms whereas the manganese atom is shown as a pink sphere. The glycopeptide is shown as green carbon atoms. Disulfide bridges are indicated as yellow sulfur atoms. Each monomer contains three conserved disulfide bridges, with the latest being formed by two contiguous Cys residues (see also Supplementary Fig. 1). In the lower panel, the dimeric form is displayed in a different view highlighting the secondary structures and the N- and C-terminal loops regions engaged in interactions in the interface (black and pink for chain A and B, respectively). In (b) Close-up view of the active site showing the bound Mn2+, UDP and ADPT*RP. Electron density maps are Fo–Fc (blue) contoured at 2.2 σ for APDT*RP and UDP. Except for the first N-terminal residue (Ala1) of APDT*RP, the density for the glycopeptide and UDP was well defined. Note that the Pro6 finishes as an amide group. c (upper panel) Surface representation of DmC1GalT1, color-coded by degree of sequence conservation. (lower panel) Electrostatic surface representation of DmC1GalT1 (scale bar ranged from −5 kTe−1 to +5 kTe−1). d Structural homologues of DmC1GalT1. Ligands and cofactors follow the same colors as indicated above. e Superposition of the ligands of DmC1GalT1, B3GNT2 and Mfng. LNnT and the glycopeptide are depicted as orange and green carbon atoms, respectively. UDP carbon atoms are colored as gray in DmC1GalT1, olive in B3GNT2 and black in Mfng. Mn2+ is shown as a pink and yellow sphere in DmC1GalT1 and Mfng, respectively. Mg2+ is shown as a yellow sphere.
Fig. 4
Fig. 4. Structural features of the active site.
a Stereo view of the active site for the DmC1GalT1-UDP-Mn2+-APDT*RP complex. The residues forming the active site are depicted as orange carbon atoms. UDP and the glycopeptide are shown as gray and green carbon atoms, respectively. The manganese atom is shown as a pink sphere. Hydrogen bond interactions are shown as dotted black lines. b Geometry of the glycosidic linkage of the glycopeptide APDT*RP in solution derived from 0.5 µs MD simulations. The dihedral angles are defined as follow, ϕ = O5-C1-O1-Cβ, and ψ = C1-O1-Cβ-Cα. The red circle corresponds to the conformation found for this linkage in the crystal structure of the glycopeptide bound to DmC1GalT1 in the presence of UDP. This conformation is also present in glycopeptide APDS*RP in solution (left panel). 3D view of APDS*RP in complex with DmC1GalT1 in the presence of UDP-Gal obtained from 0.5 µs MD simulations (rigth panel). c Free-energy map (ϕ, ψ) of the glycosidic dihedral angle calculated for the free peptide APDT*RP in water (see Methods) at 300 K. The contour maps are drawn with a spacing of 1 kcal/mol. Regions that were never visited by the peptide are shown in dark orange. “A” refers to the ‘eclipsed’ conformation typically found for α-GalNAc-Thr derivatives in solutions,. “B” refers to the ‘staggered’ conformation found for α-GalNAc-Ser derivatives in solution. d Close-up view of the binding site region of the DmC1GalT1-UDP-Gal-APDT*RP complex showing the Asp255 as the catalytic base in the plausible SN2 single-displacement reaction mechanism. Note the proximity and the orientation of the GalNAc OH3 to the anomeric carbon (3.81 Å) which is compatible with the inversion of the configuration during the reaction. e Histogram showing the relative activities of the mutants compared to the wild-type (WT) protein. All experiments were done in triplicate (n = 3 independent experiments). Error bars represent the standard deviation calculated by the GraphPad Prism fit of the data sets. Source data are provided as a Source Data file. f Proposed SN2 single-displacement reaction mechanism for C1GalT1.
Fig. 5
Fig. 5. Flow Cytometry Analysis of the reinstallation of T glycoform with HsC1GalT1 mutants.
a The O-glycosylation pathway is indicated with the name of the enzymes involved in the synthesis of O-glycan structures. Note that the non-expressed genes and the predicted basic glycan features missing in HEK293 cells are faded out based on RNA-seq analysis. The engineering strategy to develop HEK293Tn clone was performed with C1GALT1 gene KO in HEK293core1 cells (HEK293KO GCNT1,ST3GAL1/2,ST6GALNAC2/3/4) followed by the individual KI of C-terminal Myc tagged HsC1GalT1 WT and 6 mutants complementary DNA. b Flow cytometry analysis with the core 1 specific monoclonal antibody 3C9 (1 to 100 diluted hybridoma supernatant) were used to evaluate the cell surface level of T or core 1 glycoform. c Bar diagrams show mean fluorescence intensities of the mAb 3C9 binding. d Immunocytology analysis of single KI clones with anti-Myc-tag mAb 9E10 detecting C-terminal Myc tag of C1GalT1. Note that HEK293core1 clone (HEK293KO GCNT1,ST3GAL1/2,ST6GALNAC2/3/4) has endogenous expression of HsC1GalT1 without Myc tag. Images are representative of three experiments (n = 3 independent experiments). Scale bar = 20 μm.
Fig. 6
Fig. 6. MD simulations analysis.
a Atomic fluctuation (Cα) derived from 0.5µs MD simulations for DmC1GalT1 and two binary complexes. The data correspond to the average structure of the protein throughout the simulations. b RMSD plots derived from 0.5 µs MD simulations for the apo form and different complexes. Only the backbone atoms of the protein were used for these calculations. c Close-up view of DmC1GalT1-UDP-Gal-APDT*RP complex. d Close-up view of the DmC1GalT1-APDT*RP complex in the absence of UDP-Gal. e Close-up view of the DmC1GalT1-UDP-Gal-P4 complex, showing the interactions between the protein and the N- and C-terminal regions of the peptide fragment.

References

    1. Hurtado-Guerrero R. Recent structural and mechanistic insights into protein O-GalNAc glycosylation. Biochem. Soc. Trans. 2016;44:61–67. doi: 10.1042/BST20150178. - DOI - PubMed
    1. Bennett EP, et al. Control of mucin-type O-glycosylation: a classification of the polypeptide GalNAc-transferase gene family. Glycobiology. 2012;22:736–756. doi: 10.1093/glycob/cwr182. - DOI - PMC - PubMed
    1. de Las Rivas M, Lira-Navarrete E, Gerken TA, Hurtado-Guerrero R. Polypeptide GalNAc-Ts: from redundancy to specificity. Curr. Opin. Struct. Biol. 2019;56:87–96. doi: 10.1016/j.sbi.2018.12.007. - DOI - PMC - PubMed
    1. Ju T, Otto VI, Cummings RD. The Tn antigen-structural simplicity and biological complexity. Angew. Chem. Int. Ed. Engl. 2011;50:1770–1791. doi: 10.1002/anie.201002313. - DOI - PMC - PubMed
    1. Ju T, Brewer K, D’Souza A, Cummings RD, Canfield WM. Cloning and expression of human core 1 beta1,3-galactosyltransferase. J. Biol. Chem. 2002;277:178–186. doi: 10.1074/jbc.M109060200. - DOI - PubMed

Publication types