. 2022 May 3;13(1):2406.
doi: 10.1038/s41467-022-30174-1.

TH17 cells promote CNS inflammation by sensing danger signals via Mincle

Affiliations

TH17 cells promote CNS inflammation by sensing danger signals via Mincle

Quanri Zhang et al. Nat Commun. .

Abstract

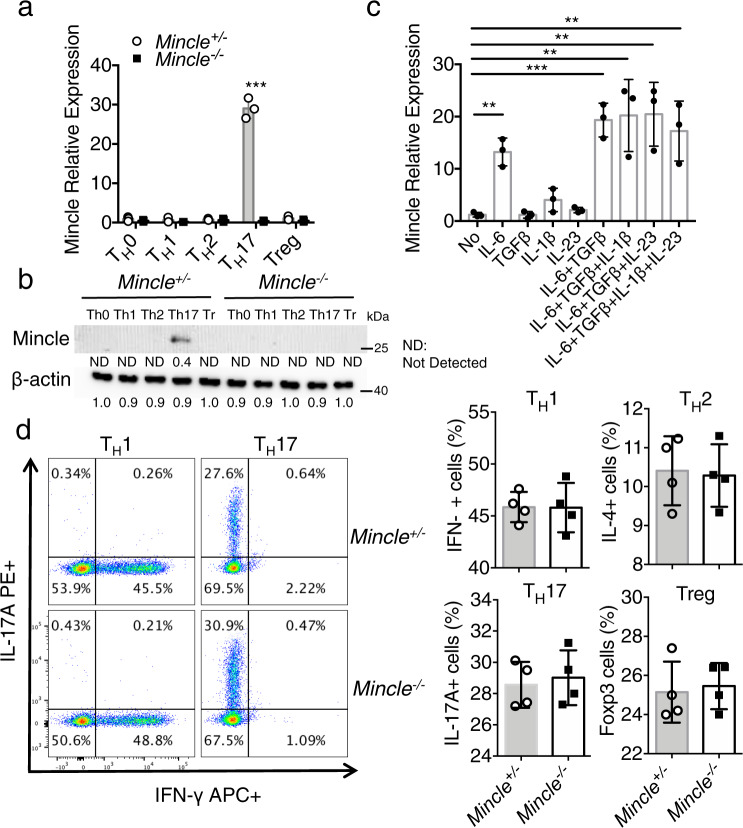
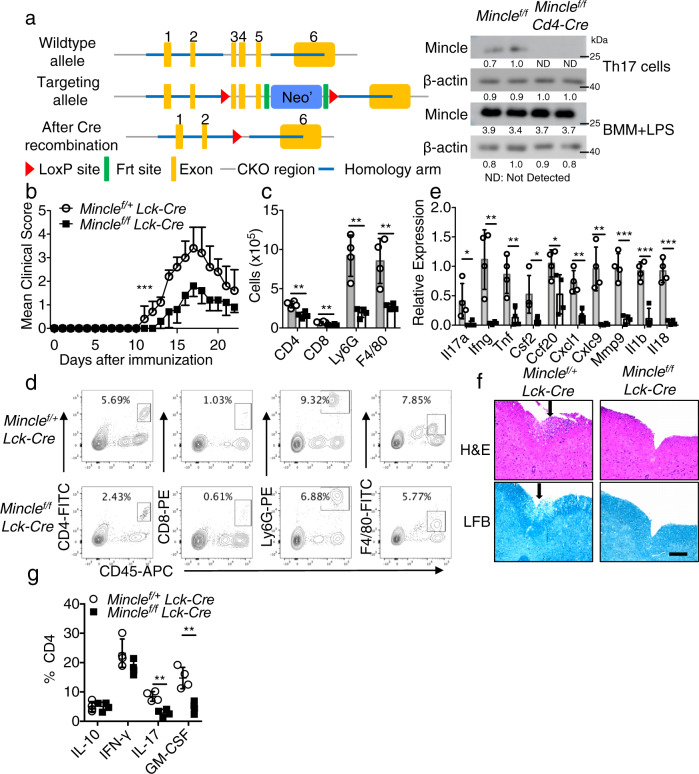
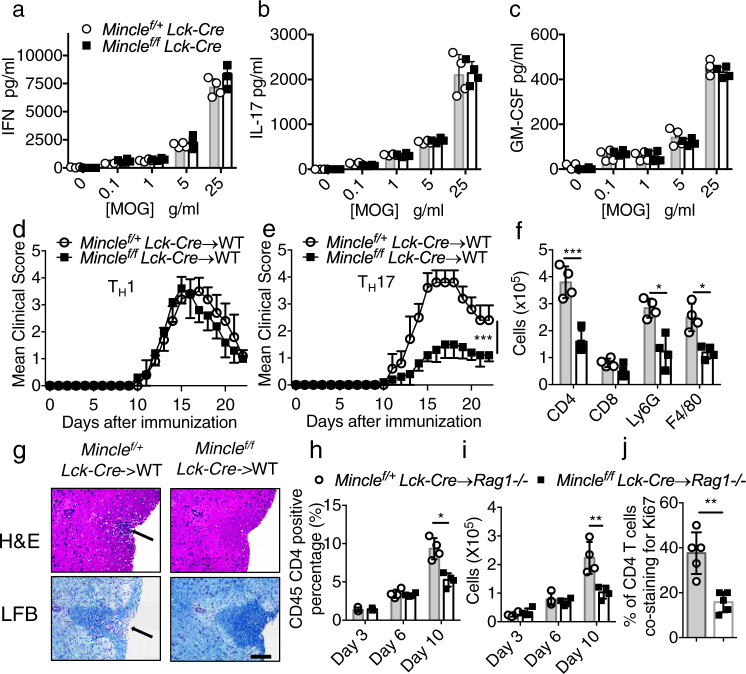
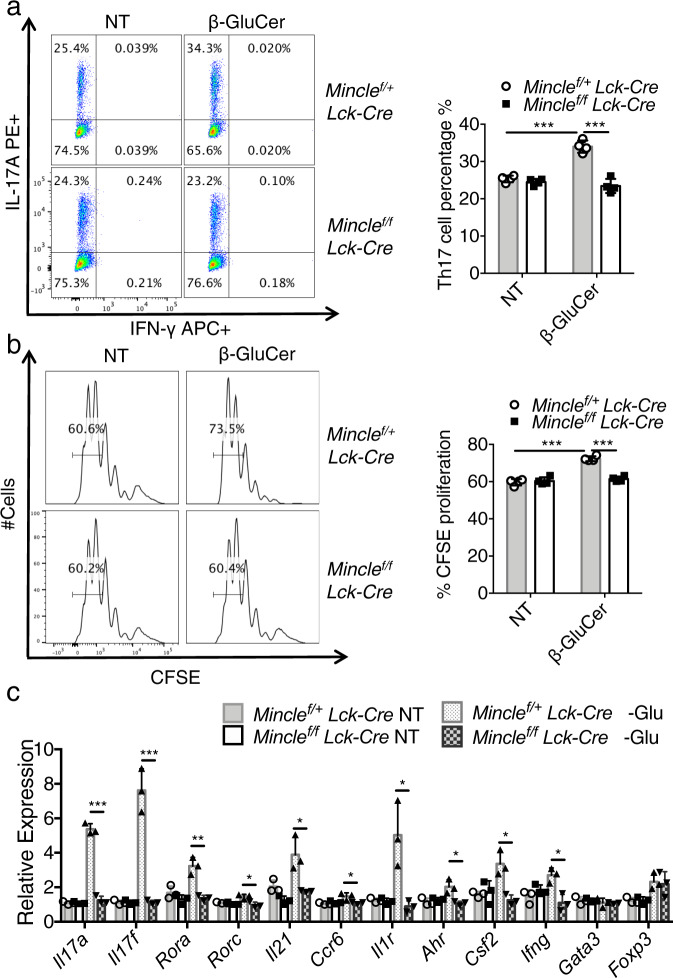
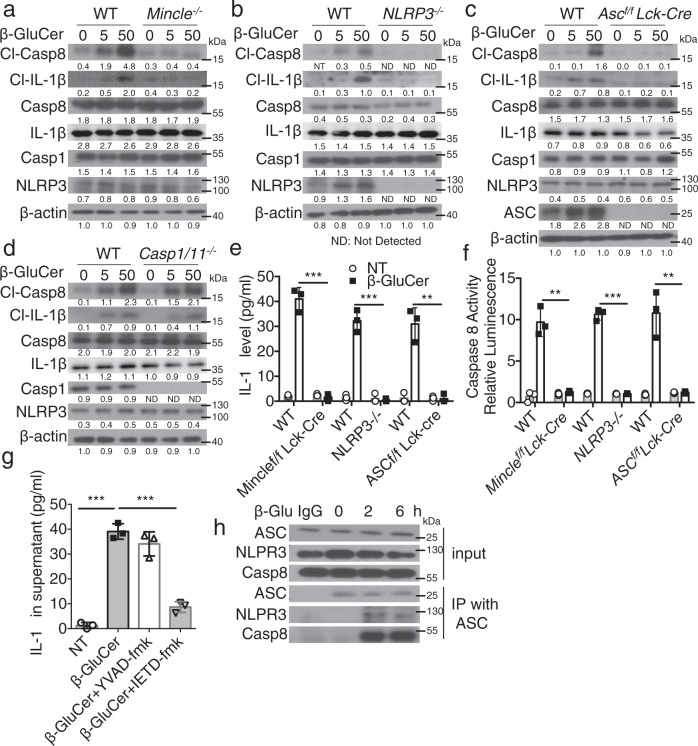
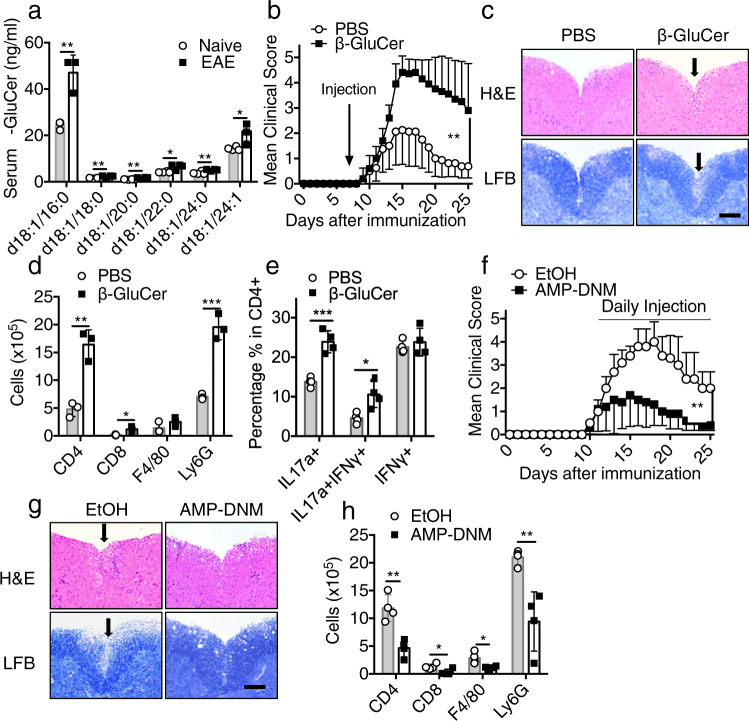
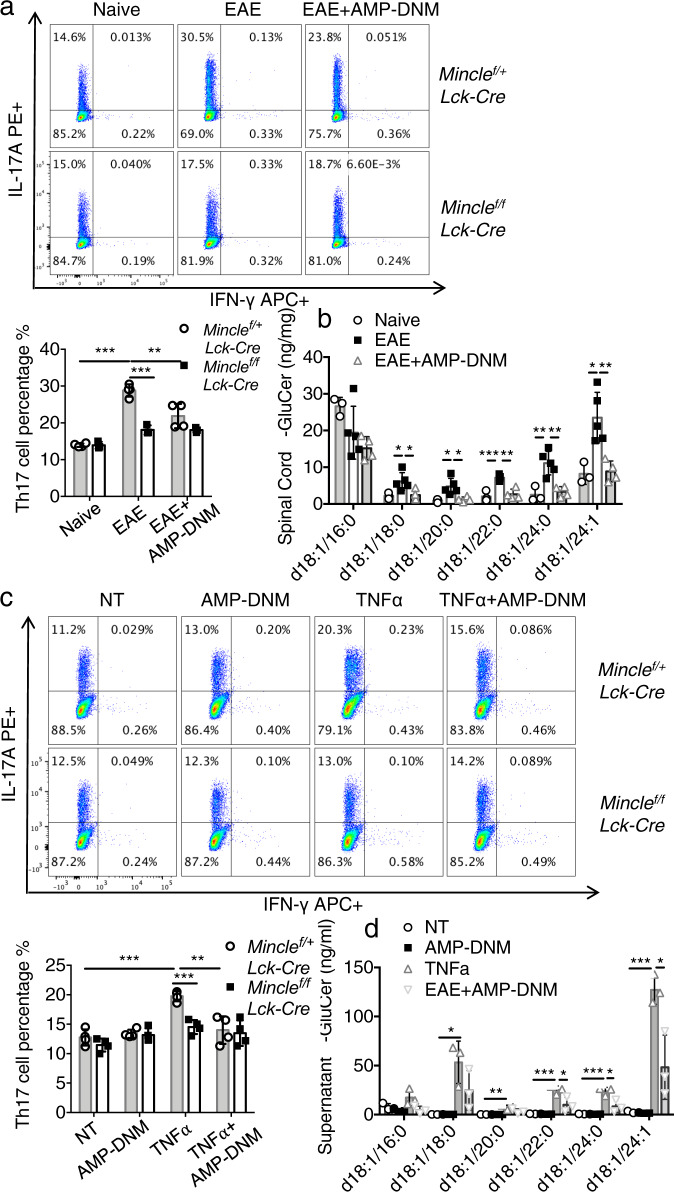
The C-type lectin receptor Mincle is known for its important role in innate immune cells in recognizing pathogen and damage associated molecular patterns. Here we report a T cell-intrinsic role for Mincle in the pathogenesis of experimental autoimmune encephalomyelitis (EAE). Genomic deletion of Mincle in T cells impairs TH17, but not TH1 cell-mediated EAE, in alignment with significantly higher expression of Mincle in TH17 cells than in TH1 cells. Mechanistically, dying cells release β-glucosylceramide during inflammation, which serves as natural ligand for Mincle. Ligand engagement induces activation of the ASC-NLRP3 inflammasome, which leads to Caspase8-dependent IL-1β production and consequentially TH17 cell proliferation via an autocrine regulatory loop. Chemical inhibition of β-glucosylceramide synthesis greatly reduces inflammatory CD4+ T cells in the central nervous system and inhibits EAE progression in mice. Taken together, this study indicates that sensing of danger signals by Mincle on TH17 cells plays a critical role in promoting CNS inflammation.


Conflict of interest statement

The authors declare no competing interests.

Figures

Fig. 1
Fig. 1. Mincle is specifically expressed in TH17 cells.
a Real-time PCR analysis for mRNA levels of Mincle in TH0, TH1, TH2, TH17, and Treg cells after 3 days polarization. The expression levels were normalized to the expression of β-actin, n = 3 biological replicates. b Western analysis of Mincle protein in polarized TH1, TH2, TH17, and Treg cells from WT and Mincle-deficient mice, β-actin as a loading control, data are representative of three independent experiments, density values measured using Image J for the representative blot shown, ND not detected. c Real-time PCR analysis for Mincle mRNA levels in CD4+ cells stimulated with anti-CD3/CD28 in the presence of indicated cytokines for 72 h, n = 3 biological replicates. d Flow cytometry analysis of wild-type and Mincle-deficient TH1, TH1, TH17, and Treg cells with the indicated antibodies, n = 4 biological replicates. ***P < 0.001 (Two sided student’s t test for a and d, Two-way ANOVA for c) Data are represented as mean ± SD. Exact P values for asterisks (from left to right): a 0.00004, c 0.0015, 0.0007, 0.0089, 0.0056, 0.0086.
Fig. 2
Fig. 2. T-cell-specific Mincle deletion protects mice from EAE.
a Targeting vector design for the generation of a mouse strain with flanking Clec4e exon 3-5 by loxP sites and western analysis of Mincle protein expression in TH17 cells and bone marrow macrophages (1 μg/ml LPS, 6 h) from Minclef/+Lck-Cre and Minclef/fLck-Cre mice, n = 2 for each genotype, density values measured using Image J for the representative blot shown, ND not detected. b Mean clinical score of EAE in Minclef/+Lck-Cre and Minclef/fLck-Cre mice (n = 6 mice in each group) induced by active immunization with MOG35-55. c, d Absolute cell numbers (c) and gating strategy (d) of CNS-infiltrating cells were measured at the peak of disease by analyzing brain mononuclear infiltrating cells through flow cytometry with indicated antibodies, n = 4 biological replicates. e Real-time PCR analysis of relative mRNA expression of inflammatory genes in the spinal cord from Minclef/+Lck-Cre and Minclef/fLck-Cre mice at the peak of disease. Expression was normalized to β-actin mRNA, n = 4 biological replicates. f Hematoxylin and eosin (H&E) staining (upper panels) and Luxol fast blue staining (lower panels) of lumbar spinal cords from Minclef/+Lck-Cre and Minclef/fLck-Cre mice harvested at the peak of disease, Scale bars represent 100 μm. Arrows in the upper panel indicate inflammatory cells infiltration, and arrows in the lower panel indicate demyelination area. Representative data are shown for n = 4. g Flow cytometry analysis of infiltrated cytokine-producing CD4 T cells in CNS at the peak of disease, n = 4 biological replicates. *P < 0.05, **P < 0.01 (Two-sided student’s t test, c, e). *P < 0.05 (Two-way ANOVA for b). Data are represented as mean ± SD. Exact P values for asterisks (from left to right): b 0.0002 c 0.0032 0.0012 0.0017 0.0068 d 0.0446 0.0053 0.0062 0.0341 0.0410 0.0021 0.0023 0.0003 0.0005 0.0001 g 0.0014 0.0030.
Fig. 3
Fig. 3. Mincle is required for TH17 mediated EAE progression.
ac Lymph nodes were harvested from MOG immunized mice on Day 9 post immunization, and cells were cultured with increasing concentrations of MOG for 72 h. Cytokine concentrations in the culture media were measured by ELISA, n = 4 biological replicates. d, e Mean clinical score of EAE mice (n = 5) induced by adoptive transfer of MOG-reactive d TH1 or e TH17 cells. f Brain lymphocytes from TH17 recipient mice were harvested at the peak of disease and analyzed by flow cytometry with indicated antibodies by flow cytometry, n = 5 biological replicates. g H&E staining and Luxol fast blue staining of lumbar spinal cords at peak of the disease in recipient mice. Scale bar, 100 μM. Arrows in the upper panel indicate inflammatory cells infiltration, and arrows in the lower panel indicate demyelination area. Representative data are shown for n = 4. h Percentage of CD45+ CD4+ cells of total CNS infiltrated cells from Rag1−/− mice that received MOG-reactive TH17 cells, n = 4 biological replicates. i Cell numbers of CNS-infiltrating CD4+ T cells from (h, j). Percent of Ki67/CD4 double-positive cells from spinal cords from adoptive transfer experiments 9 days after transfer (representative images shown in Supplemental Fig. 3f.). n = 5, biological replicates. **P < 0.01 (Two-sided student’s t test for ac, f, hj). ***P < 0.001 (two-way ANOVA for d, e). Data are represented as mean ± SD. Exact P values for asterisks (from left to right): e <0.0001 f 0.0009 0.0033 0.0037 h 0.0025 i 0.0069 j 0.0015.
Fig. 4
Fig. 4. Mincle activation promotes TH17 differentiation.
a Flow cytometric analysis of IL-17A and IFNγ from Minclef/+Lck-Cre and Minclef/fLck-Cre TH17 polarized with or without β-glucosylceramide (5 μg/ml) stimulation, n = 4 biological replicates. b CFSE staining of TH17 cells polarized with or without β-glucosylceramide (5 μg/ml). Data are presented as mean fluorescent intensity, n = 4 biological replicates. c Real-time PCR of mRNA of inflammatory genes in TH17 cells polarized with or without β-glucosylceramide (1 μg/ml), n = 3 biological replicates. Expression was normalized to expression of β-actin. *p < 0.05, **p < 0.01 ***p < 0.001 (Two sided student’s t test). Data are represented as mean ± SD. Exact P values for asterisks (from left to right): a <0.0001 0.00016 b <0.0001 < 0.0001 c 0.00005 0.00088 0.0036 0.0172 0.0225 0.0341 0.0207 0.0178 0.0101 0.0128.
Fig. 5
Fig. 5. Mincle activation leads to pro-IL-1β processing and secretion in TH17 cells.
ad Polarized TH17 cells from indicated murine strains were stimulated with β-glucosylceramide (0, 5, 50 μg/ml) for 12 h, followed by western blot analysis of supernatants and cell lysates with the indicated antibodies, density values measured using Image J for the representative blot shown, ND not detected. e Supernatants from ad were harvested and IL-1β concentrations were determined by ELISA, n = 3 biological replicates. f TH17 cells were stimulated with β-glucosylceramide (50 μg/ml) for 12 h, caspase 8 Glo Assay reagent was added to the media for another 1 h, followed by analysis by luminescence, n = 3 biological replicates. g IL-1β concentrations were analyzed from the supernatant of polarized TH17 cells pretreated with caspase inhibitors (YVAD-fmk/caspase1 inhibitor, IETD-fmk/caspase 8 inhibitor) and stimulated with β-glucosylceramide, n = 3 biological replicates. h Cell lysates from TH17 treated with β-glucosylceramide (50 μg/ml) were subjected to immunoprecipitation with anti-ASC, followed by western analysis with the indicated antibodies, data is representative of three independent experiments. *p < 0.05, ***p < 0.001 (two-sided student’s t test for eg). Data are represented as mean ± SD. Exact P values for asterisks (from left to right): e 0.00015 0.00024 0.0015 f 0.0011 0.00002 0.0039 g <0.0001 0.0002.
Fig. 6
Fig. 6. β-Glucosylceramide administration promotes EAE.
a Quantification of β-glucosylceramide derivatives obtained from the serum of naive and EAE mice at the peak of the disease, n = 4 biological replicates. b EAE clinical scores of wild-type mice treated with synthetic β-glucosylceramide (150 μg/mice) or vehicle (PBS) on day 10 after EAE induction, n = 5 mice. c Hematoxylin and eosin (H&E) staining (upper panels) and Luxol fast blue staining (lower panels) of lumbar spinal cords EAE mice harvested at the peak of disease. Scale bar, 100 μm. Arrows in the upper panel indicate inflammatory cells infiltration, and arrows in the lower panel indicate demyelination area. Representative data are shown for n = 4. d Absolute numbers of CNS-infiltrating cells were measured at the peak of disease by flow cytometry with indicated antibodies, n = 3 biological replicates. e Flow cytometry analysis of CD4+ lymphocytes from the brain of EAE mice at the peak of the disease, n = 4 biological replicates. f EAE clinical score of wild-type mice treated with AMP-DNM (25 mg/kg) or vehicle (EtOH) since the start of EAE symptom, n = 5 mice. g Hematoxylin and eosin (H&E) staining (upper panels) and Luxol fast blue staining (lower panels) of lumbar spinal cords from EAE mice harvested at the peak of disease. Scale bar, 100 μm. Arrows in the upper panel indicate inflammatory cells infiltration, and arrows in the lower panel indicate demyelination area. Representative data are shown for n = 4. h Absolute numbers of CNS-infiltrating cells were measured at the peak of disease by flow cytometry with the indicated antibodies, n = 4 biological replicates. *P < 0.05, **P < 0.01 (Two-sided student’s t test for a, d, e, h). **P < 0.01 (two-way ANOVA, b, d). Data are represented as mean ± SD. Exact P values for asterisks (from left to right): a 0.0016 0.0061 0.0178 0.0103 0.0129 b < 0.0001 d 0.0024 0.0144 0.0007 e 0.00056 0.01513 f 0.0033 h 0.0023 0.0323 0.0177 0.0057.
Fig. 7
Fig. 7. Dying oligodendrocytes release β-glucosylceramide to activate TH17 through Mincle.
a Flow cytometric analysis of IL-17A and IFNγ following TH17 polarization with lipids extracted from spinal cord of naive, EAE or AMP-DNM treated EAE mice, n = 4 biological replicates. b Measurement of β-glucosylceramide from the spinal cord of naive, EAE and AMP-DNM treated EAE mice, n = 3, 5, 4 biological replicates. c Flow cytometric analysis of IL-17A and IFNγ following TH17 polarization with lipids extracted from supernatants of oligodendrocytes after the indicated treatments, n = 4 biological replicates. d Measurement of β-glucosylceramide from the oligodendrocyte culture medium under indicated stimulations for 12 h, n = 3 biological replicates. *P < 0.05, **P < 0.01, ***P < 0.001 (Two sided student’s t test). Data are represented as mean ± SD. Exact P values for asterisks (from left to right): a < 0.0001 0.00004 0.0091 b 0.0376 0.0289 0.00047 0.0065 0.01178 0.0313 0.0193 0.00043 0.0030 0.0056 c 0.00013 0.00038 0.00366 d 0.0131 0.0055 0.0005 0.0005 0.0001 0.0393 0.0220 0.0190.

Similar articles

Cited by

References

    1. Frohman EM. Multiple sclerosis. Med. Clin. North Am. 2003;87:867–897. doi: 10.1016/S0025-7125(03)00008-7. - DOI - PubMed
    1. Noseworthy JH, Lucchinetti C, Rodriguez M, Weinshenker BG. Multiple sclerosis. N. Engl. J. Med. 2000;343:938–952. doi: 10.1056/NEJM200009283431307. - DOI - PubMed
    1. Pouly S, Antel JP. Multiple sclerosis and central nervous system demyelination. J. Autoimmun. 1999;13:297–306. doi: 10.1006/jaut.1999.0321. - DOI - PubMed
    1. Fletcher JM, Lalor SJ, Sweeney CM, Tubridy N, Mills KH. T cells in multiple sclerosis and experimental autoimmune encephalomyelitis. Clin. Exp. Immunol. 2010;162:1–11. doi: 10.1111/j.1365-2249.2010.04143.x. - DOI - PMC - PubMed
    1. Segal, B. M. The diversity of encephalitogenic CD4+ T cells in multiple sclerosis and its animal models. J. Clin. Med. 8, 120 (2019). - PMC - PubMed

Publication types