. 2022 May 3;13(1):2404.
doi: 10.1038/s41467-022-30071-7.

Alternative splicing modulation by G-quadruplexes

Affiliations

Alternative splicing modulation by G-quadruplexes

Ilias Georgakopoulos-Soares et al. Nat Commun. .

Abstract

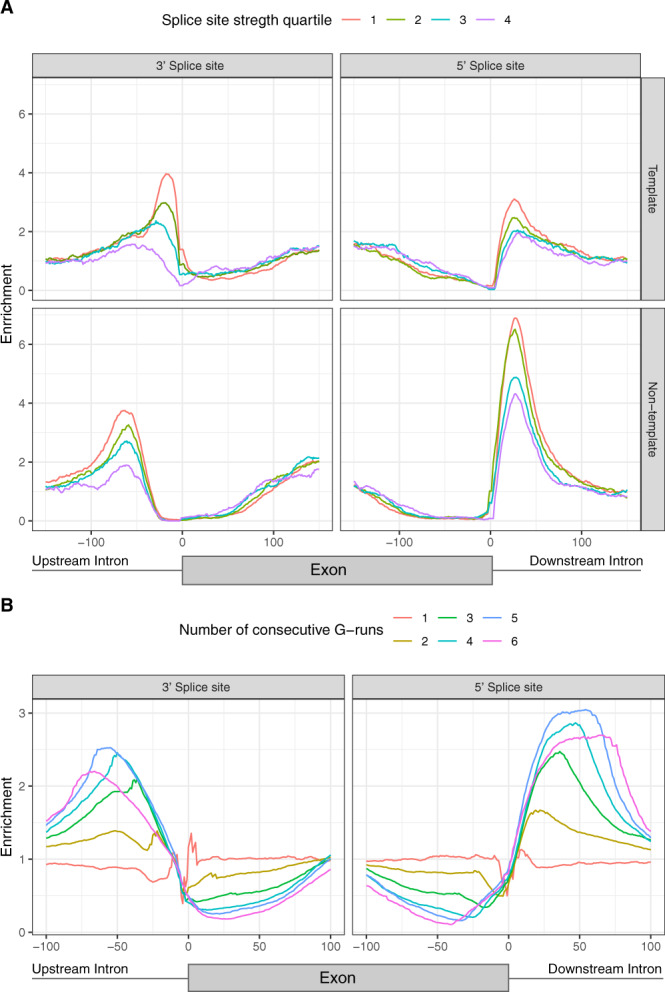
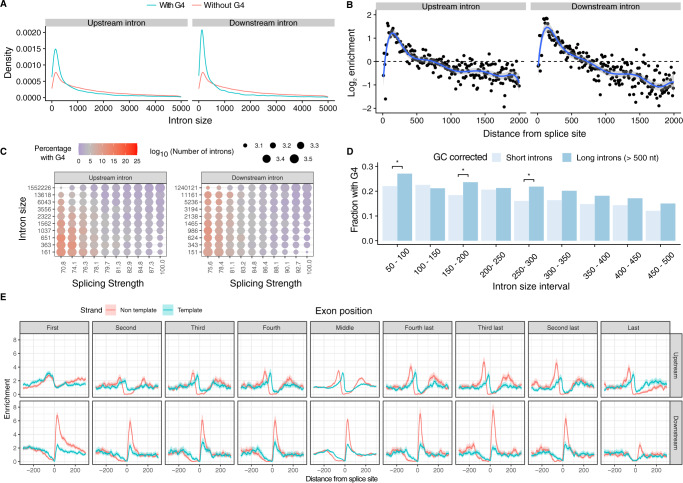
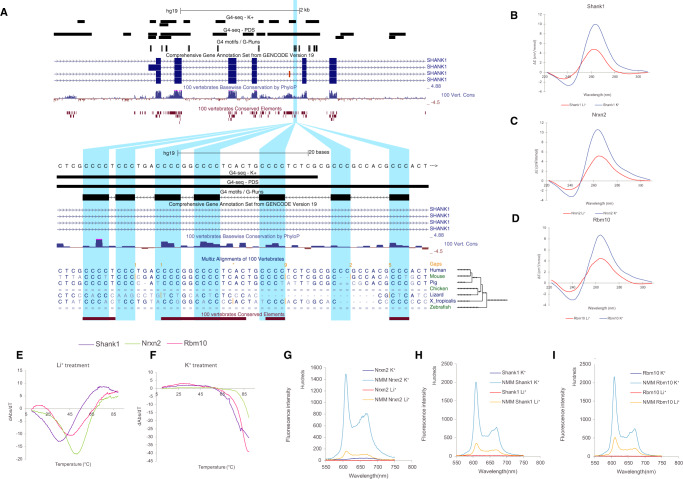
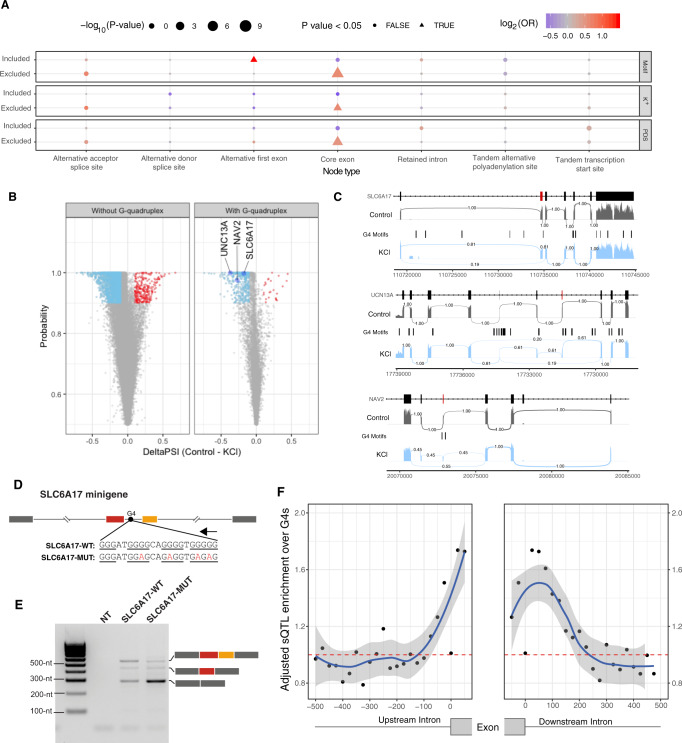
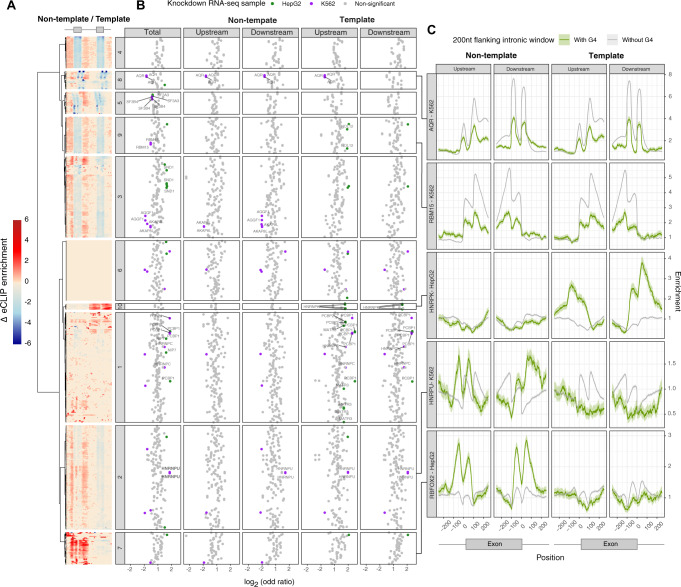
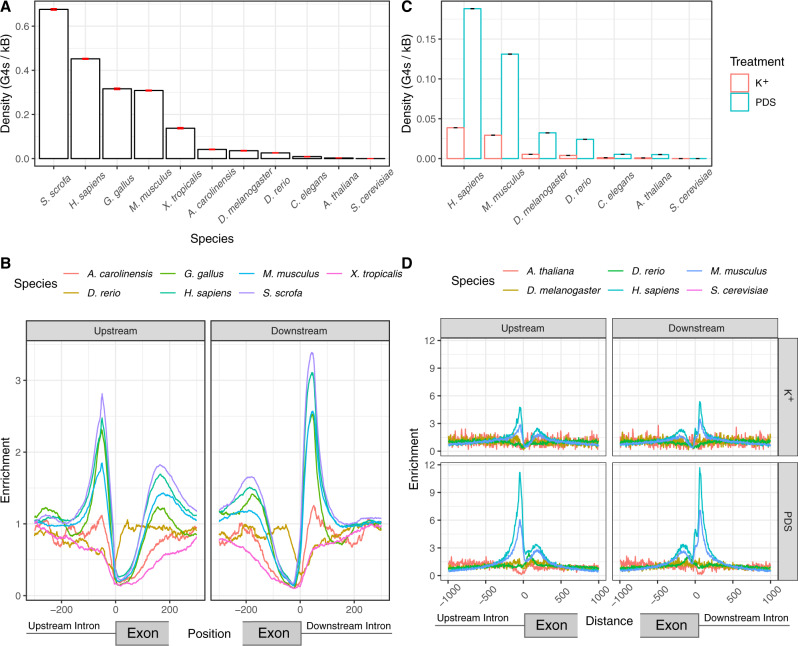
Alternative splicing is central to metazoan gene regulation, but the regulatory mechanisms are incompletely understood. Here, we show that G-quadruplex (G4) motifs are enriched ~3-fold near splice junctions. The importance of G4s in RNA is emphasised by a higher enrichment for the non-template strand. RNA-seq data from mouse and human neurons reveals an enrichment of G4s at exons that were skipped following depolarisation induced by potassium chloride. We validate the formation of stable RNA G4s for three candidate splice sites by circular dichroism spectroscopy, UV-melting and fluorescence measurements. Moreover, we find that sQTLs are enriched at G4s, and a minigene experiment provides further support for their role in promoting exon inclusion. Analysis of >1,800 high-throughput experiments reveals multiple RNA binding proteins associated with G4s. Finally, exploration of G4 motifs across eleven species shows strong enrichment at splice sites in mammals and birds, suggesting an evolutionary conserved splice regulatory mechanism.


Conflict of interest statement

I.G.S. and M.H. are founders of Neomer Diagnostics. E.A.M. is a founder and director of STORM Therapeutics. The remaining authors declare no competing interests.

Figures

Fig. 1
Fig. 1. Non-B DNA motifs at splicing junctions.
A Distribution of non-B DNA motifs relative to splice sites. Seven non-B DNA motifs are shown, namely direct repeats (DRs), G-quadruplexes (G4s), H-DNA, inverted repeats (IRs), mirror repeats (MRs), short tandem repeats (STRs) and Z-DNA. B Distance between nearest G4 motif/G4-seq peak and a splice site separately for 3′/5′ splice sites. C Venn diagrams for the occurrences of G4s within 100 nt of the 3′ss (upstream) and 5′ss (downstream) using the consensus G4 motif, the K+ treatment G4-seq derived DNA G4 peaks and the PDS treatment G4-seq derived DNA G4 peaks and reporting the overlapping G4s between them. D Distribution of G4 motifs relative to cassette exons, alternative acceptor and alternative donor. The orange colour in the schematic represents the alternatively included exonic part, corresponding to each type of alternative splicing event.
Fig. 2
Fig. 2. Characterisation of DNA G4 positioning across splicing junctions.
A G4 enrichment for template and non-template strands and stratified by the splicing strength scores of the adjacent splice site. The splicing strength scores for splice junctions with a G4 are significantly lower than for splice junctions without a G4 (Mann–Whitney U, p value <0.001). The splicing strength score bias was found to be dependent on the strand orientation of G4s for splice sites with G4s within 100 nt away (Mann–Whitney U, 3′ss p value <0.05, 5′ss p value <0.001). B Number of consecutive G-runs and relative enrichment at the splicing junction. The error bands in A, B represent 95% confidence intervals from the binomial error.
Fig. 3
Fig. 3. Distribution of DNA G4s in the vicinity of splicing sites.
A Length density distribution of introns upstream and downstream from exons that are flanked or not by G4s (two-sided Kolmogorov–Smirnov test p value <0.001). B Abundance enrichment of intron sizes at upstream and downstream splice sites flanked by G4s. A bin size of 10 bps was used with the blue line representing an eighth-degree polynomial model. Error bands represent 95% confidence intervals of the regression model. C Heatmap for the relationship between splicing strength score, intron length and G4 presence in a local window of 100 nt within the splice site for the upstream and downstream introns. Red colour represents a high proportion of splice site regions with G4s, whereas blue colour represents depletion of G4s. D Fraction of splice sites with a G4, controlling for GC content between long and short introns. We use chi-squared test to evaluate significant differences between short and long introns (* denotes p values <0.05 after multiple testing corrections). E G4 motif enrichment relative to the splice site across exons in the gene body at the 3′ss and at the 5′ss for template and non-template strands. G4 motifs are enriched at both 3′ss and 5′ss across splice sites throughout the gene body. Exons were separated into first to fourth exons, middle exons, last four exons and the distribution of G4s were studied individually for each category. Error bands represent 95% confidence intervals based on the binomial distribution.
Fig. 4
Fig. 4. Targeted validation of RNA G4s found in splicing sites in presence of a G4 stabilising cation (K+) and a non-G4 stabilising cation (Li+).
A UCSC screenshot displaying the SLC6A17 locus and the distribution of G4 consensus motifs, G4-seq derived G4 peaks and protein domains. BD Circular dichroism (CD) spectra of the three candidate targets for RNA G4 formation potential in presence of two cations. The monovalent ion-dependent nature (G4 stabilised in K+ but not in Li+) and the CD profile (positive peak at 262 nm and negative peak at 240 nm) indicate the formation of RNA G4s with parallel topology. E, F UV-melting profiles of the three G4 candidates in presence of Li+ and K+. Hyperchromic shift at 295 nm is a hallmark for G4 formation, which can be transformed to a negative peak in the derivative plot (dAbs/dT) for G4 stability analysis. The melting temperature (Tm) of a G4 can be identified at the maximum negative value. For the K+ treatment, the Tms of the RNA G4 are >85 °C. GI Fluorescence emission associated with NMM ligand binding to RNA G4 candidates in the presence of Li+ or K+ ions. In the absence of NMM ligand, no fluorescence was observed at ~610 nm. Upon NMM addition, weak fluorescence was observed under Li+, which was substantially enhanced when substituted with K+, supporting the formation of RNA G4 which allows recognition of NMM and enhances its fluorescence.
Fig. 5
Fig. 5. Neuronal stimulation with KCl results in alternative splicing events associated with the presence of G4s.
A G4 association with alternative splicing changes. Inclusion and exclusion patterns of splice nodes are shown in association with DNA G4 presence or absence following KCl treatment. The odds ratio represents the relationship between the presence of G4s and alternative splicing changes. The odds ratio significance was assessed by chi-squared tests. All p values were calculated with chi-squared tests using Yates’ correction and also adjusting for multiple testing with Bonferroni corrections. B Volcano plot showing differential inclusion events in the presence and absence of flanking G4 motifs and the associated probability following potassium stimulation with widespread exon skipping after depolarisation in human neuronal cells. C Sashimi plots showing alternative exon inclusion for the three candidates, namely SLC6A17, UNC13A and NAV2 following KCl treatment. Exons flanked by an RNA G4 that were used for validation experiments (Fig. 4 and Supplementary Fig. 6) are marked in red. The numbers connecting exons represent the fraction of reads supporting each path. D Schematic showing the design of a minigene assay to test the effect of G4 motifs on alternative splicing. Two consecutive exons from SLC6A17 and their flanking intronic regions were inserted into the minigene construct. The red exon corresponds to the alternative exon highlighted in C, while the orange exon represents the following downstream exon that was not detected as alternatively included after KCl treatment. The arrow above the G4 motif indicates its location on the non-template strand. Wild-type and mutant G4 sequences are shown with G-runs underlined and mutations in red. E Minigene assay results show the effect of mutations in G4 motifs, which strongly promote the skipping of both SLC6A17 exons. This experiment was conducted twice, leading to reproducible results (Supplementary Fig. 12e). F Adjusted enrichment of sQTLs at G4s relative to splice sites. The error bands represent 95% confidence intervals based on a binomial model.
Fig. 6
Fig. 6. The interplay between RNA binding proteins and G4 motifs in proximity to splice sites.
A Enrichment difference in the distribution of RBPs in sites with and without G4 motifs is shown for the template and non-template G4 orientations. Heatmap displaying the clustering of differential enrichment values of each RBP between splice sites flanked by non-template (left) or template (right) G4s. B Functional assessment of the RBP effect on alternative inclusion of exons flanked by G4 motifs. Each dot represents a single replicate performed for an RBP on a given cell line. Log(odds ratio) of differential inclusion for sites with and without G4 motifs, following RBP KO experiments. Significant associations between RBPs and alternative inclusion of G4-flanked exons are highlighted either in green (HepG2) or purple (K562). Labelled factors are the set of high-confidence factors identified by consistent eCLIP and LoF followed by RNA-seq analyses. Results are shown in aggregate, as well as for template and non-template orientations separately. Statistical evaluation was performed using chi-squared tests with Bonferroni corrections. Results for both eCLIP and RNA-seq experiments that target the same factor are shown side by side. C Enrichment of a panel of RBP binding sites across splice sites flanked or not flanked by G4 motifs. Displayed factors are AQR, RBM15, HNRPK, HNRPU and RBFOX2, each of which belongs to a different eCLIP cluster. The error bands represent 95% confidence intervals based on a binomial model.
Fig. 7
Fig. 7. Enrichment of DNA G4s at splicing sites across different species.
A Density of G4 motifs in a 100 nt window on each side across all upstream (3’ss) and downstream (5’ss) splice sites of each species, measured as mean values. Error bars indicate standard deviation from 1000-fold bootstrapping with replacement. B Enrichment of G4 motifs at splice sites for seven vertebrate species, using the consensus G4 motif. C Enrichment of G4-seq derived DNA G4s at splicing sites at 100 nt splicing site windows in PDS and K+ treatments, measured as mean values. Error bars indicate standard deviation from 1000-fold bootstrapping with replacement. D Enrichment of DNA G4s at: upstream (3’ss) and downstream (5’ss) splice sites across six species for PDS and K+ treatments.

References

    1. Pan Q, Shai O, Lee LJ, Frey BJ, Blencowe BJ. Deep surveying of alternative splicing complexity in the human transcriptome by high-throughput sequencing. Nat. Genet. 2008;40:1413–1415. doi: 10.1038/ng.259. - DOI - PubMed
    1. Wang ET, et al. Alternative isoform regulation in human tissue transcriptomes. Nature. 2008;456:470–476. doi: 10.1038/nature07509. - DOI - PMC - PubMed
    1. Licatalosi DD, Darnell RB. RNA processing and its regulation: global insights into biological networks. Nat. Rev. Genet. 2010;11:75–87. doi: 10.1038/nrg2673. - DOI - PMC - PubMed
    1. Oesterreich, F. C., Bowne-Anderson, H. & Howard, J. The contribution of alternative splicing probability to the coding expansion of the genome. bioRxiv10.1101/048124 (2016).
    1. Bell LR, Maine EM, Schedl P, Cline TW. Sex-lethal, a Drosophila sex determination switch gene, exhibits sex-specific RNA splicing and sequence similarity to RNA binding proteins. Cell. 1988;55:1037–1046. doi: 10.1016/0092-8674(88)90248-6. - DOI - PubMed

Publication types