. 2022 May 3;13(1):2416.
doi: 10.1038/s41467-022-29928-8.

Multivalent interactions essential for lentiviral integrase function

Affiliations

Multivalent interactions essential for lentiviral integrase function

Allison Ballandras-Colas et al. Nat Commun. .

Abstract

A multimer of retroviral integrase (IN) synapses viral DNA ends within a stable intasome nucleoprotein complex for integration into a host cell genome. Reconstitution of the intasome from the maedi-visna virus (MVV), an ovine lentivirus, revealed a large assembly containing sixteen IN subunits1. Herein, we report cryo-EM structures of the lentiviral intasome prior to engagement of target DNA and following strand transfer, refined at 3.4 and 3.5 Å resolution, respectively. The structures elucidate details of the protein-protein and protein-DNA interfaces involved in lentiviral intasome formation. We show that the homomeric interfaces involved in IN hexadecamer formation and the α-helical configuration of the linker connecting the C-terminal and catalytic core domains are critical for MVV IN strand transfer activity in vitro and for virus infectivity. Single-molecule microscopy in conjunction with photobleaching reveals that the MVV intasome can bind a variable number, up to sixteen molecules, of the lentivirus-specific host factor LEDGF/p75. Concordantly, ablation of endogenous LEDGF/p75 results in gross redistribution of MVV integration sites in human and ovine cells. Our data confirm the importance of the expanded architecture observed in cryo-EM studies of lentiviral intasomes and suggest that this organization underlies multivalent interactions with chromatin for integration targeting to active genes.


Conflict of interest statement

D.J.G. and R.K.M. are named as inventors on a patent application relating to the use of the MVV vectors described in this study. A.N.E. has consulted for ViiV Healthcare Co. on work unrelated to this study. No other authors declare competing interests.

Figures
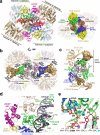
Fig. 1
Fig. 1. Overview of the MVV intasome architecture.
a Left: Refined model of the STC, shown as cartoons and color-coded to highlight LEDGF/p75 and IN subunits. Catalytic IN tetramers (tetramers I and II) are colored by subunit: the IN chains providing active sites are blue and green, and the remaining chains of the catalytic tetramers are shown in yellow, cyan, and light pink. The eight IN subunits comprising flanking tetramers III and IV are brown. LEDGF/p75 IBDs are magenta; vDNA and tDNA are gray and red, respectively. Right: The STC with IN domains contributing to the CIC shown in surface mode and indicated, and the remainder of the structure shown in semi-transparent cartoons. Red triangles depict active sites. b The STC with the CTDs comprising the tetrads in surface mode. c IN-vDNA interactions. One of the two vDNA ends is shown. Locations of IN domains (NTD, CCD, and CTD), CCD-CTD linkers, Arg231 residues involved in vDNA binding and the active site (red triangle) are indicated. d Closeup view of one of the LEDGF/p75 IBDs identified within the STC reconstruction. IN residues involved in the interactions with vDNA are shown as sticks and indicated. e Closeup view of the MVV STC active site region with IN, vDNA, and tDNA in green, gray, and red, respectively. Also shown are superposed structures of MVV CSC (yellow) and PFV CSC (cyan, PDB ID 3OY9). The three structures were superposed by the Cα atoms of the residues comprising the invariant D,D-35-E motif in each active site (indicated as D, D, and E, corresponding to Asp66, Asp118, and Glu154 in MVV, and Asp128, Asp185, and Glu221 in PFV IN). The protein and DNA are shown as cartoons and sticks, respectively; spheres (M) are catalytic Mn2+ cations in the PFV crystal structure. Residues of the invariant 3′ vDNA dCdA dinucleotide are indicated, and nucleotides of the tDNA in the MVV STC structure are numbered (0 corresponds to the nucleotide joined to 3′ end of vDNA).
Fig. 2
Fig. 2. Engagement of tDNA by the MVV intasome.
a Closeup view of the vDNA-tDNA synapse within the MVV STC. DNA phosphate backbone is shown as cartoon with sugar and bases as sticks. Complementary tDNA strands are in red and pink. The rest of the chains are colored as in Fig. 1a. MVV IN residues involved in the interactions with tDNA are shown as sticks and indicated. b Nucleotide preferences at MVV integration sites. Sequence logos, represent information content (reported in bits, top) or raw nucleotide frequencies (bottom) at each position within an alignment of 327,911 in vitro MVV intasome integration sites in sheep genomic DNA. Nucleotide positions of the tDNA strand represented by the logos are numbered, and the nucleotide that becomes joined to 3′ vDNA end (corresponding to position 0) is indicated with solid black arrowhead. The dotted arrowhead indicates the insertion position of the second vDNA end into the complementary tDNA strand.
Fig. 3
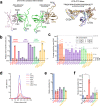
Fig. 3. Design and activities of MVV IN mutants.
a Locations of targeted IN residues of the CTD-CTD interfaces (left) and configuration of the CCD-CTDs linkers within eight structurally distinct IN chains of the intasome (right; amino acid sequence of the linker is shown above the superposition). Colors of protein chains are preserved from Fig. 1. Intra-tetramer and inter-tetramer CTD-CTD interfaces, the CCD-CTD linker, and specific amino acid residues targeted by mutagenesis (shown as sticks) are indicated. Due to C2 symmetry, the two CTD tetrads (Fig. 1b) are equivalent within the intasome. b Strand transfer activities of indicated MVV IN mutant proteins relative to that of WT (set to 100%), measured by real-time PCR. The bar plot displays mean values with standard deviations from n=3 independent experiments for each condition; open circles indicate values for individual repeat measurements. For clarity, bar plots are color-coded: blue bars show property of WT IN; red, control IN mutants; purple and green, mutants of the intra- and inter-tetramer CTD-CTD interfaces, respectively; yellow, mutants of the CCD-CTD linker. The gray dotted line represents the level of background (LoB), determined from three IN-omit reactions and defined as mean background +1 standard deviation. Qualitative analysis of the strand transfer products by agarose gel electrophoresis is shown in Supplementary Fig. 5b. c Average molar masses (kDa) of MVV IN variants determined by SEC-MALLS upon injections of the proteins at 8, 4, 2, and/or 1 mg/mL (indicated with upward triangles, circles, diamonds, and downward triangles, respectively). Bars represent values obtained with IN injected at 2 mg/mL. Molecular masses of MVV IN monomer (32.3 kDa), dimer, tetramer, and octamer are indicated with gray dotted lines. Statistical significance (WT vs mutant) was estimated using two-tailed paired Student’s t-test, and the results are reported as highly significant (**p < 0.01), significant (*p < 0.05), or non-significant (n.s.); exact P values are provided in Source Data file. d Size exclusion chromatography elution profiles of CSC intasomes assembled with Cy3-labeled vDNA and WT or mutant MVV INs. The curves report Cy3 absorbance at 550 nm to distinguish nucleoprotein complexes from protein aggregates. Only elution volumes 7–10 mL are shown here; the complete elution profiles (0–20 mL), including results of the intasome assemblies with the remaining MVV IN mutants, are shown in Supplementary Fig. 5d. e Infectivity of single-cycle MVV-derived vectors produced using Gag-Pol constructs incorporating WT or indicated mutant IN. Luciferase expression was measured 7 day post-infection. The bars indicate mean values with standard deviations from n = 6 biological replicates for each condition; open circles indicate values for individual measurements. f Quantification of late reverse transcription products in cells infected with WT or IN mutant MVV vectors at 8 h post-infection. The bars show mean values with standard deviations from n = 3 biological replicates for each condition; open circles indicate values for individual measurements; two-tailed paired Student’s t-test was used to estimate WT-vs-mutant statistical significance (**p = 2 × 10−5; *p = 0.02). Source data are provided as a Source Data file.
Fig. 4
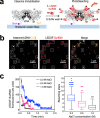
Fig. 4. Quantitation of intasome-LEDGF/p75 stoichiometry by single-molecule TIRF microscopy.
a Schematic of the photobleaching experiment. Intasomes containing biotin- and Cy3-conjugated vDNA were immobilized on a streptavidin-coated cover slip (light blue rectangle). IN and vDNA are shown as gray and black cartoons, respectively; biotin and Cy3 are depicted as a purple circle and yellow solar symbol, respectively. Following incubation with LEDGF/p75 (red cartoons) conjugated with Surf649 (red solar symbol) and a wash with buffer containing 0.2, 0.5, or 1 M NaCl, immobilized intasomes were observed by TIRF microscopy. The individual steps of Surf649 photobleaching during illumination with a 640-nm laser (hν) were counted. b Representative images of surface attached intasome (vDNA-Cy3, yellow; LEDGF/p75-Surf649, red) molecules. The field of view of 14.4 by 14.4 μm shown here is representative of the dataset, which included three areas of 81.9 by 81.9 μm (see Methods section for details). Dotted, white line squares indicate individual intasome-LEDGF/p75 complexes. c Left: examples of stepwise photobleaching traces of LEDGF/p75-Surf649 at increasing NaCl concentration: 0.2 M (blue), 0.5 M (magenta), and 1.0 M (dark gray). The vertical axis represents fluorescence in arbitrary units (arb. units). Right: Box-and-whiskers plots summarizing statistical analysis of the number of LEDGF/p75-Surf649 photobleaching steps per intasome, for various NaCl concentrations (see Supplementary Table 2 for further details). Each box encloses data between 25th and 75th percentiles, with the median value displayed as a horizontal line. Vertical lines (whiskers) indicate 10th and 90th percentiles; outliers are indicated with closed circles. Source data are provided as a Source Data file.
Fig. 5
Fig. 5. Effects of LEDGF/p75 depletion on MVV integration site distribution.
a Frequencies of MVV and HIV-1 integration events in HEK293T cells (green circles and blue squares, respectively), in LKO cells (red squares and orange circles, respectively), MVV integration events in LHKO cells (purple circles), and matched random control (MRC) sites (gray diamonds) into TUs of variable transcriptional activity. Human TUs were ranked by their activity into five bins, where each bin contained the same fraction of the genome; only integration events mapped to RefSeq genes were considered for this analysis. Statistical significance (e.g. HIV-1 in HEK293T vs LKO, as indicated by vertical brackets) was determined using two-sided Chi-squared tests for corresponding 2 × 5 contingency tables. All data are provided as a Source Data file. b Frequency of MVV integration into TUs of different activity in ovine CPT3 (green circles), CPT3-LKO1 (orange circles), and CPT3-LHKO2 cells (purple circles). c, d Local GC contents for mapped integration sites in human (c) and ovine (d) cells. The data are plotted as violin plots showing frequency distribution for individual GC contents. Thick horizontal lines represent median values, while thin lines indicate boundaries of 25th and 75th percentiles of data points. See Supplementary Tables 3 and 4 for statistical analyses of panel c, d datasets. Source data are provided as a Source Data file.

References

    1. Coffin JM, Fan H. The discovery of reverse transcriptase. Annu. Rev. Virol. 2016;3:29–51. doi: 10.1146/annurev-virology-110615-035556. - DOI - PubMed
    1. Maertens G, Engelman A, Cherepanov P. Structure and function of retroviral integrase. Nat. Rev. Mirobiol. 2022;20:20–34. doi: 10.1038/s41579-021-00586-9. - DOI - PMC - PubMed
    1. Engelman A, Mizuuchi K, Craigie R. HIV-1 DNA integration: mechanism of viral DNA cleavage and DNA strand transfer. Cell. 1991;67:1211–1221. doi: 10.1016/0092-8674(91)90297-C. - DOI - PubMed
    1. Hare S, Maertens GN, Cherepanov P. 3’-processing and strand transfer catalysed by retroviral integrase in crystallo. EMBO J. 2012;31:3020–3028. doi: 10.1038/emboj.2012.118. - DOI - PMC - PubMed
    1. Wei SQ, Mizuuchi K, Craigie R. A large nucleoprotein assembly at the ends of the viral DNA mediates retroviral DNA integration. EMBO J. 1997;16:7511–7520. doi: 10.1093/emboj/16.24.7511. - DOI - PMC - PubMed

Publication types