. 2022 May 3;13(1):2408.
doi: 10.1038/s41467-022-29792-6.

DNA methylation signature of chronic low-grade inflammation and its role in cardio-respiratory diseases

Matthias Wielscher  1   2 Pooja R Mandaviya  3   4 Brigitte Kuehnel  5 Roby Joehanes  6   7 Rima Mustafa  8 Oliver Robinson  8 Yan Zhang  9 Barbara Bodinier  8 Esther Walton  10   11 Pashupati P Mishra  12   13   14 Pascal Schlosser  15 Rory Wilson  5 Pei-Chien Tsai  16   17 Saranya Palaniswamy  8   18 Riccardo E Marioni  19 Giovanni Fiorito  20   21 Giovanni Cugliari  22 Ville Karhunen  8 Mohsen Ghanbari  23   24 Bruce M Psaty  25   26   27 Marie Loh  8   28 Joshua C Bis  29 Benjamin Lehne  8 Nona Sotoodehnia  29 Ian J Deary  30 Marc Chadeau-Hyam  8 Jennifer A Brody  29 Alexia Cardona  31 Elizabeth Selvin  32   33 Alicia K Smith  34 Andrew H Miller  35 Mylin A Torres  36 Eirini Marouli  37 Xin Gào  9 Joyce B J van Meurs  3 Johanna Graf-Schindler  5 Wolfgang Rathmann  38 Wolfgang Koenig  39   40   41 Annette Peters  5   40 Wolfgang Weninger  42 Matthias Farlik  42 Tao Zhang  43 Wei Chen  44 Yujing Xia  16 Alexander Teumer  45   46 Matthias Nauck  46   47 Hans J Grabe  48 Macus Doerr  46   49 Terho Lehtimäki  12   13   14 Weihua Guan  50 Lili Milani  51 Toshiko Tanaka  52 Krista Fisher  51   53 Lindsay L Waite  54 Silva Kasela  51 Paolo Vineis  8   21 Niek Verweij  55 Pim van der Harst  56 Licia Iacoviello  57   58 Carlotta Sacerdote  59 Salvatore Panico  60 Vittorio Krogh  61 Rosario Tumino  62 Evangelia Tzala  8 Giuseppe Matullo  63   64 Mikko A Hurme  65 Olli T Raitakari  66   67   68 Elena Colicino  69 Andrea A Baccarelli  70 Mika Kähönen  13   71 Karl-Heinz Herzig  72   73 Shengxu Li  74 BIOS consortiumKaren N Conneely  75 Jaspal S Kooner  76   77 Anna Köttgen  15   32 Bastiaan T Heijmans  78 Panos Deloukas  37 Caroline Relton  11 Ken K Ong  31 Jordana T Bell  16 Eric Boerwinkle  79   80 Paul Elliott  8   21   81   82 Hermann Brenner  9   83 Marian Beekman  84 Daniel Levy  6   7 Melanie Waldenberger  5   40 John C Chambers  8   28   77 Abbas Dehghan  8   21   85 Marjo-Riitta Järvelin  86   87   88   89
Affiliations

DNA methylation signature of chronic low-grade inflammation and its role in cardio-respiratory diseases

Matthias Wielscher et al. Nat Commun. .

Abstract

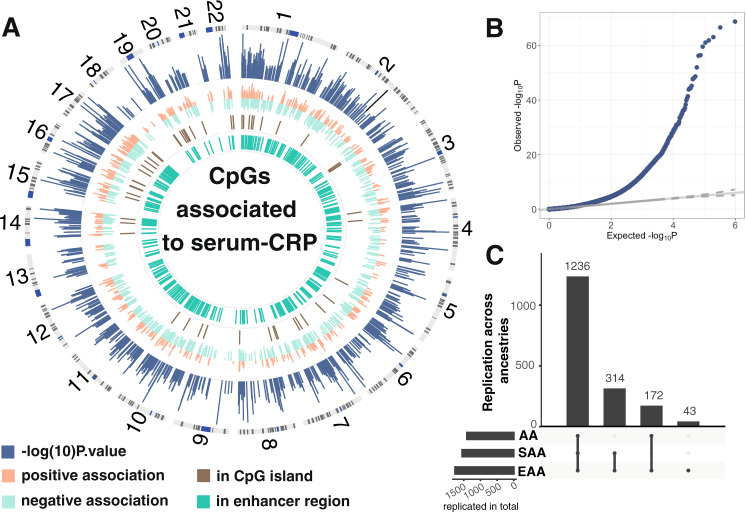
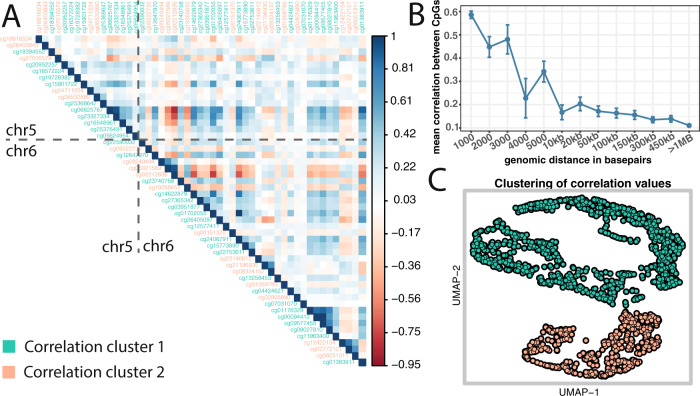
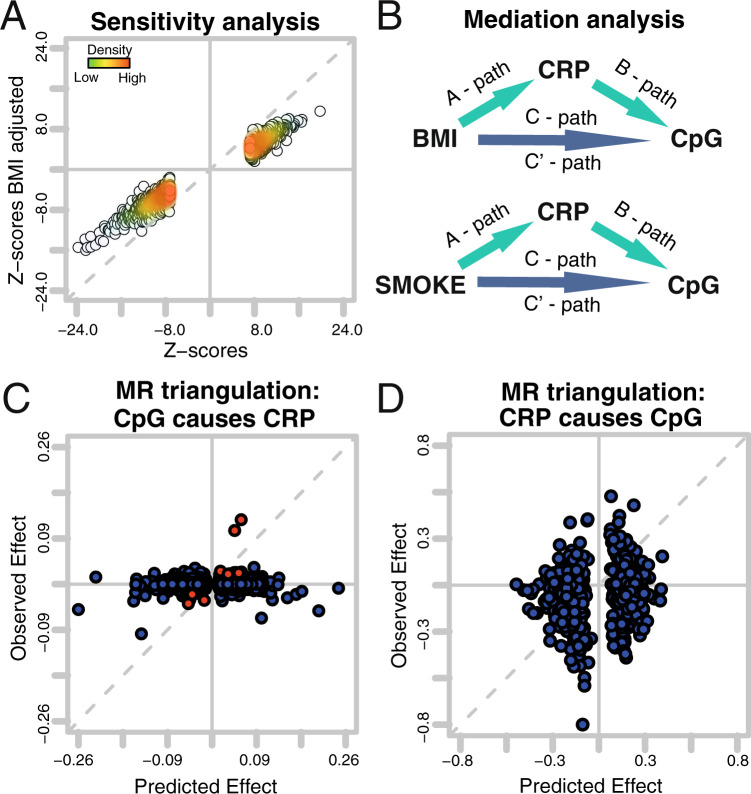
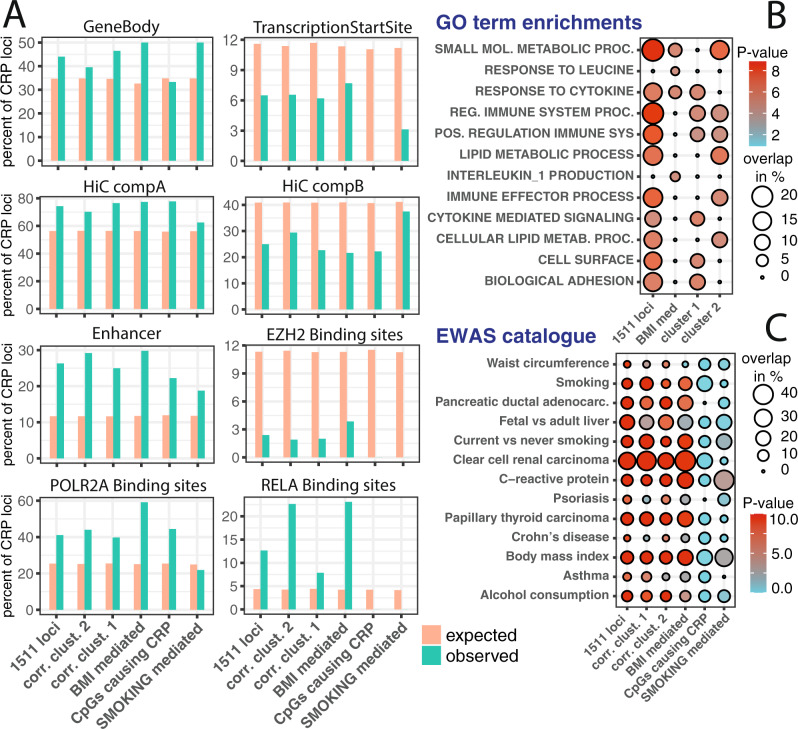
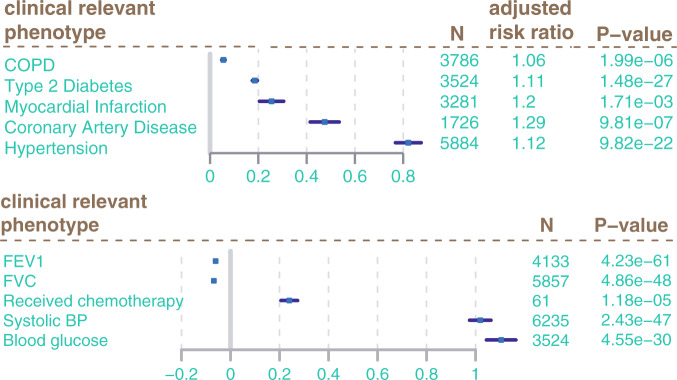
We performed a multi-ethnic Epigenome Wide Association study on 22,774 individuals to describe the DNA methylation signature of chronic low-grade inflammation as measured by C-Reactive protein (CRP). We find 1,511 independent differentially methylated loci associated with CRP. These CpG sites show correlation structures across chromosomes, and are primarily situated in euchromatin, depleted in CpG islands. These genomic loci are predominantly situated in transcription factor binding sites and genomic enhancer regions. Mendelian randomization analysis suggests altered CpG methylation is a consequence of increased blood CRP levels. Mediation analysis reveals obesity and smoking as important underlying driving factors for changed CpG methylation. Finally, we find that an activated CpG signature significantly increases the risk for cardiometabolic diseases and COPD.


Conflict of interest statement

H.J.G. has received travel grants and speakers honoraria from Fresenius Medical Care, Neuraxpharm, Servier, and Janssen Cilag as well as research funding from Fresenius Medical Care. All other study authors declare no competing interests.

Figures

Fig. 1
Fig. 1. Results of multi-ethnic meta-analysis.
Panel A is a circos plot representation of the multi-ethnic meta-analysis. Outermost track is chromosome number followed by ideogram. The second track in blue is the Manhattan plot of the CpG CRP association results. Next track (in orange and light green) are effect sizes of CpG CRP associations, where orange represents positive associations and light green negative. Track represented in brown track color gives the overlap between the 1765 CRP associated CpG markers with CpG island in the genome. The innermost track (in dark green) gives the overlap with enhancer regions as defined by Roadmap project. Panel B is a qqplot of the genomic control corrected P-values from the multi-ethnic meta-analysis. Panel C shows replication rates of 1765 across ancestries. Each bar gives the number of replicated CpGs across ancestries indicated as dots below the barplot. Horizontal bars reflect the total number of replicated CpGs per ancestry group.
Fig. 2
Fig. 2. Correlation structure of CRP-associated CpG methylation.
Panel A gives meta-analyzed correlation values (Pearson Rho) across 4 cohorts. Displayed are all CRP-associated CpGs from a genomic region from chromosome 5 alongside with CRP-associated CpGs on chromosome 6. CpG ids are color-coded according to correlation clusters. Panel B CpGs correlation depending on distance. Correlation values were binned according to their distance to each other. X-axis gives distance between CpGs. Y-axis gives Pearson Rho observed each distance bin. In blue font, we plotted mean and standard errors of Person Rho values. Panel C is a UMAP representation of correlation values of the 1511 independent loci. Dots are color-coded according to their correlation cluster membership.
Fig. 3
Fig. 3. Driving forces of CpG signature.
Panel A is a comparison of Z-scores from the sensitivity analysis. Each dot represents a coefficient from the 1511 CRP-associated loci. The X-axis gives Z-scores derived from base model as applied in multi-ethnic meta-analysis. The Y-axis gives results from the same analysis adjusted for BMI. Panel B gives an overview of applied mediation analysis models. Panels C and D are representations of the Mendelian Randomization triangulation analysis. Each dot represents a CpG. The Y-axis is the observed effect, which is the association between the genetic instrument and outcome. The observed effects for Panel C originate from CpG instruments (SNPs) vs serum CRP levels. The predicted effect is the combined effect from the SNP CpG association and the CpG serum CRP association. Observed effects for D are the associations between a polygenic risk score for CRP (instruments) and CpG methylation. The predicted effects for panel D are the combined effects from the polygenic risk score for CRP (instruments) serum CRP association and serum CRP CpG methylation association (CRPGenetic risk score for CRP association × CRP CpG association). The observed effect is the association of the polygenic risk score for CRP (instruments) to CpG methylation (CRPGenetic risk score for CpG association).
Fig. 4
Fig. 4. Overrepresentation analysis.
Panel A gives the percentage of each CRP-associated gene set that overlaps with selected genomic feature. Orange bars represent overlapping features by chance; green bars give the percentage that actually overlap with the CRP-associated CpGs. Transcription start site and enhancer genomic region were used as defined by the Roadmap project. HiC regions were as reported in GSE63525, where component A was connected to highly transcribed genomic regions and component B to heterochromatin. Panel B shows enrichment analysis between CRP-associated CpG that were significantly associated with mRNA expression. Empirical P-values for the overlap derived from a permutation test (described in more detail in method section “Overrepresentation analysis”) are given as negative log10. Percent overlap indicates the percentage of CpGs present in each GO term set. Panel C gives overlaps between CpGs observed in this study and published gene lists from large scale EWAS.
Fig. 5
Fig. 5. Associations of CRP DNA methylation signature to clinically relevant phenotypes.
Forest plots give estimate from logistic regression (logODDs) and confidence intervals (error bars) of CpG risk score regression against relevant phenotypes. N is the number of samples included in analysis. To produce adjusted relative risk estimates we transformed odds ratios as follows: RR = odds ratio/1 − (lifetime risk) + (life time risk × odds ratio). Those estimates indicate the theoretical maximum impact of the discovered CpG signature (100% DNA methylation change) on the tested traits. The risk conveyed by one percent change in the DNA methylation risk score on the tested traits was 1.007% for COPD, 1.7% for T2D, 2.9% for myocardial infarction 4.3% coronary artery disease, and 0.2% for hypertension. For continuous traits such as FEV1, FVC, systolic BP, and blood glucose estimates from linear regression including confidence intervals are given.

References

    1. Danesh J, et al. Low grade inflammation and coronary heart disease: prospective study and updated meta-analyses. BMJ. 2000;321:199–204. doi: 10.1136/bmj.321.7255.199. - DOI - PMC - PubMed
    1. Dehghan A, et al. Risk of type 2 diabetes attributable to C-reactive protein and other risk factors. Diabetes Care. 2007;30:2695–9. doi: 10.2337/dc07-0348. - DOI - PubMed
    1. Schmidt MI, et al. Markers of inflammation and prediction of diabetes mellitus in adults (Atherosclerosis Risk in Communities study): A cohort study. Lancet. 1999;353:1649–52. doi: 10.1016/S0140-6736(99)01046-6. - DOI - PubMed
    1. Saukkonen T, et al. Adipokines and inflammatory markers in elderly subjects with high risk of type 2 diabetes and cardiovascular disease. Sci. Rep. 2018;8:12816. doi: 10.1038/s41598-018-31144-8. - DOI - PMC - PubMed
    1. Danesh J, et al. C-reactive protein and other circulating markers of inflammation in the prediction of coronary heart disease. N. Engl. J. Med. 2004;350:1387–97. doi: 10.1056/NEJMoa032804. - DOI - PubMed

Publication types

Substances

Grants and funding