. 2022 May 3;13(1):2422.
doi: 10.1038/s41467-022-30101-4.

Simultaneous stabilization of actin cytoskeleton in multiple nephron-specific cells protects the kidney from diverse injury

Affiliations

Simultaneous stabilization of actin cytoskeleton in multiple nephron-specific cells protects the kidney from diverse injury

Kamalika Mukherjee et al. Nat Commun. .

Abstract

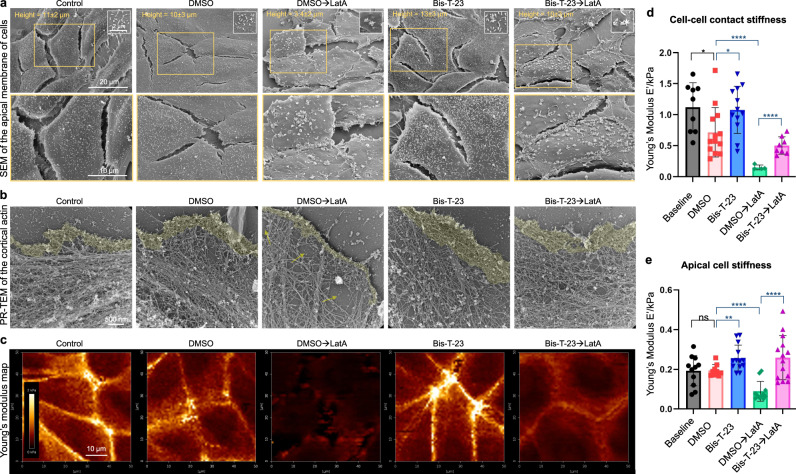
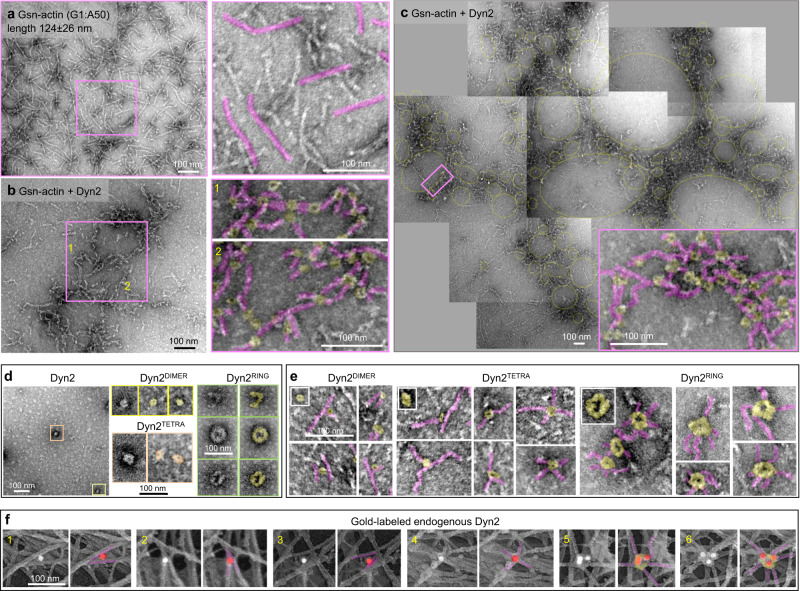
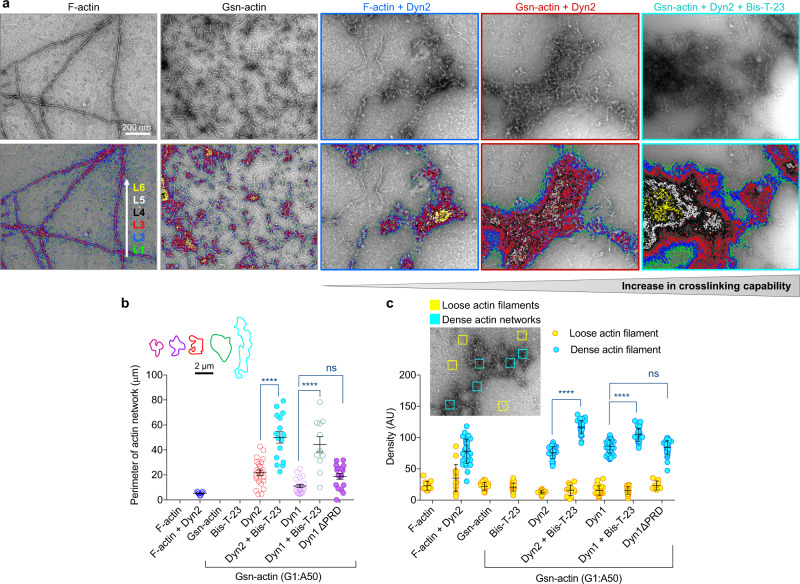
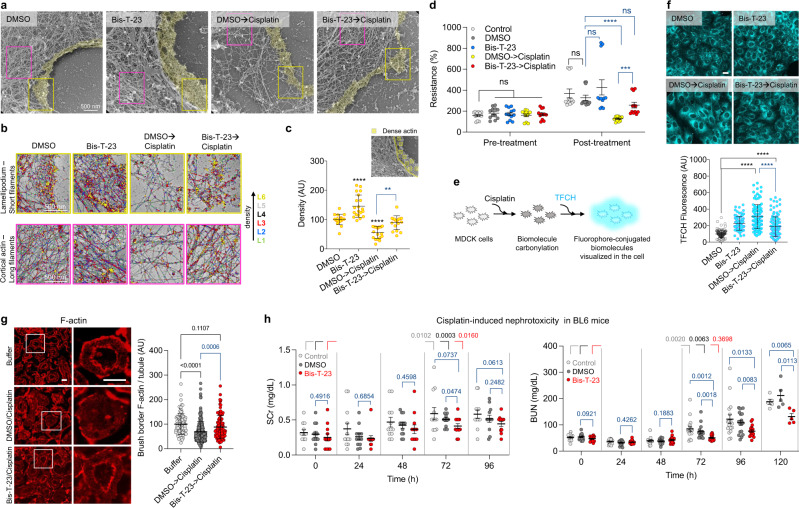
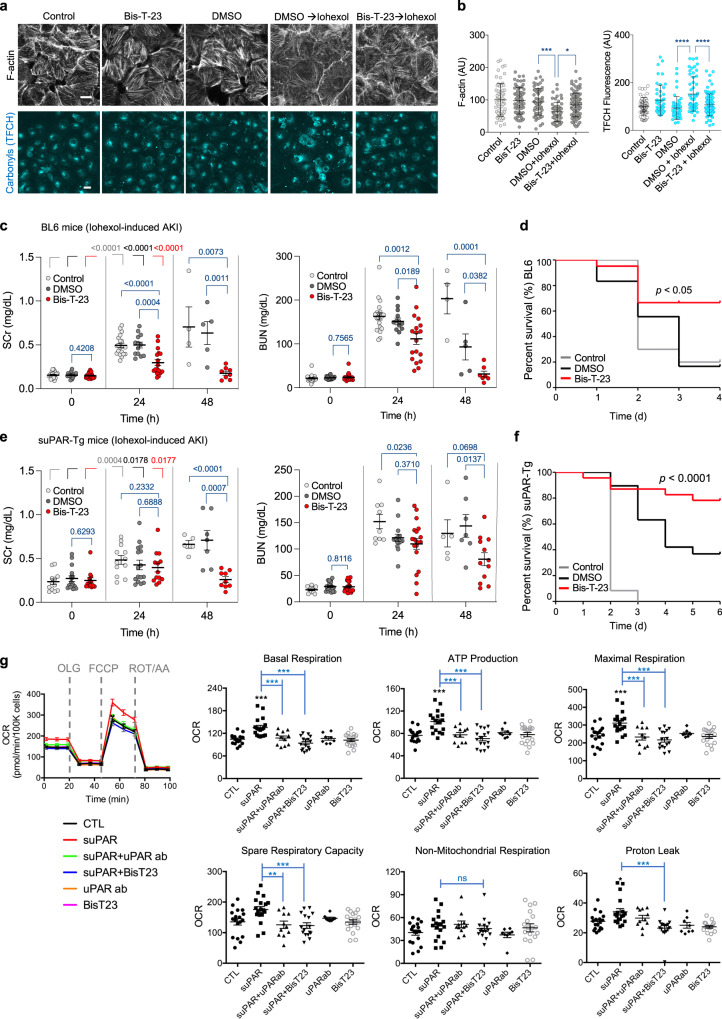
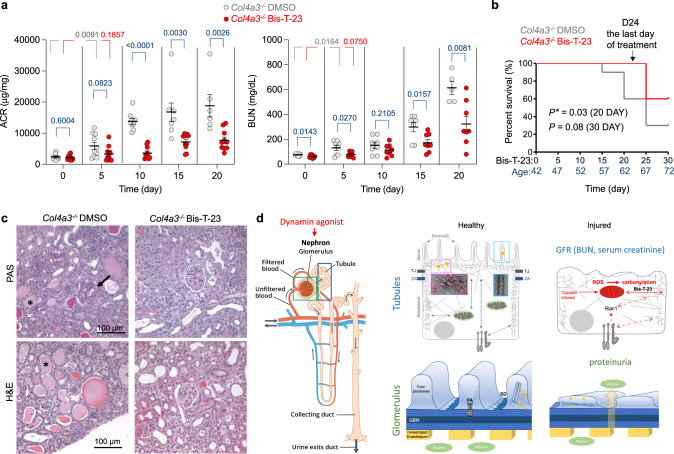
Chronic kidney diseases and acute kidney injury are mechanistically distinct kidney diseases. While chronic kidney diseases are associated with podocyte injury, acute kidney injury affects renal tubular epithelial cells. Despite these differences, a cardinal feature of both acute and chronic kidney diseases is dysregulated actin cytoskeleton. We have shown that pharmacological activation of GTPase dynamin ameliorates podocyte injury in murine models of chronic kidney diseases by promoting actin polymerization. Here we establish dynamin's role in modulating stiffness and polarity of renal tubular epithelial cells by crosslinking actin filaments into branched networks. Activation of dynamin's crosslinking capability by a small molecule agonist stabilizes the actomyosin cortex of the apical membrane against injury, which in turn preserves renal function in various murine models of acute kidney injury. Notably, a dynamin agonist simultaneously attenuates podocyte and tubular injury in the genetic murine model of Alport syndrome. Our study provides evidence for the feasibility and highlights the benefits of novel holistic nephron-protective therapies.


Conflict of interest statement

S.S. and J.R. are co-founders and shareholders of Walden Biosciences, a biotechnology company that develops novel kidney-protective therapies. S.L.B. and K.M. are inventors on a pending patent application pertaining to the detection of oxidative stress-induced carbonylation. The remaining authors declare no competing interests.

Figures

Fig. 1
Fig. 1. Dynamin oligomerization defines cell stiffness by influencing the actin architecture in renal epithelial cells.
a Representative SEM images of MDCK cells treated with DMSO (0.1%) or Bis-T-23 (30 µM, 0.1% DMSO) for 10 min prior to the addition of DMSO (0.1%) or LatA (0.2 µM, 0.1% DMSO) for 20 min. Enlarged images of the insets (orange boxed regions) show the arrangement, distribution, and density of microvilli at the apical membrane. b Representative PR-EM images of MDCK cells treated as explained in (a). The images show changes in the organization of the actomyosin cortex in MDCK cells under the indicated conditions. c Representative images of Young’s Modulus maps of MDCK cells treated as explained in (a). d, e Bar graphs representing Young’s Modulus depicting cell stiffness measured at the cell–cell junction (d) or at the apical membrane (e). Each symbol represents the average stiffness of a single cell. Results shown in d, e were generated from at least 10 cells from at least three culture dishes. Error bars, mean ± S.D. (*P ≤ 0.05, **P ≤ 0.01, ***P ≤ 0.001, ****P ≤ 0.0001, unpaired two-tailed t-test). ns, not significant.
Fig. 2
Fig. 2. Dynamin cross-links actin filaments into branched networks.
ac Representative TEM images of branched actin networks assembled by gelsolin-capped short actin filaments (Gsn-actin) and Dyn2. Gsn-actin (polymerized at the ratio of G1:A50) is shown in (a), and the actin networks assembled in the presence of Dyn2 are shown in (b). Several electron micrographs were stitched together to show the global organization of actin networks formed by Dyn2 in (c). A higher magnification image of the boxed region shows the structural arrangement of actin filaments (pink) and Dyn2 (yellow) within the networks. d Representative micrographs of negatively stained recombinant Dyn2. Boxed higher magnification images show distinct oligomerization states of dynamin: dimeric (yellow), tetrameric (orange), partial/full ring (green). e High magnification images of actin filaments (pink) associated with distinct Dyn2 oligomerization forms (yellow). Insets show images of only Dyn2 at different oligomerization states. f Immunogold platinum replica electron micrographs focusing on actomyosin cortex in MDCK cells. Cellular localization of endogenous Dyn2 was determined by monoclonal Dyn2 antibody and gold-conjugated secondary antibody (white particles). To better visualize the gold particles within tightly packed actin networks, white densities associated with gold particles were pseudo-colored red, and the actin filaments associated with gold particles were pseudo-colored pink. The presence of multiple gold particles identifies the formation of macromolecular dynamin complexes on actin filaments, consistent with the formation of dynamin rings. Representative images of two independent experiments.
Fig. 3
Fig. 3. Dynamin oligomerization status and the length of actin filaments define its cross-linking capability.
a Electron micrograph of actin arrays assembled from F-actin or gelsolin-capped actin filaments (Gsn-actin) by Dyn2 in the presence or absence of Bis-T-23 (0.4 µM). The lower panel shows contour plots depicting density as varying depths within a network. Distinct levels of thickness were color-coded as indicated in the figure. Contour plots were produced based on original EM images in the upper panel. b Bar graph illustrating the size of actin networks shown in (a). The inset shows the representative size (parameter) of actin networks for each condition. 11 to 23 actin networks were analyzed. c Graph depicting the density of the actin filaments incorporated into actin networks (blue) or loosely distributed through the background of the micrograph (yellow). Data were generated by measuring density within a defined square (100 × 100 nm) as shown in the representative insert. Results shown were generated based on EM data shown in (a). 33–45 dense networks (blue squares) and 14–27 loose networks (yellow squares) were counted per condition. Data in (b), (c) are plotted as mean ± S.E.M. and mean ± S.D, respectively (****P < 0.0001, one-way ANOVA with Tukey’s multiple comparison test). ns, not significant.
Fig. 4
Fig. 4. Dynamin agonist protects renal tubules from cisplatin-induced injury by stabilizing the actomyosin cortex at the apical membrane.
a PR-EM image of lamellipodium in MDCK cells treated with DMSO (0.1%) or Bis-T-23 (5 µM, 0.1% DMSO) for 1 h prior to the addition of cisplatin (35 µM) for 23 h. The actomyosin cortex was colored yellow. b Higher magnification images of boxed regions in (a). Distinct levels of thickness are color-coded. The upper and lower panels show networks formed by shorter filaments and longer filaments, respectively. c Graph depicting the density of the actin filaments at the leading edge (yellow box in (a); 18–20 areas counted). d Bar graph depicting relative transepithelial electrical resistance (%) in live MDCK cells treated as stated in (a) except for cisplatin (50 µM) and Bis-T-23 (30 µM) concentrations (12 readings per sample). Data are plotted as mean ± S.E.M. (***P < 0.001, ****P < 0.0001, unpaired two-tailed t-test). ns, not significant. e Schematic representation of oxidative stress-induced carbonylation detection using TFCH assay. f Images showing the levels of biomolecule carbonyls determined by TFCH. Cells were treated as described in (a) except for cisplatin concentration (5 µM). Scale bar, 20 µm. Graph depicting the relative levels of TFCH fluorescence associated with biomolecule carbonyls per cell (data points (n) = 83–116; each point represents average intensity of 4–9 cells). g Rat kidney slices stained with anti-actin antibody. Kidney slices were incubated in buffer, DMSO (0.1%), or Bis-T-23 (30 µM) for 1 h before adding cisplatin (200 µM) or buffer for 8 h. White squared regions were enlarged. Scale bars, 40 µm. Graph showing F-actin intensity at the brush border per tubule (100-236). For c, f, g, data are plotted as mean ± S.D. (P values are reported in the Figure, one-way ANOVA with Tukey’s multiple comparison test). h Scatter dot plots showing AKI induced by cisplatin determined by the level of blood urea nitrogen (BUN) or serum creatinine (SCr). Animals were injected with either DMSO (1%) or Bis-T-23 (20 mg/kg) (n = 12, per condition for SCr; n = 17, per condition for BUN) once a day starting 24 h prior to cisplatin (15 mg/kg) injection. The measurements were performed at the indicated times. Data are plotted as mean ± S.E.M. (P values are reported in the Figure, unpaired two-tailed t-test). ns, not significant.
Fig. 5
Fig. 5. Dynamin agonist counteracts Iohexol-induced AKI.
a Status of F-actin and biomolecule carbonylation in HK-2 cells. HK-2 cells were treated with medium (Control), DMSO (0.1%), or Bis-T-23 (10 µM, 0.1% DMSO) for 1 h. The medium was replaced with only medium or medium containing Iohexol+DMSO (250 mg/mL (F-actin set) and 100 mg/mL (TFCH assay)) or iohexol+Bis-T-23 for ~3 h. Scale bar, 20 μm. b Graphs depicting the relative levels of F-actin within a fixed region of interest (ROI) in the cells (58–98 ROI analyzed) TFCH fluorescence (cellular biomolecule carbonyls) (data points (n) = 46–83; each point represents average intensity of 1–4 cells). Error bars, mean ± S.D. (*P < 0.05, ***P < 0.001 ****P < 0.0001, one-way ANOVA with Tukey’s multiple comparison test). c, e Scatter dot plots showing AKI induced by Iohexol (5 g/kg) determined by the level of SCr or BUN in BL6 wild-type mice (c, d) or suPAR-Tg mice (e, f). c, e Error bars, mean ± S.E.M. (P values are reported in the Figure, unpaired two-tailed t-test). As indicated, animals were injected with either DMSO (1%) or Bis-T-23 (20 mg/kg) once a day starting at 0 h. The measurements were performed at the indicated times. Number of animals per condition in c: BL6 control (n = 20), DMSO (n = 18), and Bis-T-23 (n = 21). Number of animals per condition in (e): suPAR-Tg control (n = 12 for BUN or SCr), DMSO (n = 19 for BUN; n = 16 for SCr), and Bis-T-23 (n = 20 for BUN; n = 13 for Scr). d, f Log-Rank (Mantel-cox) test was performed to analyze survival curves of animals treated as described in (c), (e). P was calculated using an unpaired two-tailed t-test. g Oxygen consumption rate (OCR) curves and Seahorse XF analyzer measurements of mitochondrial respiration of HK-2 cells. HK-2 cells were treated with suPAR (10 ng/ml), human anti-uPAR antibody (50 ng/ml), or Bis-T-23 (10 µM) alone or in combination for 24 h. OCR was measured in real-time under basal conditions and in response to sequential injections of mitochondrial inhibitors including oligomycin (OLG; an ATP synthase inhibitor), FCCP (an uncoupler of ATP synthesis from oxygen consumption), rotenone (ROT; complex I inhibitor), and antimycin A (AA; complex III inhibitor). Each OCR value was normalized to cell number and is presented as pm/min/100,000 cells. Graphs represent three independent experiments and are derived from the mean values (S.E.M.) of at least 8 replicates per group. Error bars, mean ± S.E.M. (**P < 0.01, ***P < 0.001, one-way ANOVA). ns, not significant.
Fig. 6
Fig. 6. Pharmacological activation of dynamin simultaneously targets the actin cytoskeleton in two distinct cells of the nephron.
a Col4a3−/− mice were injected with DMSO (1%) or Bis-T-23 (20 mg/kg) once a day when 42 days old (Day 0). An equal number of DMSO or Bis-T-23 treated mice (n = 10 for ACR; n = 8 for BUN) was used. The scatter dot plot shows the level of proteinuria (albumin to creatinine ratio, ACR) and kidney injury determined by the level of BUN. Error bars, mean ± S.D. (P values are reported in the Figure, unpaired two-tailed t-test). b Log-Rank (Mantel-cox) test was performed to analyze the survival curves of the two treatment groups. c Representative histopathology of kidney determined by periodic acid-Schiff (PAS) and H&E staining on samples obtained from Col4a3−/− mice described in (a). Animals were 62 days old (day 20 of Bis-T-23 or DMSO treatment). Glomerulopathy in Col4a3−/− DMSO-treated animals was characterized by mesangial expansion observed on the PAS staining (black arrow), increased cellularity, and an increase in Bowman’s space. Degenerative changes in tubules included the formation of casts (*) and the presence of tubular sclerosis. Bis-T-23 treatment over 20 days partially preserved the morphology of glomeruli (diminished mesangial expansion) and tubules (absence of casts). d Schematics of the nephron (image credited to National Institute of Diabetes and Digestive and Kidney Diseases, National Institutes of Health) and the mechanism involved in dynamin regulated reno-protection. In polarized epithelial cells of renal tubules, dynamin establishes cell polarity by cross-linking actin filaments into networks (this study). Dynamin’s ability to cross-link filaments into bundles is implicated in the formation of microvilli. Acute injury increases ROS production, alters cell metabolism, and perturbs the actin dynamics, which further enhances ROS production leading to more pronounced cellular oxidative damage (biomolecule carbonylation). An increase in dynamin’s cross-linking capability in the actomyosin cortex preserves tubular cell integrity, which partially protects them from oxidative insult. Additionally, dynamin is essential for the structure and function of podocytes. Pharmacological activation of dynamin restores foot processes by inducing actin polymerization. Our study shows that pharmacological activation of dynamin oligomerization exhibits a dual beneficial effect on the nephron by targeting two distinct molecular mechanisms: preservation of the integrity of podocytes (actin polymerization) and renal tubular cells (cross-linking of actin filaments).

References

    1. Basile DP, Anderson MD, Sutton TA. Pathophysiology of acute kidney injury. Compr. Physiol. 2012;2:1303–1353. doi: 10.1002/cphy.c110041. - DOI - PMC - PubMed
    1. Bonventre JV, Yang L. Cellular pathophysiology of ischemic acute kidney injury. J. Clin. Invest. 2011;121:4210–4221. doi: 10.1172/JCI45161. - DOI - PMC - PubMed
    1. Campanale JP, Sun TY, Montell DJ. Development and dynamics of cell polarity at a glance. J. Cell Sci. 2017;130:1201–1207. doi: 10.1242/jcs.188599. - DOI - PMC - PubMed
    1. Salbreux G, Charras G, Paluch E. Actin cortex mechanics and cellular morphogenesis. Trends Cell Biol. 2012;22:536–545. doi: 10.1016/j.tcb.2012.07.001. - DOI - PubMed
    1. Vicente-Manzanares M, Ma X, Adelstein RS, Horwitz AR. Non-muscle myosin II takes centre stage in cell adhesion and migration. Nat. Rev. Mol. Cell Biol. 2009;10:778–790. doi: 10.1038/nrm2786. - DOI - PMC - PubMed

Publication types