. 2022 May 4;79(5):276.
doi: 10.1007/s00018-022-04301-6.

New insights into the molecular mechanisms of ROR1, ROR2, and PTK7 signaling from the proteomics and pharmacological modulation of ROR1 interactome

Affiliations

New insights into the molecular mechanisms of ROR1, ROR2, and PTK7 signaling from the proteomics and pharmacological modulation of ROR1 interactome

Juuli Raivola et al. Cell Mol Life Sci. .

Abstract

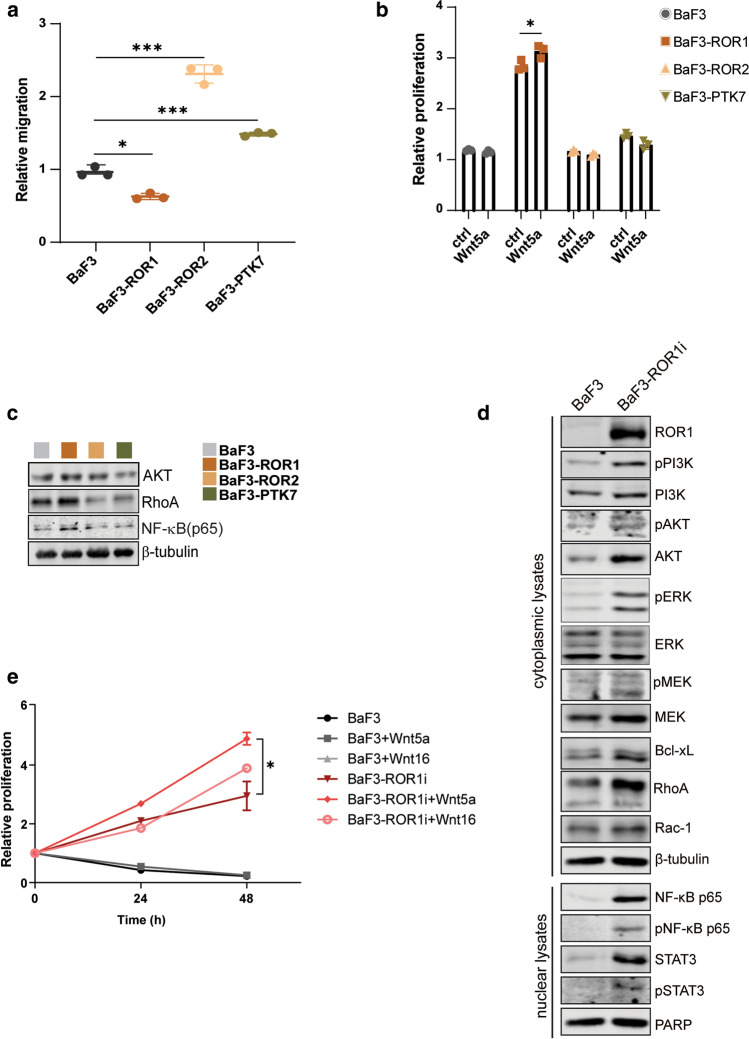
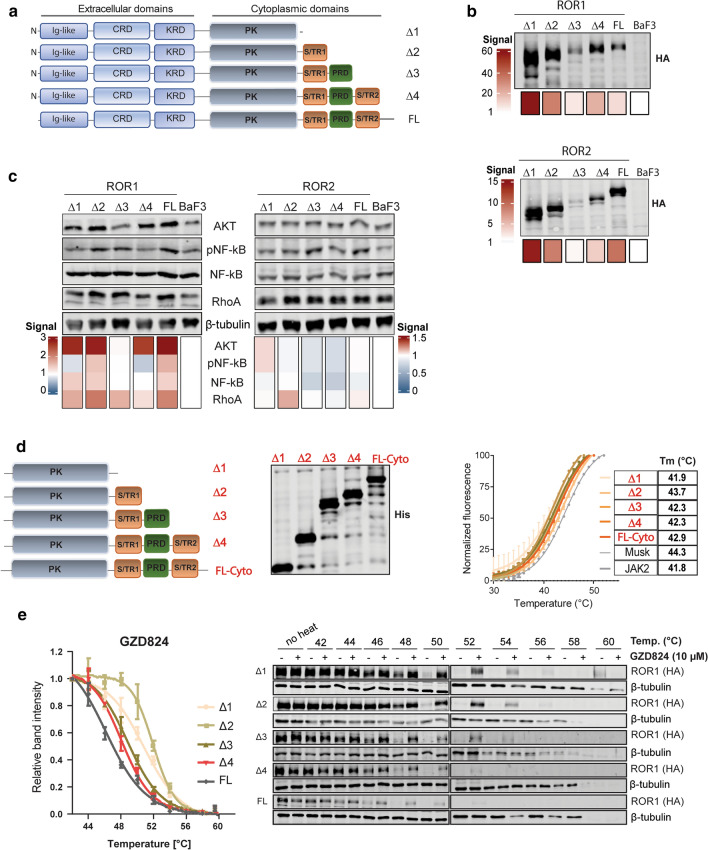
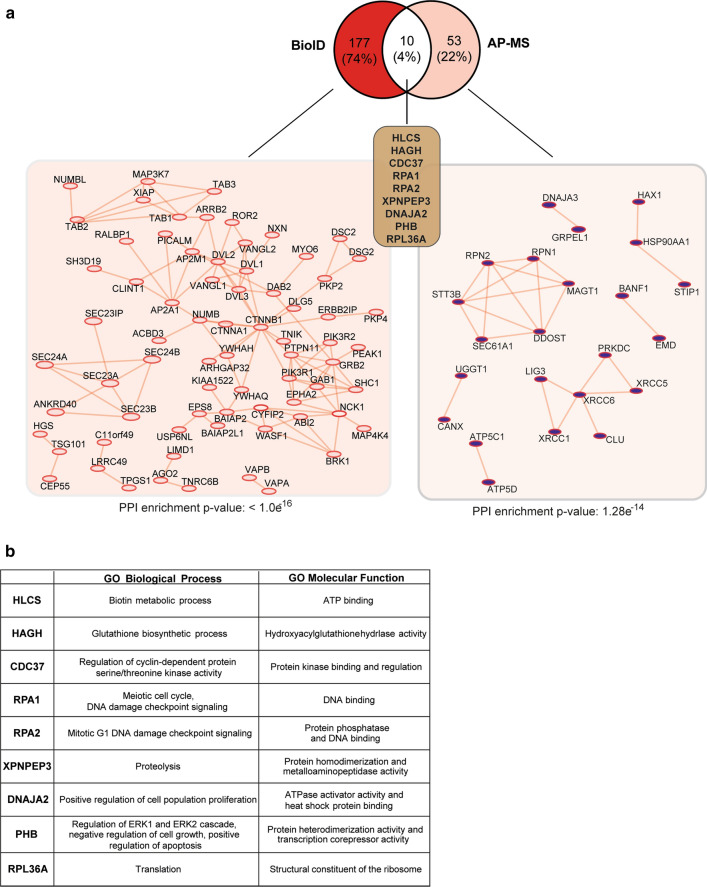
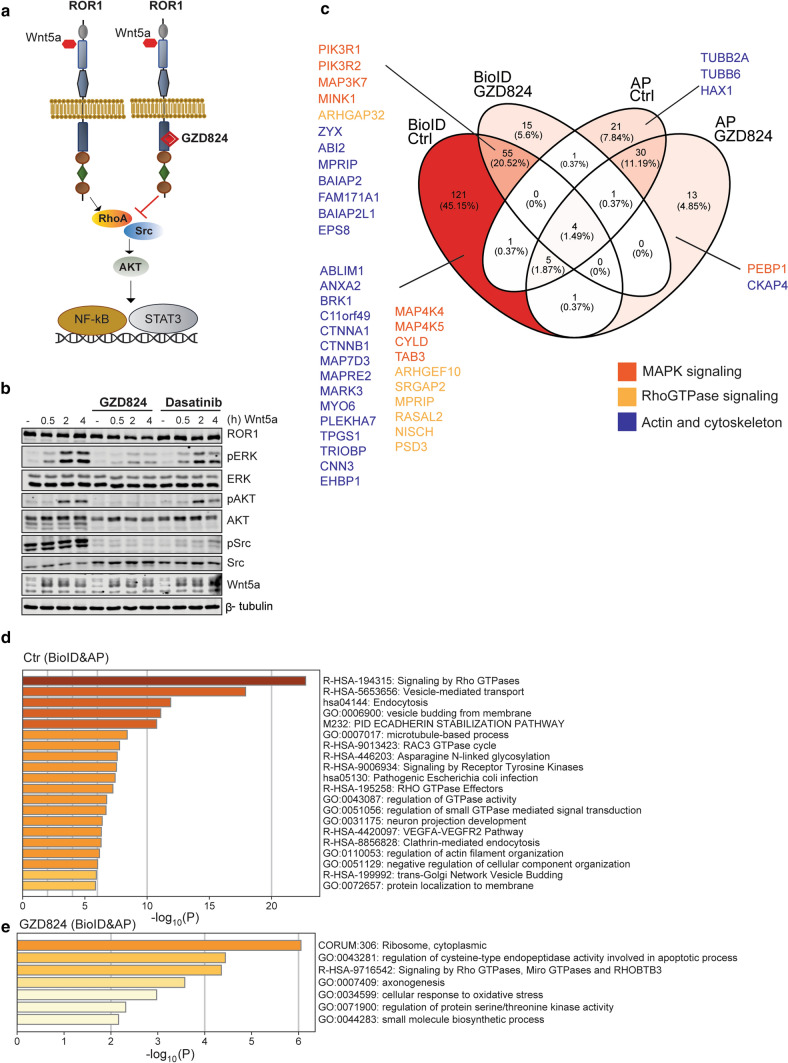
ROR1, ROR2, and PTK7 are Wnt ligand-binding members of the receptor tyrosine kinase family. Despite their lack of catalytic activity, these receptors regulate skeletal, cardiorespiratory, and neurological development during embryonic and fetal stages. However, their overexpression in adult tissue is strongly connected to tumor development and metastasis, suggesting a strong pharmacological potential for these molecules. Wnt5a ligand can activate these receptors, but lead to divergent signaling and functional outcomes through mechanisms that remain largely unknown. Here, we developed a cellular model by stably expressing ROR1, ROR2, and PTK7 in BaF3 cells that allowed us to readily investigate side-by-side their signaling capability and functional outcome. We applied proteomic profiling to BaF3 clones and identified distinctive roles for ROR1, ROR2, and PTK7 pseudokinases in modulating the expression of proteins involved in cytoskeleton dynamics, apoptotic, and metabolic signaling. Functionally, we show that ROR1 expression enhances cell survival and Wnt-mediated cell proliferation, while ROR2 and PTK7 expression is linked to cell migration. We also demonstrate that the distal C-terminal regions of ROR1 and ROR2 are required for receptors stability and downstream signaling. To probe the pharmacological modulation of ROR1 oncogenic signaling, we used affinity purification coupled to mass spectrometry (AP-MS) and proximity-dependent biotin identification (BioID) to map its interactome before and after binding of GZD824, a small molecule inhibitor previously shown to bind to the ROR1 pseudokinase domain. Our findings bring new insight into the molecular mechanisms of ROR1, ROR2, and PTK7, and highlight the therapeutic potential of targeting ROR1 with small molecule inhibitors binding to its vestigial ATP-binding site.

Keywords: CETSA; GZD824; Kinase inhibitors; PTK7; ROR1; ROR2; Receptor pseudokinases; TSA; Wnt signaling.


Conflict of interest statement

The authors have no relevant financial or non-financial interests to disclose.

Figures

Fig. 1
Fig. 1
Proteomics analysis of ROR1, ROR2, and PTK7 transfected BaF3 cells. a Principal component analysis (PCA) showing phenotypic similarity between BaF3-ROR1 and BaF3-ROR2 biological replicates, but not among the parental BaF3 and BaF3-PTK7 clones. b Heatmap of differentially expressed proteins (DEP) log2 fold change with respect to the parental BaF3 samples. The DEPs shared among BaF3-ROR1, -ROR2, and -PTK7 are shown. c Volcano plots reporting the log2 fold change of the DEPs between the parental BaF3 cells and BaF3 clones. Adjusted p value < 0.05 and log2FC >|0.5|. d Similarity matrix (shown as a heatmap) among GO biological processes related to DEPs of each BaF3 clone. The apoptotic- and metabolic-related processes are highlighted. The heatmaps in b and d are clustered using complete-linkage hierarchical clustering based on Euclidean distances
Fig. 2
Fig. 2
Functional analysis of BaF3-ROR1, BaF3-ROR2, and BaF3-PTK7 clones. a Migration assay of BaF3 clones toward CXCL12 chemokine for 6 h. The graph shows the relative number of migrated cells normalized to BaF3 parental migrated cells. Data are represented as mean ± standard deviation (SD) and statistical comparison was performed with Student’s t test (n = 3). b Relative survival of BaF3 cells cultured in starvation media (no serum and no IL-3) in the presence or absence of Wnt5a (100 ng/ml) for 24 h. The graph shows mean ± SD (n = 3). In a and b, the statistical significance is indicated as *p < 0.05 and ***p < 0.001. c Immunoblotting analysis of the intracellular signaling in BaF3 parental cells and BaF3 clones expressing ROR1, ROR2, or PTK7. β-tubulin was used as a loading control. d Immunoblotting analysis of the cytoplasmic and nuclear lysates of BaF3-ROR1i clones that acquired IL-3 independence. Antibodies against the effectors of the pro-survival signaling were used to detect the protein levels and β-tubulin was used as a loading control for the cytoplasmic lysates, whereas PARP was used as a loading control for the nuclear lysates. e The relative proliferation of BaF3 parental and BaF3-ROR1i clone stimulated with 100 ng/ml Wnt5a or Wnt16b. Proliferation was measured at the indicated time points and the values were normalized to non-stimulated cells (set as value 1). The graph shows the mean ± SD (n = 3). Statistical comparison between the non-stimulated and Wnt-stimulated BaF3-ROR1i cells was done using Student’s t test as *p < 0.05
Fig. 3
Fig. 3
Characterization of the C-terminal cytoplasmic region of ROR1 and ROR2. a Schematic representation of amino acid boundaries of ROR1 and ROR2 C-terminal deletions (Δ1–Δ4) and the full-length (FL) receptors stably transfected into BaF3 cells. b Immunoblot analysis of the HA-tagged ROR1 and ROR2 FL and Δ1–Δ4 deletions expressed in BaF3 cells cultured for 24 h in starvation media. β-tubulin was used as a loading control and the signal quantifications shows the normalized values using BaF3 (set as 1). c Immunoblotting analysis of downstream signaling of BaF3-ROR1 and BaF3-ROR2 (FL and Δ1–Δ4) clones. β-tubulin was used as a loading control and signal quantifications show the normalized values using BaF3 samples. d Left: schematic representation of the cytoplasmic ROR1 constructs used for recombinant protein production. Expression levels of the His-tagged constructs were verified by immunoblotting. Right: DSF analysis of recombinant ROR1 constructs. Melting temperatures (Tm) are also indicated, and the data represent the mean ± SD (n = 3). JAK2 PK domain and MuSK kinase domain was used as a reference control. e Cellular thermal shift assay (CETSA) showing stabilization of ROR1 (FL and Δ1–Δ4) upon treatment with GZD824 (10 µM). Cell lysates were heated to the indicated temperatures and immunoblotted with anti-HA for ROR1 detection. β-tubulin was used as a loading control. The graph shows the signal quantification of 3 independent experiments (mean ± SD). Band intensities were normalized to the 42 °C untreated samples for each ROR1 construct (set as 1)
Fig. 4
Fig. 4
ROR1 interactome detected by BioID and AP-MS. a Venn diagram showing the number of specific ROR1 interactors identified with BioID (red), AP-MS (pink), or both (white). The respective physical interactomes and enrichment p values were obtained with STRING (reference as reported in the methods chapter). b List of selected GO biological processes and molecular functions associated with the ROR1 interactors and identified with both BioID and AP-MS
Fig. 5
Fig. 5
GZD824 inhibits downstream signaling of ROR1. a Schematic representation of GZD824 binding to ROR1 PK domain, which induces inhibition of its downstream PI3K/AKT, STAT3, and NF-κB signaling. b Immunoblot analysis of the BaF3-ROR1 cells left untreated of pre-treated with Src inhibitor dasatinib or GZD824 (1 µM) for 2 h before the addition of Wnt5a (100 ng/ml) as indicated. Downstream ROR1 signaling levels or pERK/ERK, pAKT/AKT, and pSrc/Src are shown. β-tubulin was used as a loading control. c Venn diagram showing the number of shared and specific interactors of ROR1 before and after GZD284 treatment as identified by AP-MS, BioID, or both. For each set of interactors, the protein-coding genes involved in MAPK signaling (red), Rho GTPases signaling (yellow), or actin/cytoskeleton signaling (blue) are indicated. d, e Bar graphs of the top non-redundant enriched ontology clusters from multiple functional annotation databases in ROR1 interactomes identified with both AP-MS and BioID when before (d) and after (e) GZD824 treatment. The color scale represents statistical significance

References

    1. Lemmon MA, Schlessinger J. Cell signaling by receptor tyrosine kinases. Cell. 2010;141(7):1117–1134. doi: 10.1016/j.cell.2010.06.011. - DOI - PMC - PubMed
    1. Murphy JM, et al. A robust methodology to subclassify pseudokinases based on their nucleotide-binding properties. Biochem J. 2014;457(2):323–334. doi: 10.1042/BJ20131174. - DOI - PMC - PubMed
    1. Sheetz JB, et al. Structural insights into pseudokinase domains of receptor tyrosine kinases. Mol Cell. 2020;79(3):390–405.e7. doi: 10.1016/j.molcel.2020.06.018. - DOI - PMC - PubMed
    1. Kung JE, Jura N. Prospects for pharmacological targeting of pseudokinases. Nat Rev Drug Discovery. 2019;18(7):501–526. doi: 10.1038/s41573-019-0018-3. - DOI - PMC - PubMed
    1. Menck K, Heinrichs S, Baden C, Bleckmann A. The WNT/ROR pathway in cancer: from signaling to therapeutic intervention. Cells. 2021;10:1. doi: 10.3390/cells10010142. - DOI - PMC - PubMed

MeSH terms

Substances