. 2022 May 3;12(1):7170.
doi: 10.1038/s41598-022-11302-9.

A comparison of strategies for generating artificial replicates in RNA-seq experiments

Affiliations

A comparison of strategies for generating artificial replicates in RNA-seq experiments

Babak Saremi et al. Sci Rep. .

Abstract

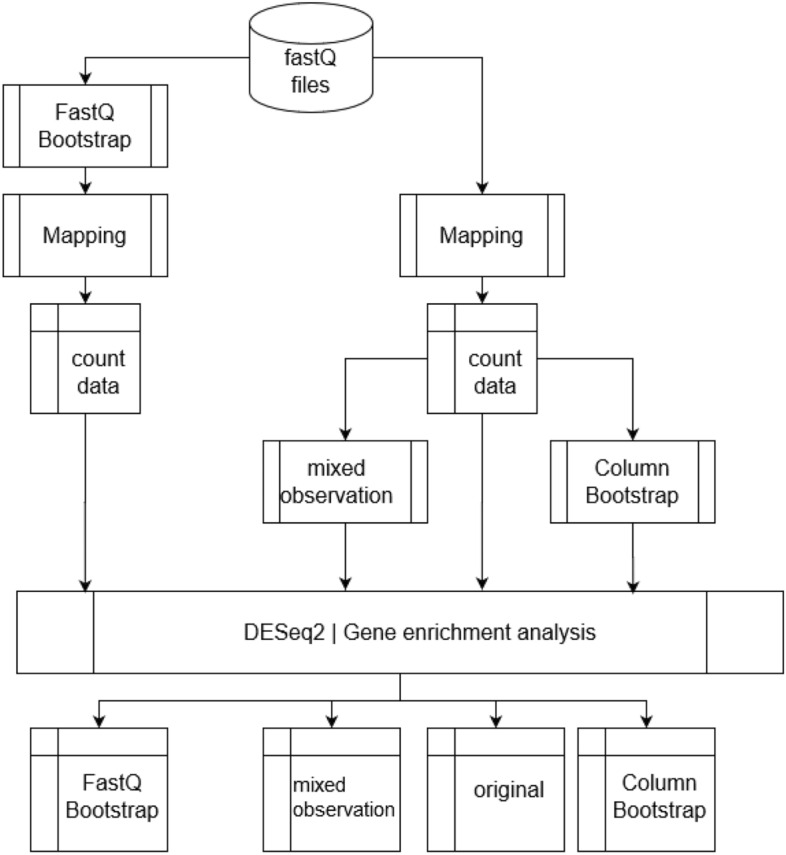
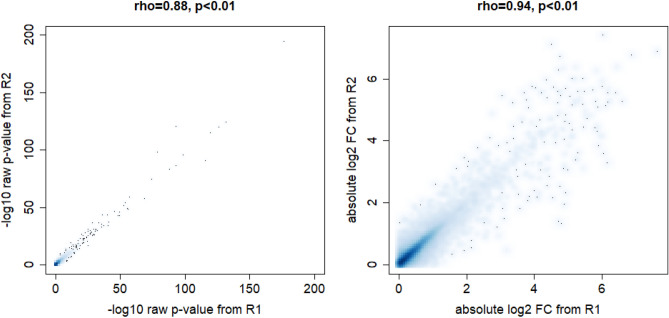
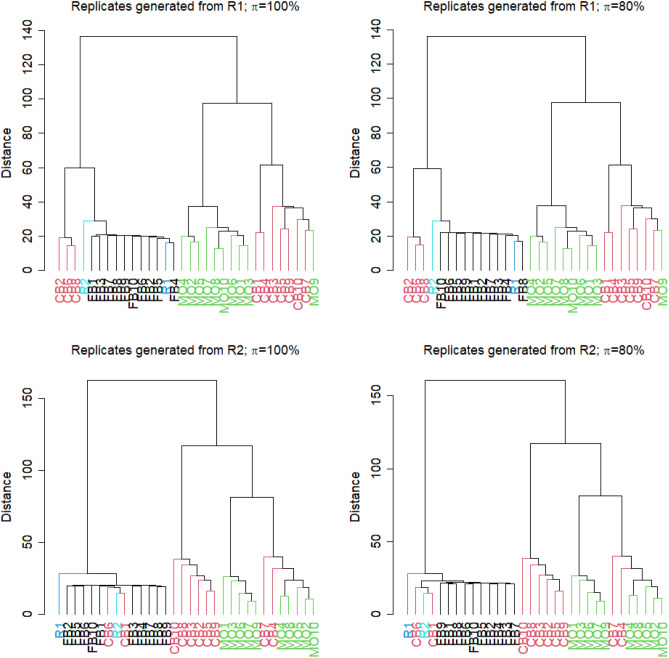
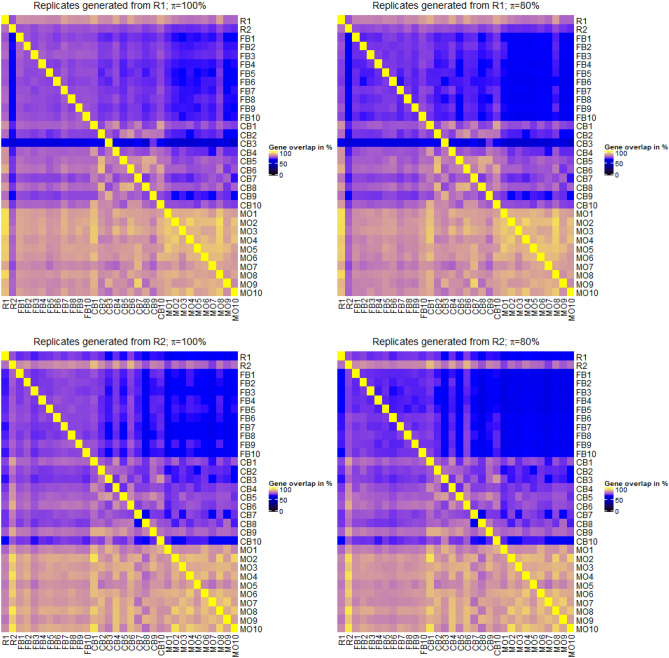
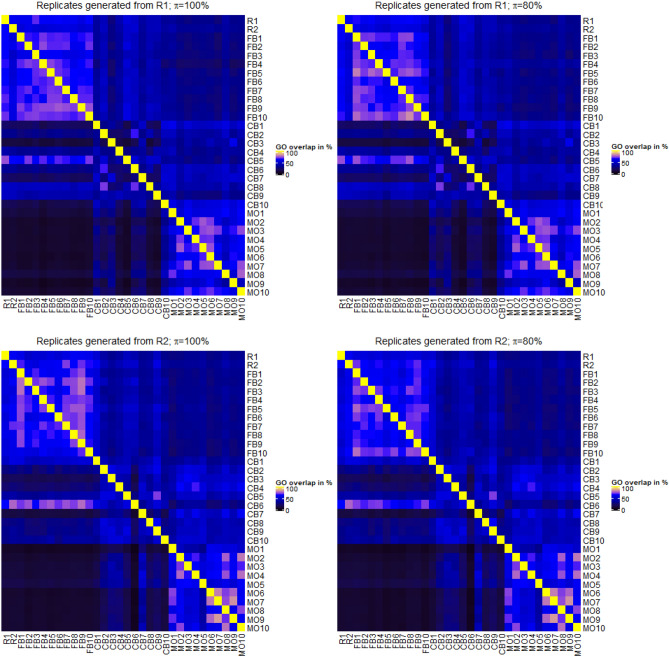
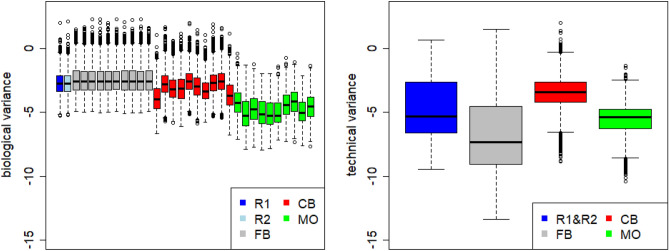
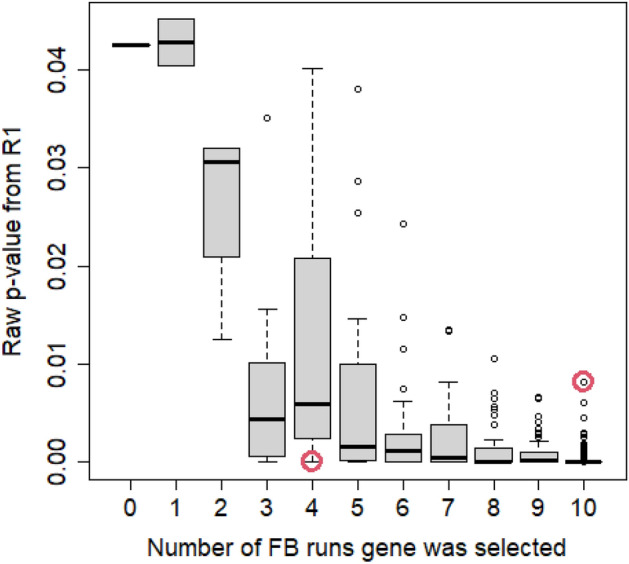
Due to the overall high costs, technical replicates are usually omitted in RNA-seq experiments, but several methods exist to generate them artificially. Bootstrapping reads from FASTQ-files has recently been used in the context of other NGS analyses and can be used to generate artificial technical replicates. Bootstrapping samples from the columns of the expression matrix has already been used for DNA microarray data and generates a new artificial replicate of the whole experiment. Mixing data of individual samples has been used for data augmentation in machine learning. The aim of this comparison is to evaluate which of these strategies are best suited to study the reproducibility of differential expression and gene-set enrichment analysis in an RNA-seq experiment. To study the approaches under controlled conditions, we performed a new RNA-seq experiment on gene expression changes upon virus infection compared to untreated control samples. In order to compare the approaches for artificial replicates, each of the samples was sequenced twice, i.e. as true technical replicates, and differential expression analysis and GO term enrichment analysis was conducted separately for the two resulting data sets. Although we observed a high correlation between the results from the two replicates, there are still many genes and GO terms that would be selected from one replicate but not from the other. Cluster analyses showed that artificial replicates generated by bootstrapping reads produce it p values and fold changes that are close to those obtained from the true data sets. Results generated from artificial replicates with the approaches of column bootstrap or mixing observations were less similar to the results from the true replicates. Furthermore, the overlap of results among replicates generated by column bootstrap or mixing observations was much stronger than among the true replicates. Artificial technical replicates generated by bootstrapping sequencing reads from FASTQ-files are better suited to study the reproducibility of results from differential expression and GO term enrichment analysis in RNA-seq experiments than column bootstrap or mixing observations. However, FASTQ-bootstrapping is computationally more expensive than the other two approaches. The FASTQ-bootstrapping may be applicable to other applications of high-throughput sequencing.


Conflict of interest statement

The authors declare no competing interests.

Figures

Figure 1
Figure 1
Workflow of generating replicates by the different strategies. While the MO and CB approach are based on the read count data obtained after mapping, the FB approach starts directly with the reads from the FASTQ-files. Finally, the original results of differentially expression analysis and gene-set analysis are compared with the results obtained with the artificial replicates. The diagram was drawn using the software ‘diagrams’ (version 16.2.7, www.diagrams.net).
Figure 2
Figure 2
Smooth scatterplots of raw, gene-wise it p values generated from true experimental replicates R1 and R2 (left), and of absolute log2 fold changes (right). Spearman correlations between R1 and R2 are high, showing in principle a similar ranking of genes between technical replicates in an RNA-seq experiment. However, the plots also show a high number of genes which diviate stronger from the bisecting line, i.e. genes which would be selected by one experimental replicate but not by the other.
Figure 3
Figure 3
Cluster trees of it p value lists, where similarity of it p value lists was specified using Spearman’s correlation coefficient ρ. R1 and R2 denote the it p value lists obtained from the differential expression analysis of the original two replicates. FB1 to FB10 are the it p value lists from the approach of generating technical replicates by boostrapping reads from FASTQ-files. CB1 to CB10 denote the results after column boostrap and MO1 to MO10 denote the results obtained by the mixing observation approach. Cluster trees were generated either when artificial replicates were generated from R1 (top) or from R2 (bottom). Furthermore, FB replicates were either sampled with π=100% or π=80% of reads from the original FASTQ-files.
Figure 4
Figure 4
Cluster trees of log2 fold changes, where similarity of absolute log2 fold changes lists was specified using Spearman’s correlation coefficient ρ. R1 and R2 denote the log2 fold changes obtained from the differential expression analysis of the original two replicates. FB1 to FB10 are the log2 fold changes from the approach of generating technical replicates by boostrapping reads from FASTQ-files. CB1 to CB10 denote the results after column boostrap and MO1 to MO10 denote the results obtained by the mixing observation approach. Cluster trees were generated either when artificial replicates were generated from R1 (top) or from R2 (bottom). Furthermore, FB replicates were either sampled with π=100% or π=80% of reads from the original FASTQ-files.
Figure 5
Figure 5
Heatmaps reflecting the overlap of selected differentially expressed genes from true experimental replicates R1 and R2 as well as from the artificial replicates with the three different approaches. Again, heatmaps are shown when artificial replicates were generated from R1 (top) or R2 (bottom) and with different values π for the FB apprach. Overlap is given in percent of genes detected in a comparison analysis (column) with respect to an reference analysis (row). Exemplarily, the interpretation for the plot top left is as follows. Replicates were generated from the data of R1 with the purpose of obtaining similar results as from R2, which is shown in the second line. Here, FB and CB results show a stronger overlap with R2 than results from the MO strategy. Heatmaps were drawn using the R-package ‘ComplexHeatmap’ (version 2.6.2., www.bioconductor.org).
Figure 6
Figure 6
Heatmaps reflecting the overlap of selected enriched GO terms in the same way as the heatmaps of differentially expressed genes. Heatmaps were drawn using the R-package ‘ComplexHeatmap’ (version 2.6.2., www.bioconductor.org).
Figure 7
Figure 7
Left: distribution of gene-wise dispersions estimated in the real and artificial data sets. These dispersions reflect the biological variance of the nine samples. Right: distribution of gene-wise dispersions between true replicates R1 and R2, as well as between all FB, all CB and all MO samples. These distributions reflect the variance between each set of replicates.
Figure 8
Figure 8
Raw it p values of 628 genes selected as differentially expressed by in the R1 data set versus number of runs with artificially replicates generated by the FB approach.

References

    1. Wang Z, Gerstein M, Snyder M. Rna-seq: A revolutionary tool for transcriptomics. Nat. Rev. Genet. 2009;10(1):57–63. doi: 10.1038/nrg2484. - DOI - PMC - PubMed
    1. Robinson MD, McCarthy DJ, Smyth GK. edger: A bioconductor package for differential expression analysis of digital gene expression data. Bioinformatics. 2010;26(1):139–140. doi: 10.1093/bioinformatics/btp616. - DOI - PMC - PubMed
    1. Love MI, Huber W, Anders S. Moderated estimation of fold change and dispersion for RNA-seq data with DESeq2. Genome Biol. 2014;15(12):1–21. doi: 10.1186/s13059-014-0550-8. - DOI - PMC - PubMed
    1. Marioni JC, Mason CE, Mane SM, Stephens M, Gilad Y. RNA-seq: An assessment of technical reproducibility and comparison with gene expression arrays. Genome Res. 2008;18(9):1509–1517. doi: 10.1101/gr.079558.108. - DOI - PMC - PubMed
    1. McIntyre LM, Lopiano KK, Morse AM, Amin V, Oberg AL, Young LJ, Nuzhdin SV. RNA-seq: technical variability and sampling. BMC Genomics. 2011;12(1):1–13. doi: 10.1186/1471-2164-12-293. - DOI - PMC - PubMed

Publication types

MeSH terms