. 2022 May 3;5(1):408.
doi: 10.1038/s42003-022-03339-3.

Dietary intervention improves health metrics and life expectancy of the genetically obese Titan mouse

Affiliations

Dietary intervention improves health metrics and life expectancy of the genetically obese Titan mouse

Annika Müller-Eigner et al. Commun Biol. .

Abstract

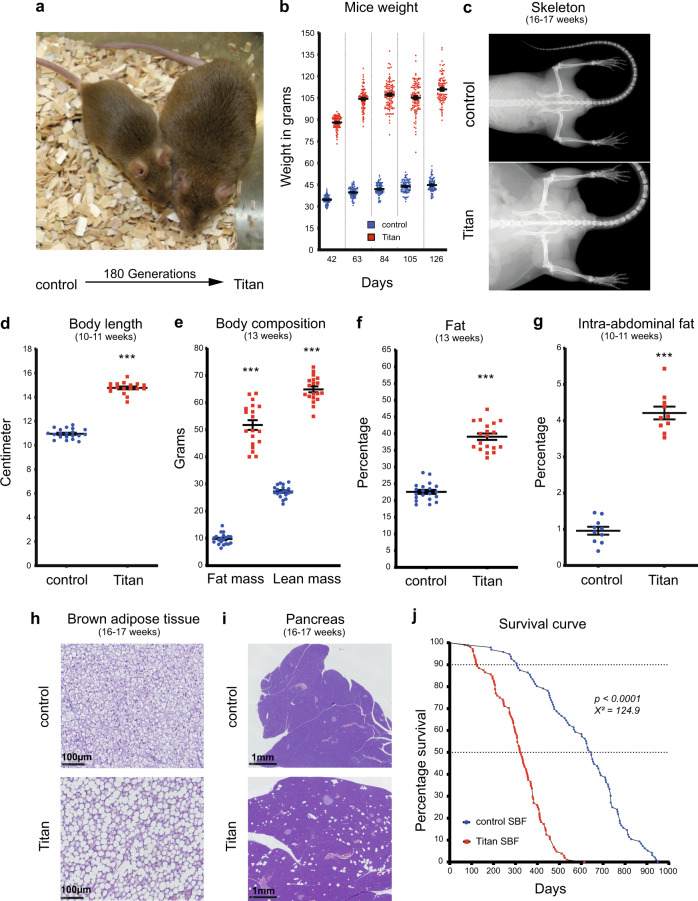
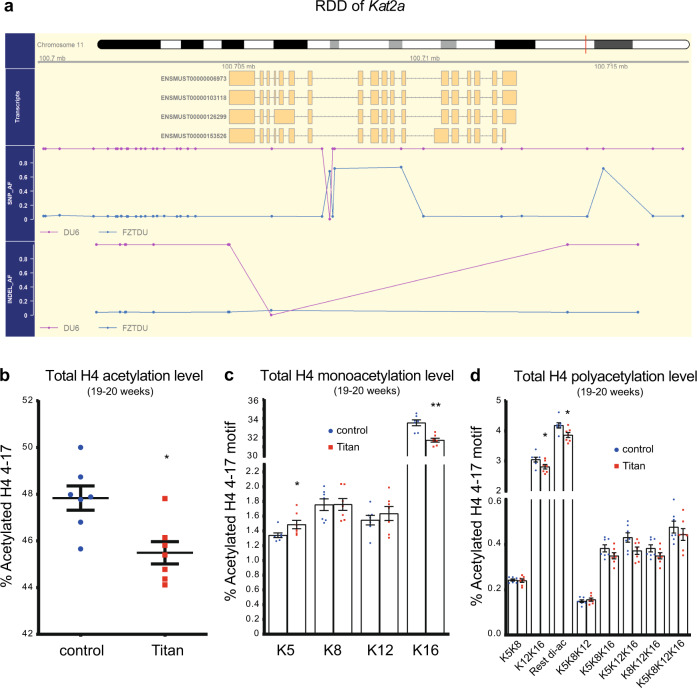
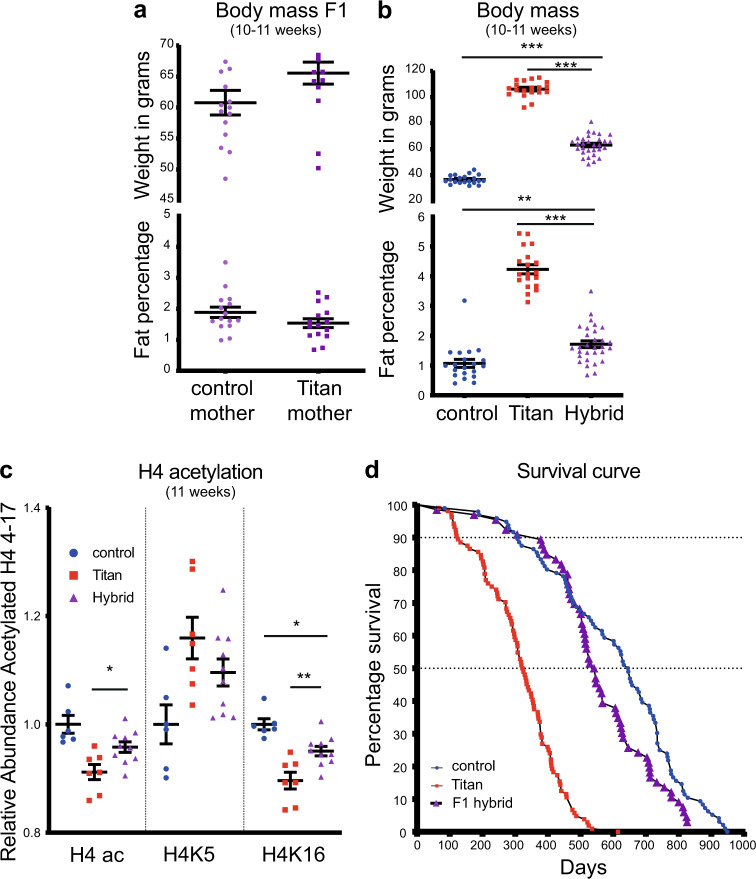
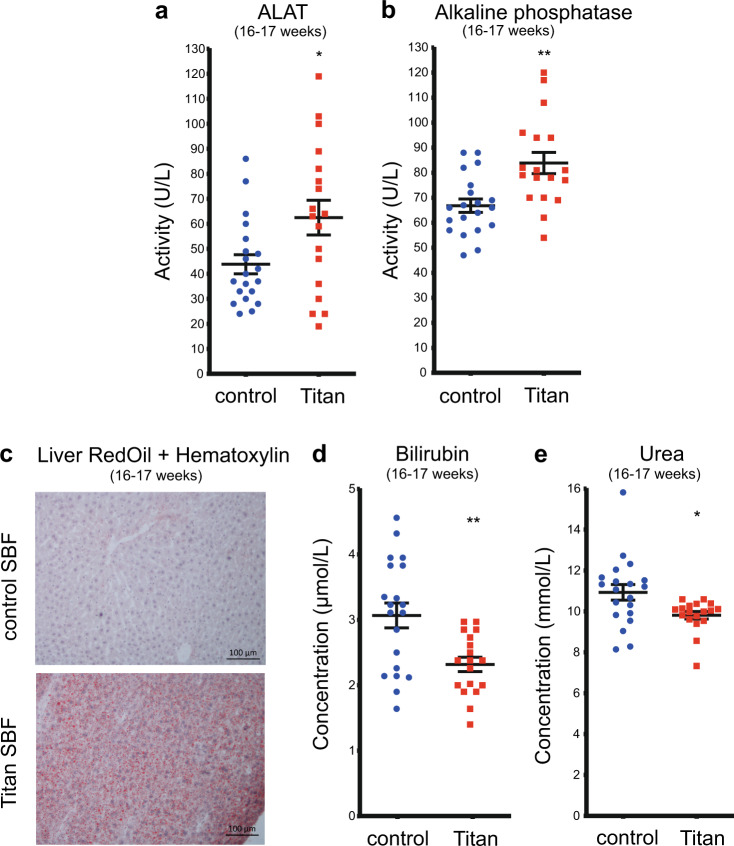
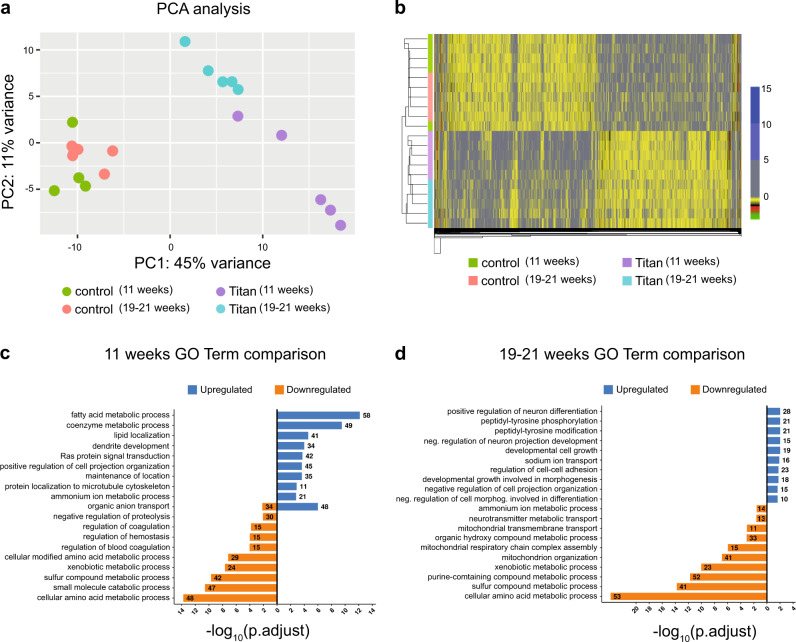
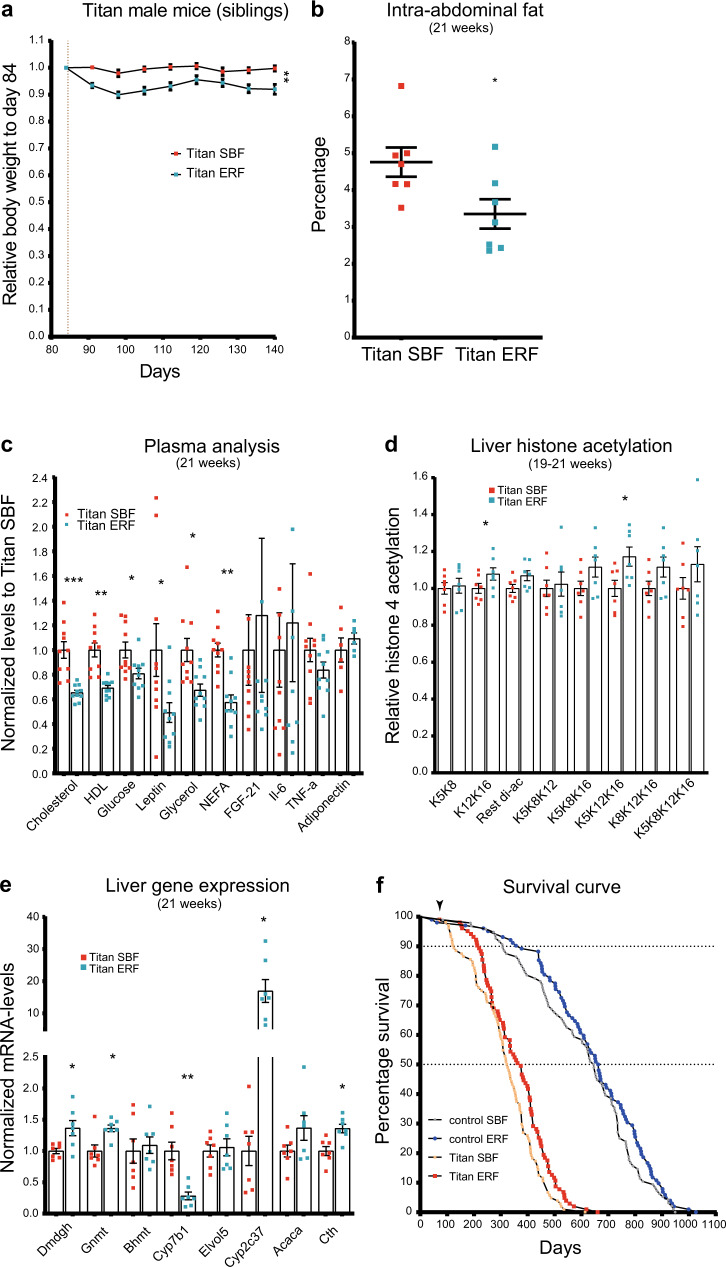
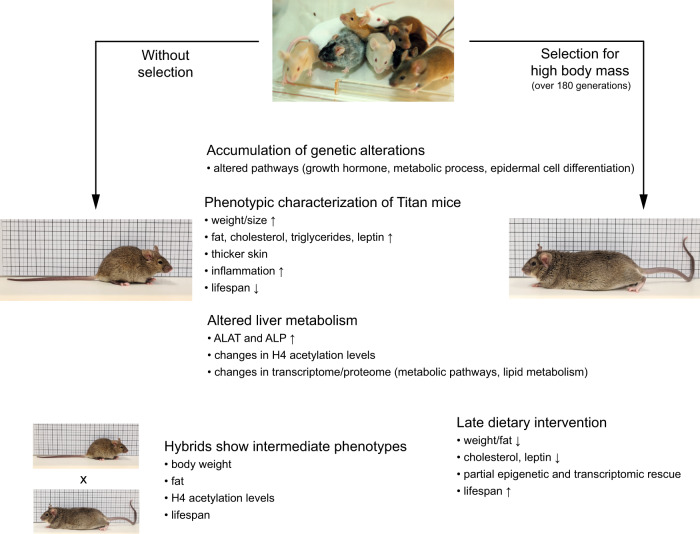
Suitable animal models are essential for translational research, especially in the case of complex, multifactorial conditions, such as obesity. The non-inbred mouse (Mus musculus) line Titan, also known as DU6, is one of the world's longest selection experiments for high body mass and was previously described as a model for metabolic healthy (benign) obesity. The present study further characterizes the geno- and phenotypes of this non-inbred mouse line and tests its suitability as an interventional obesity model. In contrast to previous findings, our data suggest that Titan mice are metabolically unhealthy obese and short-lived. Line-specific patterns of genetic invariability are in accordance with observed phenotypic traits. Titan mice also show modifications in the liver transcriptome, proteome, and epigenome linked to metabolic (dys)regulations. Importantly, dietary intervention partially reversed the metabolic phenotype in Titan mice and significantly extended their life expectancy. Therefore, the Titan mouse line is a valuable resource for translational and interventional obesity research.


Conflict of interest statement

The authors declare no competing interests.

Figures

Fig. 1
Fig. 1. Titan mice, a product of 180 generations of selection, is a severely obese, giant, and short-lived mouse strain.
a Representative images of unselected control mice (left) and 180th generation-selected Titan mice (right) at 6 weeks of age, the time of the selection. b After the first 16–19 weeks of life, Titan mice reached over 110 g on average, whereas average control animals weighed 45 g. c Representative X-ray images of control and Titan mice at 16–17 weeks of age. Control (n = 38) and Titan (n = 31) mice. d Body length (cm) of 10–11-week-old Titan mice compared to age-matched control mice. Control (n = 20) and Titan (n = 17) mice. e Minispec data showing total fat and lean mass of control (n = 20) and Titan (n = 17) mice at the age of 10–11-weeks. f Total percentage of fat in control (n = 20) and Titan (n = 17) mice. g Percentage of intra-abdominal fat (n = 10 per group) at the age of 10–11-weeks. h Representative images of hematoxylin and eosin (H&E)-stained brown adipose tissue from control (n = 6) and Titan (n = 5) mice (20x magnification) at 16–17 weeks of age. i Representative images of H&E-stained pancreas from control and Titan (n = 6) mice (2.5x magnification) at 16–17 weeks of age. j Comparison of lifespans and mortality rates of Titan and control male mice showing significantly reduced lifespan of Titan mice (log-rank test; p < 0.0001, χ2 = 124.9). ***p < 0.001. Error bars indicate SEM (standard error of the mean). Unpaired two‐tailed t‐tests with Welch’s correction were used to calculate p values.
Fig. 2
Fig. 2. Histone 4 acetylation levels are altered in Titan compared with unselected control mice.
a Scheme of the regions of distinct genetic differentiation (RDD) of the Kat2a gene in Titan and control mice. b Total levels of histone 4 (H4) 4–17 levels via mass spectrometry (p = 0.0111, MWU-test) (n = 7 per group). c Quantification of monoacetylation of histone 4 4–17. p values, Mann–Whitney U (MWU)-test (H4K5K8) = 0.0175, (H4K8) = 0.901, (H4K12) = 0.455, (H4K16) = 0.0023 (n = 7 per group). d Quantification of polyacetylation of histone 4 4–17. p values, MWU-test (H4K5K8) = 1, (H4K12K16) = 0.0379, (H4-rest di-ac) = 0.0379, (H4K5K8K12) = 0.62, (H4K5K8K16) = 0.208, (H4K5K12K16) = 0.053, (H4K8K12K16) = 0.208, (H4 tetra-ac) = 0.62 (n = 7 per group). *p < 0.05, **p < 0.01. Error bars indicate SEM.
Fig. 3
Fig. 3. Hybrid offspring of control and Titan mice display intermediate obesity and lifespan.
a Body weight and visceral fat percentage in F1 hybrids (offspring of mother control/Titan x father Titan/control, respectively; n = 15 each), Mann–Whitney U (MWU)-test was used to calculate p value. b Body weight and visceral fat percentage in control (n = 20), Titan (n = 19), and hybrid (n = 30). One-way ANOVA followed by Tukey test p value: control vs. hybrid (weight) <0.0001, (%visceral fat) = 0.0021 and Titan vs. hybrid (weight) <0.0001 (%visceral fat) <0.0001. c Quantification of total histone 4 (H4) 4–17 acetylation, H4K5ac and H4K16ac in control (n = 6), Titan (n = 7), and hybrid (n = 10) mice. One-way ANOVA followed by Tukey test p value: control vs. hybrid (H4ac) = 0.0765 (H4K5) = 0.116, (H4K16) = 0.0184 and Titan vs. hybrid (H4ac) = 0.0383, (H4K5) = 0.330, (H4K16) = 0.0065. d Comparison of lifespans and mortality rates of Titan and control male mice to hybrid (n = 66). *p < 0.05, **p < 0.01. ***p < 0.001. Error bars indicate SEM.
Fig. 4
Fig. 4. Titan mice display altered liver metabolism.
a ALAT (p = 0.0262) and (b) ALP (p = 0.0019) levels in control (n = 20) and Titan mice (n = 18). c Oil Red O with hematoxylin staining of fat in liver of control and Titan mice (n = 4 per group). d Bilirubin levels in control (n = 20) and Titan mice (n = 18; p = 0.0019). e Urea levels of control (n = 20) and Titan (n = 18) mice (p  = 0.0132). *p < 0.05, **p < 0.01. Unpaired two-tailed t-tests with Welch’s correction were used to calculate p values. Error bars indicate SEM.
Fig. 5
Fig. 5. Liver transcriptome analyses reveal differential expression of genes associated with metabolic pathways in Titan mice.
a Principal component analysis (PCA) of liver transcriptomes revealed clustering differences between Titan mice and controls. Control mice at 11 weeks and 19–21 weeks had similar transcriptomes, while younger and older Titan mice had distinct transcriptomes. b Heatmap showing significantly altered genes in control and Titan mice at 11 weeks and 19–21 weeks of age. The color gradient in each cell in the heatmap represents the scaled normalized log counts from each replicate and condition. c Gene ontology (GO) term analysis in 11-week-old Titan mice compared with corresponding controls. d GO terms in 19–21-week-old Titan mice compared with the corresponding controls (n = 5 per group).
Fig. 6
Fig. 6. Late dietary intervention by switching to ERF improves health metrics and extends the lifespan of Titan mice.
a Switching standard breeding feed (SBF) to energy-reduced feed (ERF) at 12 weeks resulted in a persistent average weight loss in Titan siblings (n = 23 per group). Mann–Whitney-U (MWU)-test was calculated for day 140, p = 0.0011. b Compared to age-matched control Titan mice, ERF-fed Titan mice had a lower percentage of intra-abdominal fat at 21 weeks (n = 7 per group). Paired Wilcoxon-test, p = 0.0313. c Late ERF feeding at 12 weeks of age decreased the levels of plasma cholesterol (pval.adj = 0.00013), high-density lipoprotein (HDL) (pval.adj = 0.0013), glucose (pval.adj = 0.043), leptin (pval.adj = 0.043), glycerol (pval.adj = 0.0165), and non-esterified fatty acids (NEFA) (pval.adj = 0.00132) in 21-week-old mice (n = 10 per group). MWU-test, by multiple correction to calculate p values. d Quantification of polyacetylation of histone 4 4–17 following ERF feeding. p values, paired MWU-test (H4K5K8) = 0.8125, (H4K12K16) = 0.0469 (H4-rest di-ac) = 0.1563, (H4K5K8K12) = 0.9375, (H4K5K8K16) = 0.0781, (H4K5K12K16) = 0.0313, (H4K8K12K16) = 0.0781, (H4 tetra-ac) = 0.375 (n = 7 per group). e RT-PCR comparing gene expression of candidate genes from ERF- and SBF-fed Titan mice siblings at 21 weeks of age (n = 7 per group). Paired t-test was performed followed by multiple correction to calculate adjusted p values; pval.adj (Dmdg) = 0.032, (Gnmt) = 0.012, (Bhmt) = 0.736, (Cyp7b1) = 0.008, (Elovl5) = 0.736, (Cyp2c37) = 0.012, (Acaca) = 0.0587, (Cth) = 0.012. f Switching to ERF feeding at 12 weeks of age (vertical black arrowhead) increased the lifespan of both Titan and control mice (Log-rank test; p = 0.0087, χ2 = 6.892 Titan and p = 0.162, χ2 = 1.955 control). The ages at 25, 75, and 90% death and the median lifespan are presented in Supplementary Table 1. *p < 0.05, **p < 0.01, ***p < 0.001. Error bars indicate SEM.
Fig. 7
Fig. 7. Accumulation of genetic, epigenetic, and physiological alterations during the selection process of Titan mice.
Working model of the selection process for body mass over 180 generations in Titan animals. The long selection process resulted in the accumulation of genetic and epigenetic alterations that caused a shift in the transcriptome and proteome, ultimately leading to alterations in metabolic processes such as lipid metabolism. The selection resulted in morphological changes in various tissues such as fat, pancreas, thymus, heart, brain, and skin. These overall changes resulted in giant and extremely obese mice, while unselected mice stemming retained similar characteristics compared to the original mouse colony.

References

    1. Bolker JA. Animal models in translational research: Rosetta stone or stumbling block? Bioessays. 2017;39:1700089. doi: 10.1002/bies.201700089. - DOI - PubMed
    1. Choudhary A, Ibdah JA. Animal models in today’s translational medicine world. Mo. Med. 2013;110:220–222. - PMC - PubMed
    1. Prabhakar S. Translational research challenges. J. Invest. Med. 2012;60:1141. doi: 10.2310/JIM.0b013e318271fb3b. - DOI - PubMed
    1. Brockmann GA, Bevova MR. Using mouse models to dissect the genetics of obesity. Trends Genet. 2002;18:367–376. doi: 10.1016/S0168-9525(02)02703-8. - DOI - PubMed
    1. Renne U, et al. Lifelong obesity in a polygenic mouse model prevents age- and diet-induced glucose intolerance- obesity is no road to late-onset diabetes in mice. PLoS ONE. 2013;8:e79788. doi: 10.1371/journal.pone.0079788. - DOI - PMC - PubMed

Publication types