. 2022 May;7(5):630-639.
doi: 10.1038/s41564-022-01107-x. Epub 2022 May 2.

Longitudinal multi-omics analyses link gut microbiome dysbiosis with recurrent urinary tract infections in women

Affiliations

Longitudinal multi-omics analyses link gut microbiome dysbiosis with recurrent urinary tract infections in women

Colin J Worby et al. Nat Microbiol. 2022 May.

Abstract

Recurrent urinary tract infections (rUTIs) are a major health burden worldwide, with history of infection being a significant risk factor. While the gut is a known reservoir for uropathogenic bacteria, the role of the microbiota in rUTI remains unclear. We conducted a year-long study of women with (n = 15) and without (n = 16) history of rUTI, from whom we collected urine, blood and monthly faecal samples for metagenomic and transcriptomic interrogation. During the study 24 UTIs were reported, with additional samples collected during and after infection. The gut microbiome of individuals with a history of rUTI was significantly depleted in microbial richness and butyrate-producing bacteria compared with controls, reminiscent of other inflammatory conditions. However, Escherichia coli gut and bladder populations were comparable between cohorts in both relative abundance and phylogroup. Transcriptional analysis of peripheral blood mononuclear cells revealed expression profiles indicative of differential systemic immunity between cohorts. Altogether, these results suggest that rUTI susceptibility is in part mediated through the gut-bladder axis, comprising gut dysbiosis and differential immune response to bacterial bladder colonization, manifesting in symptoms.


Conflict of interest statement

Competing interests

The authors declare no competing interests.

Figures

Extended Data Fig. 1
Extended Data Fig. 1. Sex precedes all clinical UTI events
Survey reports of intercourse frequency in the previous two weeks. Responses are partitioned by (i) control women, (ii) rUTI women at time of UTI, and (iii) rUTI women at non-UTI time points.
Extended Data Fig. 2
Extended Data Fig. 2. SCFA producing bacteria are depleted in the rUTI gut
Cumulative relative abundances of (a) butyrate and (b) propionate producing bacterial species in rUTI and control samples. Box plots display the median (center line), 25th and 75th percentiles (box), as well as the 5th and 95th percentiles (whiskers). Within-host average relative abundances of individual species for (c) butyrate and (d) propionate producers are also shown. Horizontal lines denote the mean relative abundance in rUTI (red) and control (blue) women.
Extended Data Fig. 3
Extended Data Fig. 3. Bray Curtis dissimilarity across stool samples
(a) For each patient, the distribution of Bray-Curtis dissimilarities between all stool samples, ordered by increasing mean patient values within each cohort. (b) Bray-Curtis distributions between samples taken at the time of UTI vs. healthy time points (red), compared to all pairwise healthy sample comparisons. Box plots show the median (center line), 25th and 75th percentiles (box), as well as the 5th and 95th percentiles (whiskers).
Extended Data Fig. 4
Extended Data Fig. 4. rUTI dysbiosis is not driven by antibiotic use during the study
We grouped rUTI women according to their antibiotic exposures at any point during the UMB study; (i) ciprofloxacin (n=6) (ii) non-ciprofloxacin antibiotics (n=6); (iii) no antibiotics (n=3); (iv) any antibiotics (n=12). Groups were compared against each other and against the control cohort (n=16) for (a) overall microbial richness and (b) relative abundance of butyrate producers. Crosses represent mean values for individuals, boxplots denote the IQR and 95% central quantiles for each group. Wilcoxon rank sum tests (two-sided) were applied to group pairs to derive p-values. (c) Temporal trends of microbial richness (black) and relative abundance of butyrate producers (red) in all rUTI participants using antibiotics during the study. For each individual, linear models were fit to observations (points) over time; fitted trends are shown, with coefficients & p values reported at the top of each panel. Dashed vertical lines denote antibiotic usage. Participant mean values are represented by horizontal lines.
Extended Data Fig. 5
Extended Data Fig. 5. Most species depleted in the rUTI gut are also depleted in the IBD gut
We compared discriminatory taxa in rUTI women to those in IBD patients using data from adult participants in the HMP2 study . For each study, we fitted mixed effects models to standardized Metaphlan2 relative abundances as a function of categorical disease group (rUTI or IBD respectively, vs. each study’s control cohort), including covariates for race and antibiotic use. The disease group coefficients are plotted against each other for each species, with circle pairs representing the average relative abundance in each study. Species with uncorrected p values <0.05 in either study are labelled. Species not present in at least 10% of samples in either study are excluded. IBD comprises patients with either CD or UC.
Extended Data Fig. 6
Extended Data Fig. 6. Immunological differences between cohorts
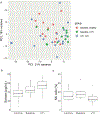
(a) PCA plot of gene expression across cohorts, based on PBMC RNA Seq data. Samples are partitioned into healthy controls (n=13), rUTI patient baseline (enrollment; n=12) and rUTI patient at time of UTI (n=17). (b) Plasma eotaxin-1 levels in control women, and rUTI women at healthy enrollment and time of UTI. (c) Relative abundance of NK cells in control and rUTI women based on CIBERSORT output. Box plots display the median (center line), 25th and 75th percentiles (box), as well as data points within 1.5 IQR of the upper & lower quartiles (whiskers), and outliers beyond this range (dots).
Extended Data Fig. 7
Extended Data Fig. 7. Limited relationship between non SCFA-producing taxa with butyrate producers
For all non SCFA-producing genera detected across all samples, the correlation coefficient between its relative abundance and the relative abundance of butyrate producers was calculated and plotted against its mean relative abundance across (a) control (n=170) and (b) rUTI (n=197) samples. Genera with an absolute correlation coefficient greater than 0.25 are labeled, along with Escherichia, represented by the red point.
Extended Data Fig. 8
Extended Data Fig. 8. coli relative abundance around the time of UTI and phylogroup distributions
E. For all stool samples taken within 3 days of a UTI event, the log fold change is given relative to (a) the median E. coli relative abundance in the corresponding patient, excluding samples taken at the time of UTI, and (b) the relative abundance of E. coli in the preceding stool sample. ‘X’ denotes samples for which there was no prior sample available. (c) Number of detected E. coli strains by sample type. (d) Number of detected StrainGST reference strains vs. relative abundance of E. coli.
Extended Data Fig. 9
Extended Data Fig. 9. Strain dynamics in control women
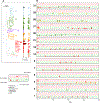
Strain dynamics within all control participants; analogous to Figure 3. (a) Phylogenetic tree comprising strains called by StrainGE across all stool and urine samples, colored by phylogroup. Bars show number of unique participants with at least one strain observation; bars are bolded if the strain was identified in at least one urine sample. Each strain identified in control women is uniquely identifiable by the phylogroup (color) and ID (numeral) indicated right. (b) Each panel represents longitudinal strain dynamics within one patient. Numerals refer to strain identifiers in (a). All fecal strains are connected to their most recent previous observation in fecal samples. Diamonds denote clinical rectal swabs. Strains identified in urine outgrowth depicted if available; otherwise raw urine strains are shown. Fecal or urine samples with no detected E. coli strains represented by open grey symbols. Vertical dashed lines represent self-reported antibiotic use.
Figure 1.
Figure 1.. Study design and sample collection for the UMB study.
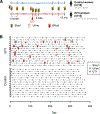
(a) Stool samples were collected monthly from rUTI and control patients. Stool, urine and blood plasma samples were collected upon enrollment and subsequent UTI clinic visits. Biweekly stool samples were requested following UTI diagnoses. (b) Stool and urine samples collected from all rUTI and control participants (excluding one rUTI and two control participants who dropped out of the study prior to completion). Each participant’s enrollment timeline is represented by horizontal gray lines, with stool (black dots) and urine (triangles) sample collection times denoted. Red symbols denote diagnosed and inferred UTI events.
Figure 2.
Figure 2.. rUTI women have a distinct gut microbiome.
(a) Average relative abundances of bacterial families for each patient in the rUTI (left) and the control (right) cohorts. (b) Significance and rUTI group effect size for selected taxa. Each point represents one taxon; its effect size and direction (symbol) for rUTI vs. control, false discovery rate (FDR) and mean relative abundance across all samples. Taxonomic relationships are represented by lines. FDR values calculated independently at each taxonomic level. Bold, regular and italic text denote family, genus and species levels (c) Microbial richness distributions and (d) cumulative relative abundance of butyrate-producing species for each study participant. Plot displays the median (center line), 25th and 75th percentiles (box), as well as the 5th and 95th percentiles (whiskers) for each individual. Horizontal lines represent group-level mean of individual means. Antibiotic use and UTI occurrence for each study participant is shown at the bottom left; symbol size and numerals denote the number of UTIs/reported antibiotic courses. (e) Relative abundance of E. coli in each cohort. Symbols denote median relative abundances of individual patients; box plots display the median (center line), 25th and 75th percentiles (box), as well as the 5th and 95th percentiles (whiskers) of non-zero values.
Figure 3.
Figure 3.. Frequent gut-bladder transmission and strain persistence in rUTI patients.
Strain dynamics within all participants with E. coli UTIs. (a) Phylogenetic tree comprising strains called by StrainGE across all stool and urine samples, colored by phylogroup. Bars show number of unique participants with at least one strain observation; bars are bolded if the strain was identified in at least one urine sample. Each strain identified in rUTI patients is uniquely identifiable by the phylogroup (color) and ID (numeral) indicated right. (b) Each panel represents longitudinal strain dynamics within one patient. Numerals refer to strain identifiers in (a). All fecal strains are connected to their most recent previous observation in fecal samples. Diamonds denote clinical rectal swabs. Strains identified in urine outgrowth depicted if available; otherwise raw urine strains are shown. Fecal or urine samples with no detected E. coli strains represented by open grey symbols. Vertical dashed lines represent self-reported antibiotic use, solid black lines denote UTI events.
Figure 4.
Figure 4.. Phylogenetic distribution of E. coli strains identified in all stool and urine samples.
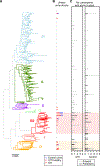
(a) The phylogenetic tree of StrainGE reference strains colored and annotated by phylogroup. (b) Unique E. coli strains identified in urine samples are marked alongside the corresponding reference strain. Filled circles represent UTI-causing strains, blue circles denote strains identified in control hosts. (c) The total number of rUTI (left) and control (right) women with the corresponding strain present in stool samples. Black bars denote the number of women for whom the strain was persistent in the gut.

Comment in

References

    1. Flores-Mireles AL, Walker JN, Caparon M & Hultgren SJ Urinary tract infections: epidemiology, mechanisms of infection and treatment options. Nat Rev Microbiol 13, 269–284 (2015). - PMC - PubMed
    1. Hooton TM, et al. A prospective study of risk factors for symptomatic urinary tract infection in young women. N Engl J Med 335, 468–474 (1996). - PubMed
    1. Yamamoto S, et al. Genetic evidence supporting the fecal-perineal-urethral hypothesis in cystitis caused by Escherichia coli. J Urol 157, 1127–1129 (1997). - PubMed
    1. Nielsen KL, Dynesen P, Larsen P & Frimodt-Moller N Faecal Escherichia coli from patients with E. coli urinary tract infection and healthy controls who have never had a urinary tract infection. J Med Microbiol 63, 582–589 (2014). - PubMed
    1. Jantunen ME, Saxen H, Lukinmaa S, Ala-Houhala M & Siitonen A Genomic identity of pyelonephritogenic Escherichia coli isolated from blood, urine and faeces of children with urosepsis. J Med Microbiol 50, 650–652 (2001). - PubMed

Publication types