. 2022 May 3;24(1):31.
doi: 10.1186/s13058-022-01525-z.

Activation of the viral sensor oligoadenylate synthetase 2 (Oas2) prevents pregnancy-driven mammary cancer metastases

Affiliations

Activation of the viral sensor oligoadenylate synthetase 2 (Oas2) prevents pregnancy-driven mammary cancer metastases

Wing-Hong Jonathan Ho et al. Breast Cancer Res. .

Abstract

Background: The interferon response can influence the primary and metastatic activity of breast cancers and can interact with checkpoint immunotherapy to modulate its effects. Using N-ethyl-N-nitrosourea mutagenesis, we found a mouse with an activating mutation in oligoadenylate synthetase 2 (Oas2), a sensor of viral double stranded RNA, that resulted in an interferon response and prevented lactation in otherwise healthy mice.

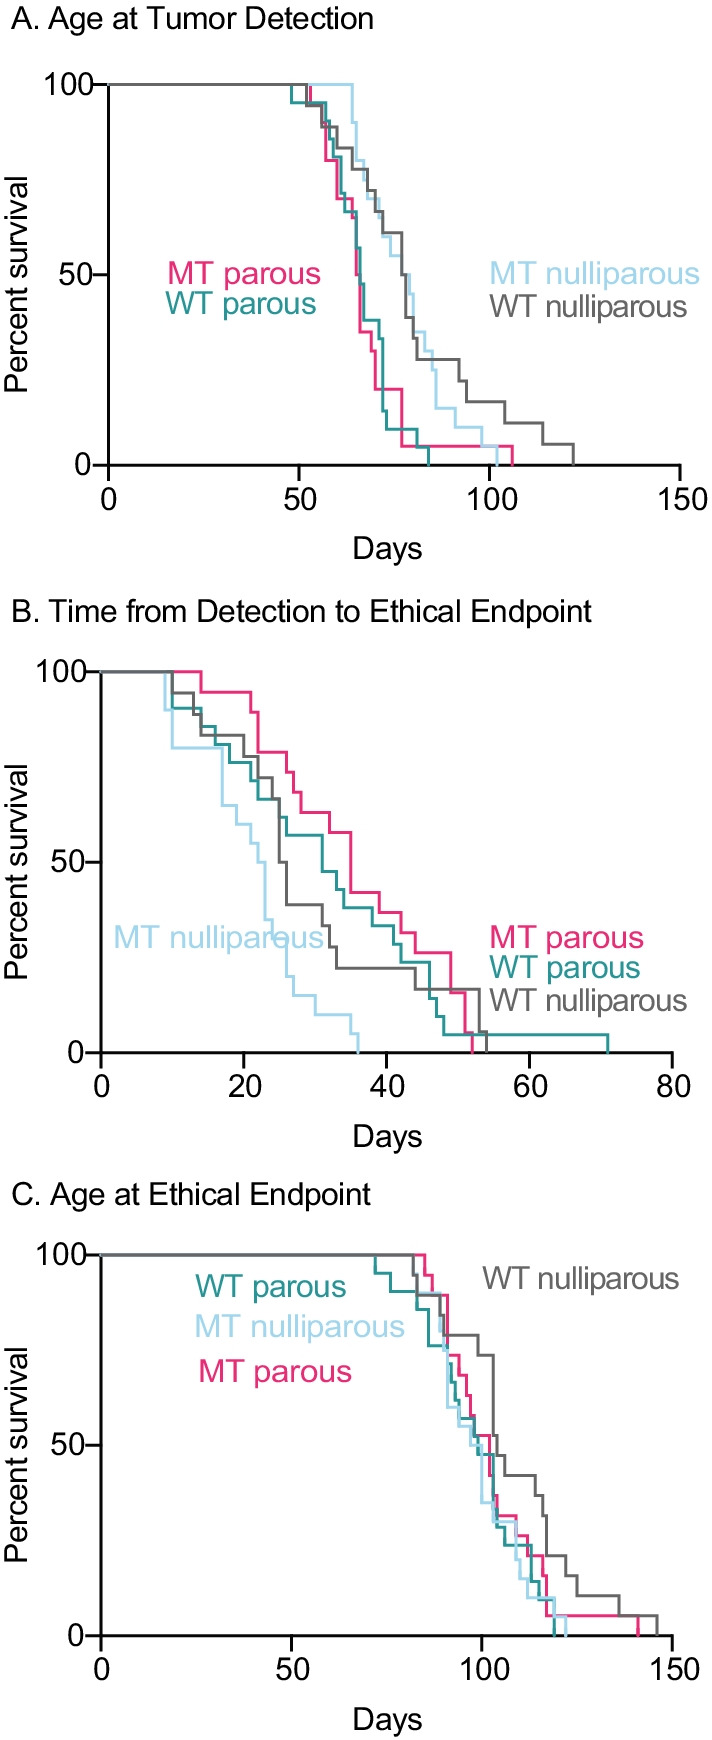
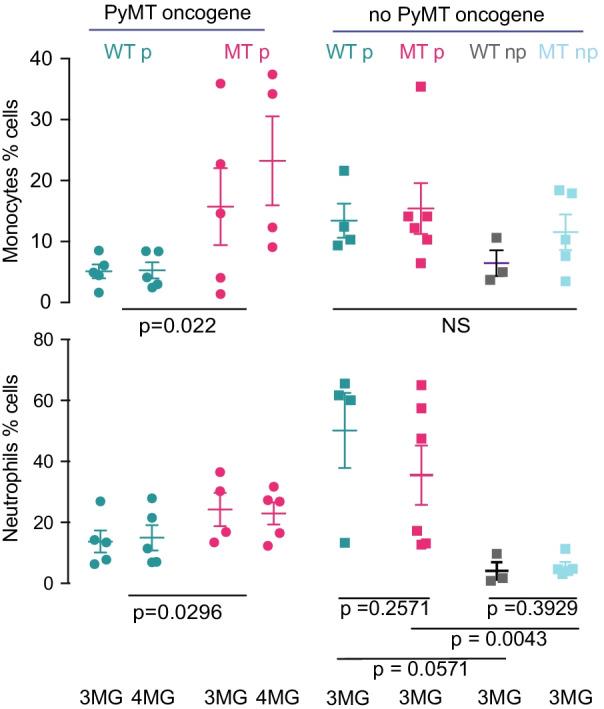
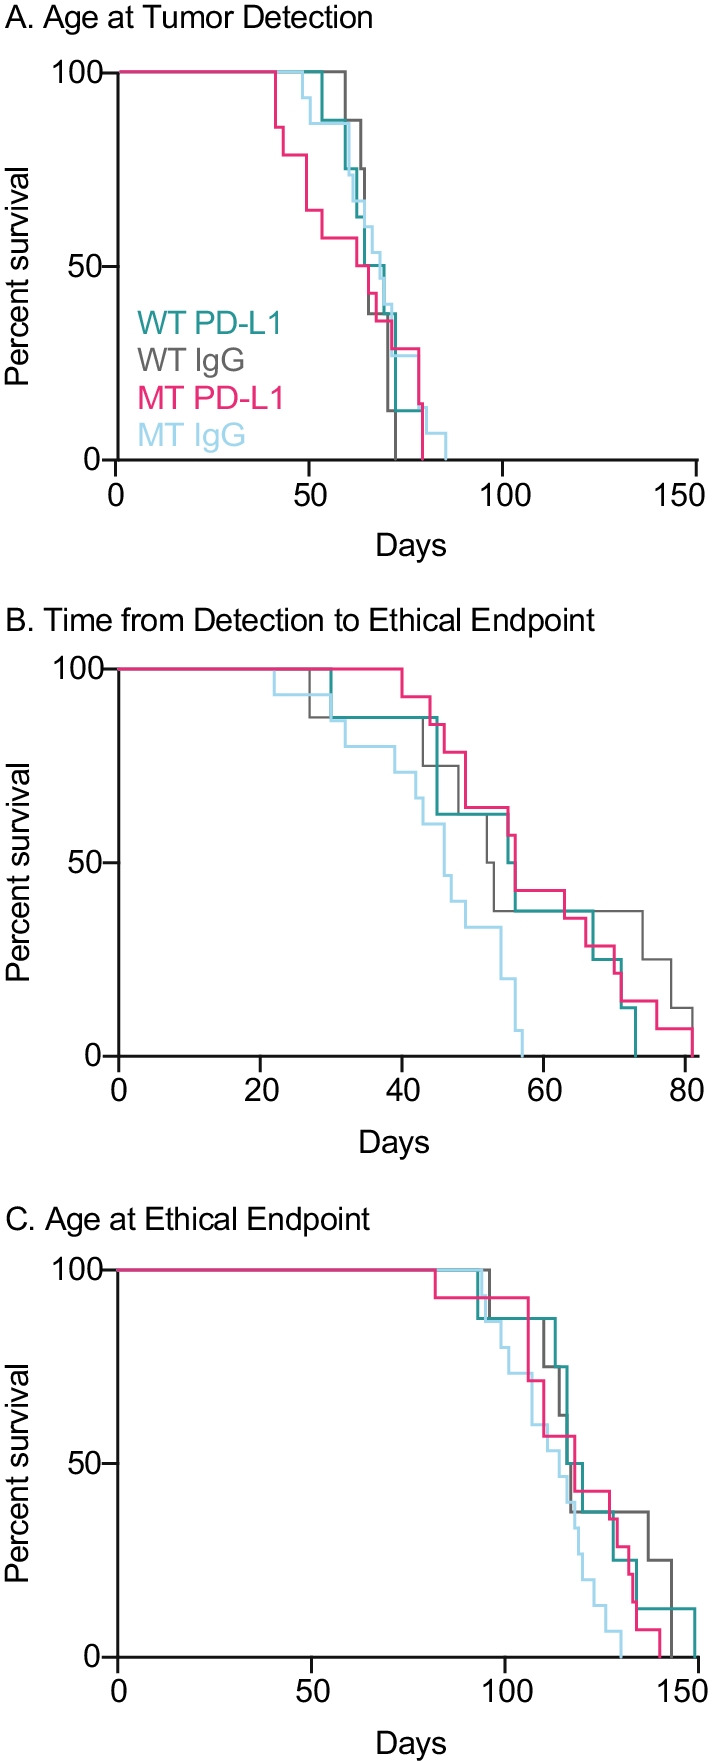
Methods: To determine if sole activation of Oas2 could alter the course of mammary cancer, we combined the Oas2 mutation with the MMTV-PyMT oncogene model of breast cancer and examined disease progression and the effects of checkpoint immunotherapy using Kaplan-Meier survival analysis with immunohistochemistry and flow cytometry.

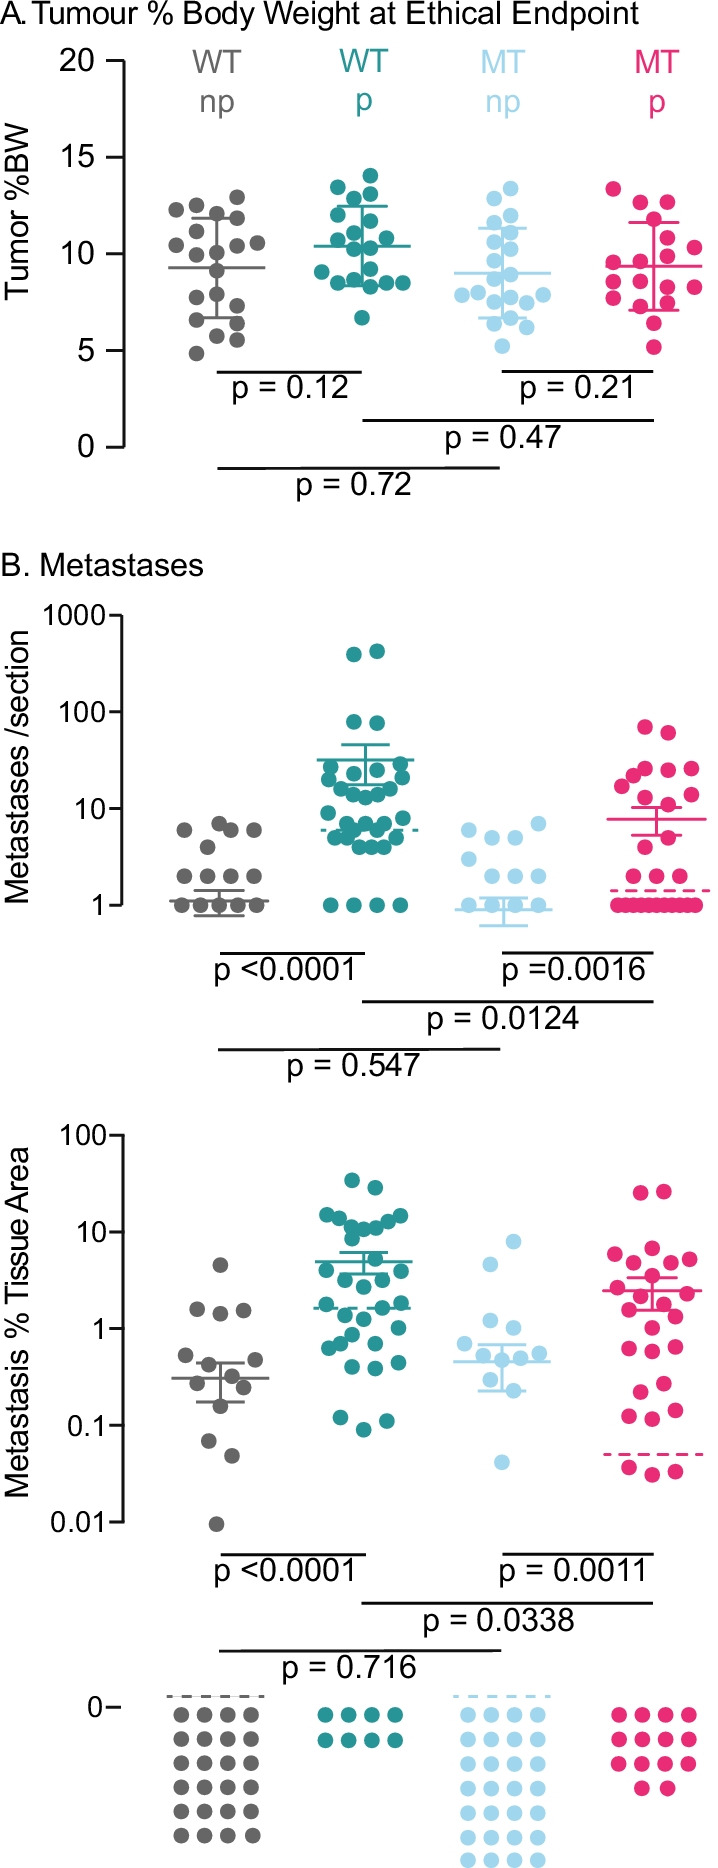
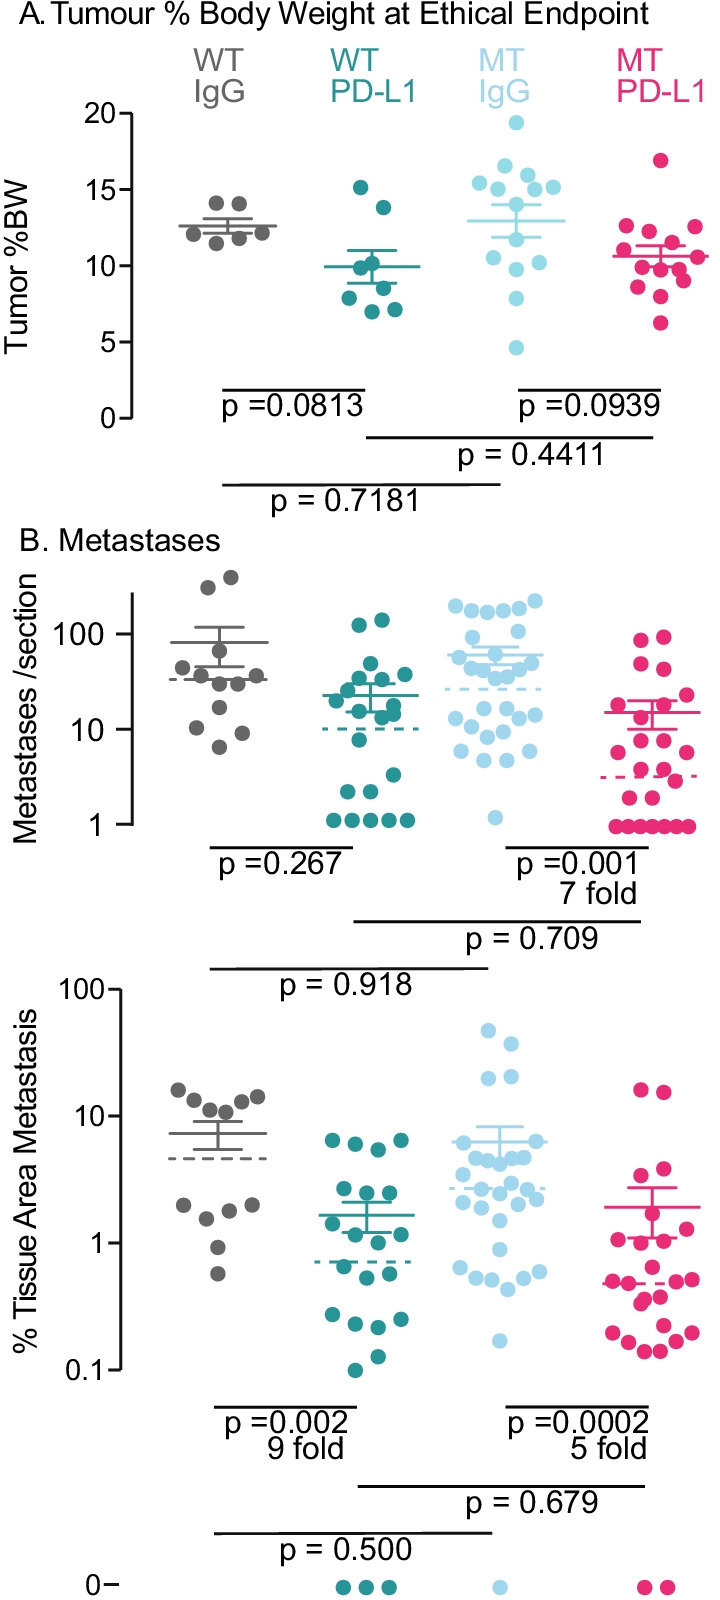
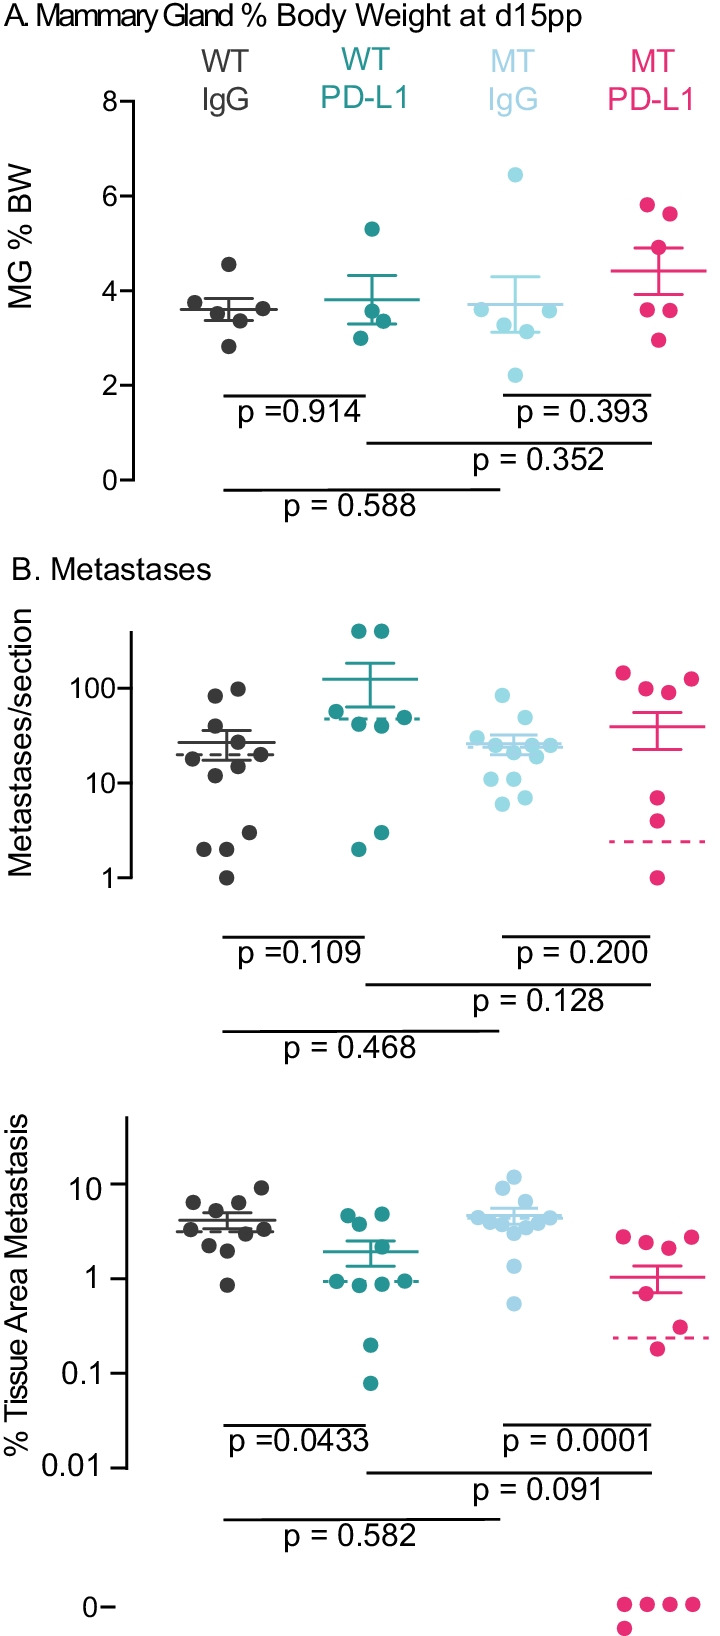
Results: Oas2 mutation prevented pregnancy from increasing metastases to lung. Checkpoint immunotherapy with antibodies against programmed death-ligand 1 was more effective when the Oas2 mutation was present.

Conclusions: These data establish OAS2 as a therapeutic target for agents designed to reduce metastases and increase the effectiveness of checkpoint immunotherapy.

Keywords: Breast; Cancer; Immunotherapy; Interferon; Mammary; OAS2.


Conflict of interest statement

The authors declare that they have no competing interests.

Figures

Fig. 1
Fig. 1
Effects of pregnancy on lesion histopathology. A Milk-associated protein (MAP) IHC staining of a number 4 mammary gland at day 3 postpartum from a 9-week-old dam. Inguinal region on the right-hand side, dorsal region on the left-hand side. Lesions identified and named by Lin et al. [18] to be characteristic of disease progression are circled in yellow and are shown at higher magnification below. Failed lobuloalveolar development (FLAD) is indistinguishable from hyperplasia. B Corresponding lesion IHC staining for PyMT protein. C Novel histopathological features seen in the immediate postpartum period, MAP IHC of a whole 2nd and 3rd mammary glands shown in the center panel and H&E at higher magnification of the circled features shown either side. D PyMT staining of metastases, E MAP staining of metastases
Fig. 2
Fig. 2
Stat activation and apoptosis during tumor progression in parous mice and the effect of MT Oas2. A The phosphorylation of the indicated Stat proteins is shown by specific phospho-Stat IHC and DAB staining, within the lesions defined in Fig. 1. QuPath was used to quantify overall mammary gland pStat nuclear positivity in MT and WT glands. Error bars are standard error of the mean, MT Stat1 data is not Gaussian (KS p = 0.03) and so the Mann–Whitney U test is used to calculate the p value. Stat3 and Stat5 p values were calculated using Student’s t test. B. Cleaved caspase 3 (CC3) IHC was used to quantify the proportion of apoptotic cells (CC3% + cells, left hand panel), and the proportion of pixels positive for CC3 staining (CC3% + pixels, right hand panel), in the indicated lesion subtypes abbreviated as HYP.; hyperplasia, MIN; mammary intraepithelial neoplasia, ENG.; engorged, CAR.; carcinoma. All comparisons within lesion subtypes for CC3 between MT and WT are nonsignificant using Student’s t test
Fig. 3
Fig. 3
Effect of MT Oas2 and parity on primary tumor initiation and expansion. Kaplan–Meier survival analysis for the indicated periods and endpoints, and for the indicated genotypes (MT, mutant Oas2; WT wild type Oas2) and parity status of mouse cohorts (20 per group). Mammary glands were palpated twice weekly and tumor growth was measured, as detailed in Additional file 3: Fig. S1. Two-way Kaplan–Meier curve comparisons and p values shown in Additional file 4: Fig. S2, n = 19 MT parous, 21 WT parous, 20 MT nulliparous and 19 WT nulliparous.
Fig. 4
Fig. 4
Effect of MT Oas2 and parity on lung metastases. A Actual tumor burden of the cohorts. All tumors were excised and weighed at autopsy, which was initiated when estimates of tumor volume calculated from caliper measurements reached 10% of body weight (BW). Abbreviations are MT, mutant Oas2; WT wild type Oas2; np, nulliparous; p, parous. Error bars are standard error of the mean and p values for the two-way comparisons indicated by the extremities of the lines were calculated using Student’s t test. Each symbol is the total tumor burden for a mouse. B top panel, the number of lung metastases per section counted manually using two sections per lung, 100 µm apart, and bottom panel, the area of DAB + cells stained by IHC for PyMT and quantified by QuPath, for the indicated genotypes and parity status of the mouse cohorts (20 per group). Error bars are standard error of the mean, median value is indicated by the broken bar, and p values were calculated using Mann–Whitney U test. Sections without metastases (which cannot be plotted on a log axis) are shown at the bottom of the figure marked “0.” Each symbol is a section
Fig. 5
Fig. 5
Effects of MT Oas2 on T cells, neutrophils and granulocytes. A screening of monocytes and neutrophils also known as myeloid-derived suppressor cells (MDSC) was undertaken in mammary tumors. Granulocyte and neutrophil levels were quantified in the third (3MG) or fourth (4MG) and results are combined for statistical analysis. Axes show percentage of cells within the previous gate and gating strategy is shown in Additional file 6: Fig. S4. Error bars are standard error of the mean and p values calculated by Student’s t test for the two-way comparisons indicated by the extremities of the lines. Abbreviations are MT, mutant Oas2; WT wild type Oas2; np, nulliparous; p, parous
Fig. 6
Fig. 6
Effect of PD-L1 and MT Oas2 on primary tumor initiation and expansion in parous mice. Kaplan–Meier survival analysis for the indicated periods and endpoints, and for the indicated genotypes, MT, mutant Oas2; WT wild type Oas2 and treatments (PD-L1 or IgG IP twice weekly), of mouse cohorts (20 per group). All mammary glands were palpated twice weekly and tumor growth was measured by calipers. Individual tumor growth profiles are shown in as shown in Additional file 7: Fig. S5. Two-way Kaplan–Meier comparisons and p values are shown in Additional file 8: Fig. S6, n = 8 WT PD-L1, 8 WT IgG, 14 MT PD-L1, 15 MT IgG
Fig. 7
Fig. 7
Effect of PD-L1 and MT Oas2 on lung metastases in parous mice at the ethical endpoint. A Actual tumor burden of the cohorts as a % of body weight (BW). All tumors were excised and weighed at autopsy, which was initiated when estimates of tumor volume calculated from caliper measurements reached 10% of body weight. Error bars are standard error of the mean and p values were calculated using Student’s t test. B the number of lung metastases per section, counted manually using two sections per lung 100 µm apart, and the area of DAB + cells stained by IHC for PyMT and quantified by QuPath, for the indicated genotypes and treatments (PD-L1 or IgG IP twice weekly). Mice without metastases (which cannot be plotted on a log axis) are shown at the bottom of the figure marked “0.” Error bars are standard error of the mean, median value is indicated by the broken bar and p values were calculated using Mann–Whitney U test for the two-way comparisons indicated by the extremities of the line. Abbreviations are MT, mutant Oas2; WT wild type Oas2
Fig. 8
Fig. 8
Effect of PD-L1 and MT Oas2 on lung metastases in parous mice immediately following PD-L1 treatment. A Mammary gland (MG) weight as a percentage of body weight (BW). All tumors were excised and weighed at autopsy at the completion of PD-L1 treatment, usually 2 weeks postpartum. Error bars are standard error of the mean and p values were calculated using Student’s t test. B The number of lung metastases per section (two sections per lung) counted manually, and the area of DAB + cells stained by IHC for PyMT and quantified by QuPath, for the indicated genotypes and treatments (PD-L1 or IgG IP twice weekly), of mouse cohorts. Mice without metastases (which cannot be plotted on a log axis) are shown at the bottom of the figure marked “0.” Error bars are standard error of the mean, median value is indicated by the broken bar and p values were calculated using Mann–Whitney U test. Abbreviations are MT, mutant Oas2; WT wild type Oas2

References

    1. Parker BS, Rautela J, Hertzog PJ. Antitumour actions of interferons: implications for cancer therapy. Nat Rev Cancer. 2016;16:131–144. doi: 10.1038/nrc.2016.14. - DOI - PubMed
    1. Benci JL, et al. Opposing functions of interferon coordinate adaptive and innate immune responses to cancer immune checkpoint blockade. Cell. 2019;178:933–948. doi: 10.1016/j.cell.2019.07.019. - DOI - PMC - PubMed
    1. Borden EC. Interferons alpha and beta in cancer: therapeutic opportunities from new insights. Nat Rev Drug Discov. 2019;18:219–234. doi: 10.1038/s41573-018-0011-2. - DOI - PubMed
    1. Kyi C, et al. Therapeutic immune modulation against solid cancers with intratumoral poly-ICLC: a pilot trial. Clin Cancer Res. 2018;24:4937–4948. doi: 10.1158/1078-0432.CCR-17-1866. - DOI - PMC - PubMed
    1. Nagato T, Lee YR, Harabuchi Y, Celis E. Combinatorial immunotherapy of polyinosinic-polycytidylic acid and blockade of programmed death-ligand 1 induce effective CD8 T-cell responses against established tumors. Clin Cancer Res. 2014;20:1223–1234. doi: 10.1158/1078-0432.CCR-13-2781. - DOI - PMC - PubMed

Publication types