. 2022 May 4;14(1):47.
doi: 10.1186/s13073-022-01045-7.

Introduction and transmission of SARS-CoV-2 lineage B.1.1.7, Alpha variant, in Denmark

Collaborators, Affiliations

Introduction and transmission of SARS-CoV-2 lineage B.1.1.7, Alpha variant, in Denmark

Thomas Y Michaelsen et al. Genome Med. .

Abstract

Background: In early 2021, the SARS-CoV-2 lineage B.1.1.7 (Alpha variant) became dominant across large parts of the world. In Denmark, comprehensive and real-time test, contact-tracing, and sequencing efforts were applied to sustain epidemic control. Here, we use these data to investigate the transmissibility, introduction, and onward transmission of B.1.1.7 in Denmark.

Methods: We analyzed a comprehensive set of 60,178 SARS-CoV-2 genomes generated from high-throughput sequencing by the Danish COVID-19 Genome Consortium, representing 34% of all positive cases in the period 14 November 2020 to 7 February 2021. We calculated the transmissibility of B.1.1.7 relative to other lineages using Poisson regression. Including all 1976 high-quality B.1.1.7 genomes collected in the study period, we constructed a time-scaled phylogeny, which was coupled with detailed travel history and register data to outline the introduction and onward transmission of B.1.1.7 in Denmark.

Results: In a period with unchanged restrictions, we estimated an increased B.1.1.7 transmissibility of 58% (95% CI: [56%, 60%]) relative to other lineages. Epidemiological and phylogenetic analyses revealed that 37% of B.1.1.7 cases were related to the initial introduction in November 2020. The relative number of cases directly linked to introductions varied between 10 and 50% throughout the study period.

Conclusions: Our findings corroborate early estimates of increased transmissibility of B.1.1.7. Both substantial early expansion when B.1.1.7 was still unmonitored and continuous foreign introductions contributed considerably to case numbers. Finally, our study highlights the benefit of balanced travel restrictions and self-isolation procedures coupled with comprehensive surveillance efforts, to sustain epidemic control in the face of emerging variants.


Conflict of interest statement

The authors declare that they have no competing interests.

Figures

Fig. 1
Fig. 1
Sequencing rate and lineage dynamics. Each row corresponds to the region highlighted to the far left. The two vertical dashed lines indicate the beginning and end of study period used to infer B.1.1.7 transmissibility, while the non-shaded area shows the period used for phylogenetic analysis. The time outside the study are shaded in gray. A Sequencing rate across time. Total height corresponds to the total number of cases for each week. Green bars indicate the number of cases for which a high-quality genome was available (less than 3000 ambiguous bases). B Relative abundance of ten most abundant PANGO lineages across Denmark in the study period. Computed from rolling averages of daily cases with genome available over a 14-days window. Less abundant lineages are not shown but included in the unfilled area of the plots. The black dot and date corresponds to the point where B.1.1.7 crosses 50% relative abundance
Fig. 2
Fig. 2
Early introduction of B.1.1.7 and onwards transmission between Danish regions. A Time-adjusted phylogenetic tree. Tree branches and non-Danish sequences are colored gray. First sequence in a transmission lineage is used to infer time of importation and highlighted with a black circle. B, C A focused temporal analysis of the CA1 introduction lineage, focusing on descending clusters with more than 5 cases. B The temporal span and dynamics of onwards transmission across regions. Each descendent transmission cluster of CA1 is indicated with a solid horizontal line, with points at each week sized according to the number of cases. The vertical curved arrows indicate direction of transmission. The marginal probability of the observed transmission link is indicated at each arrow. In C, the corresponding cases are placed on a map of Denmark using black points, with up to 5 km of random jitter added. Cases from the same transmission cluster are linked by black lines to their centroid location indicated by a red dot. Labels indicate cluster IDs
Fig. 3
Fig. 3
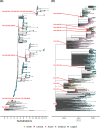
The phylogenetic structure of the data behind the introduction lineage CA1. The data for introduction lineage CA1 and descendant transmission clusters as shown in Fig. 2B. Each point is colored according to region, branches without points are sequences from outside Denmark. Red dots indicate the root node of each cluster with labels. A The maximum likelihood tree with branch support indicated as percentage values generated from 1000 ultrafast-bootstrap iterations using the -B option in IQ-tree. Polytomy nodes are collapsed by “;” in the labels. B Time-scaled, pruned version of the tree in A used for ancestral state reconstruction
Fig. 4
Fig. 4
Analysis of importation events into Denmark and onwards transmission between regions. A The temporal span and development of each transmission cluster, grouped by Danish region. Each transmission cluster is indicated with a solid horizontal line, with points at each week sized according to the number of cases. Circles indicate first observed case of an introduction lineage imported from outside Denmark. Red points indicate presence of cases with travel history in the given week. B The number of introductions into Denmark across time. Colors indicate the total number of offspring cases associated with each introduction lineage. C The relative contribution of introductions versus ongoing existing transmission. Introduction-related cases were defined with various cutoffs for the maximum number of days between the case and the first observed case for each introduction lineage, as indicated by different colors. D The origin of introductions across time for each region. If there was equal support for multiple regions as origin for an introduction Denmark was used as the origin. Label notDK indicates an introduction from outside Denmark. Only ancestral state changes with a marginal probability > 95% were included in the analysis

References

    1. Andrew R, Nick L, Oliver P, Wendy B, Jeff B, Alesandro C, Tom C, Tom P, David LR, Erik V. Preliminary genomic characterisation of an emergent SARS-CoV-2 lineage in the UK defined by a novel set of spike mutations, virological.org. 2020.
    1. Shu Y, McCauley J. GISAID: Global initiative on sharing all influenza data – from vision to reality. Euro Surveill. 2017;22. 10.2807/1560-7917.es.2017.22.13.30494. - PMC - PubMed
    1. New and Emerging Respiratory Virus Threats Advisory Group . NERVTAG meeting on SARS-CoV-2 variant under investigation VUI-202012/01. 2020.
    1. European Centre for Disease Prevention and Control. Risk related to the spread of new SARS-CoV-2 variants of concern in the EU/EEA – first update. Stockholm: ECDC; 2021.
    1. Statens Serum Institut, SARS-CoV-2-virusvarianter . SSI’s portal med information om COVID-19. 2021.

Publication types

Supplementary concepts