Review
. 2022 Mar 5:87:e141-e162.
doi: 10.5114/pjr.2022.113825. eCollection 2022.

Magnetic resonance imaging of musculoskeletal infections

Affiliations
Review

Magnetic resonance imaging of musculoskeletal infections

Jennifer S Weaver et al. Pol J Radiol. .

Abstract

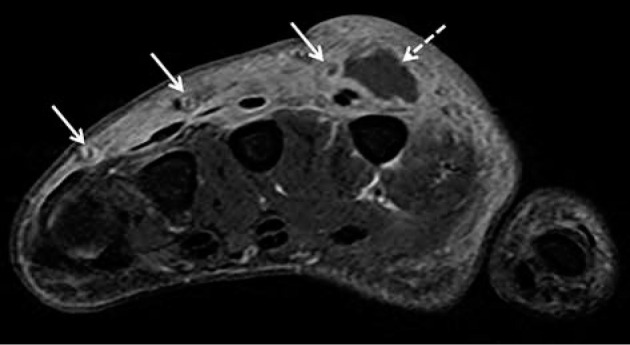
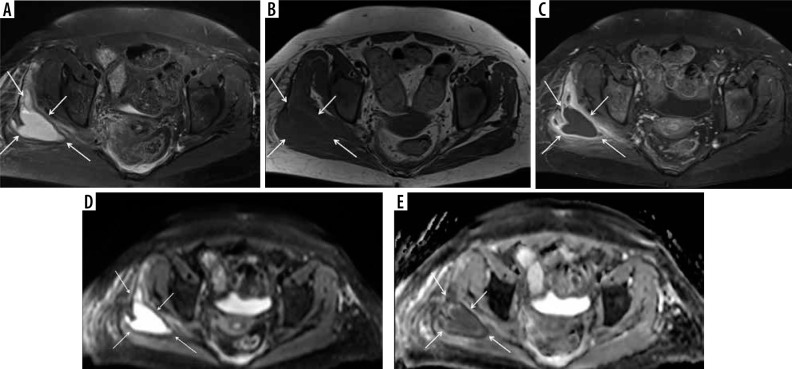
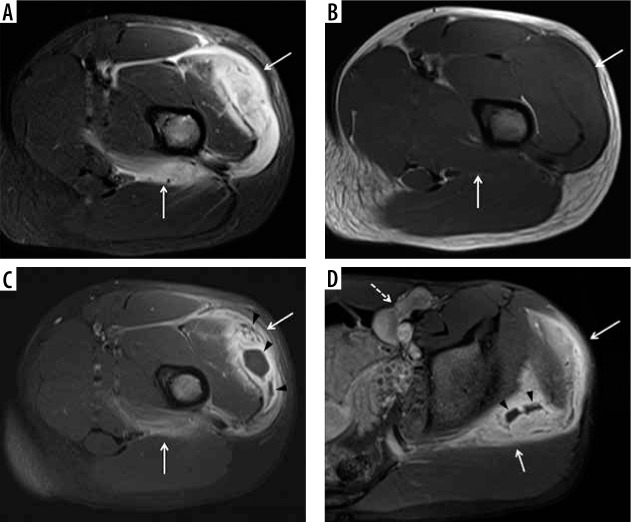
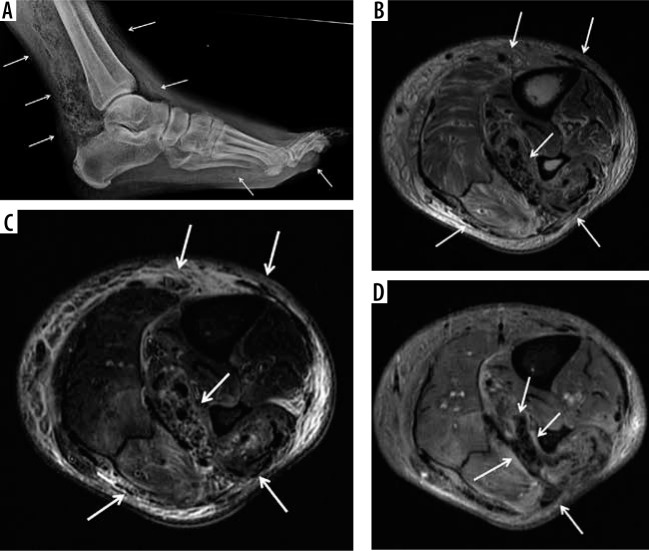
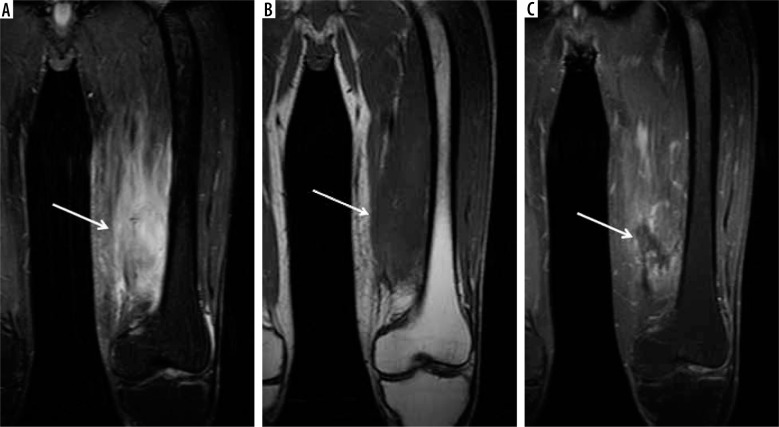
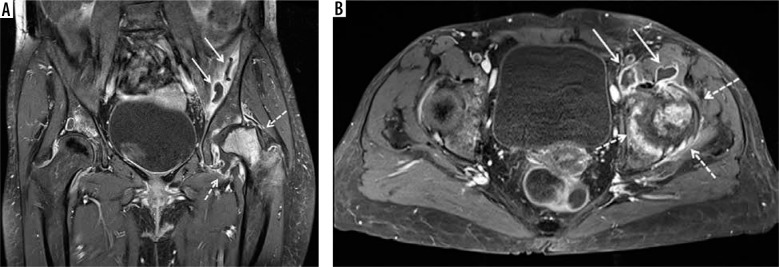
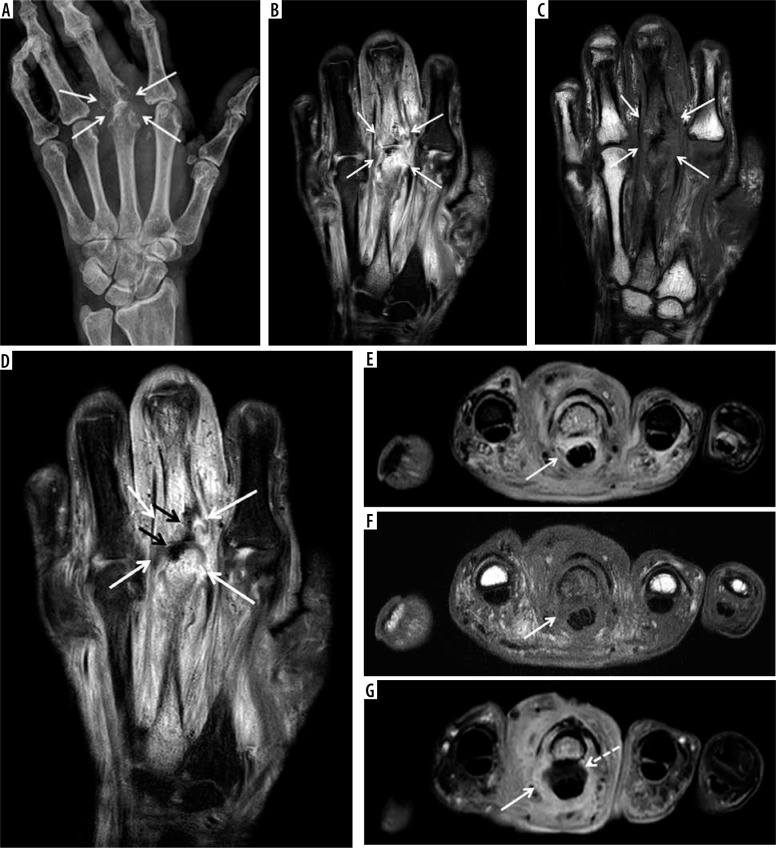
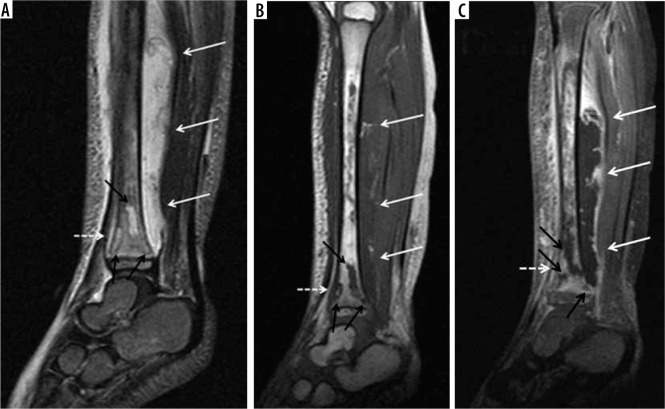
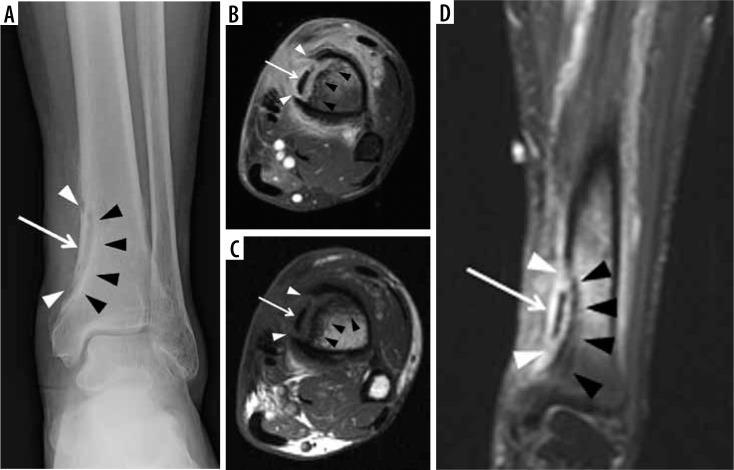
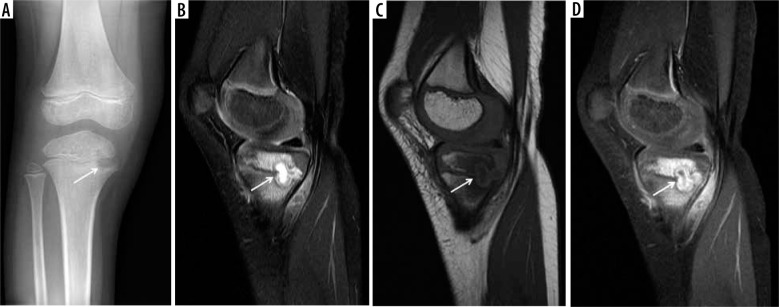
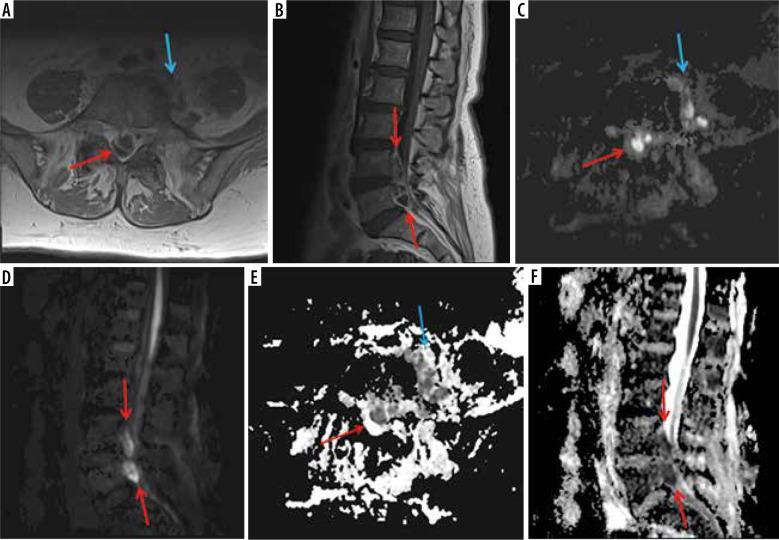
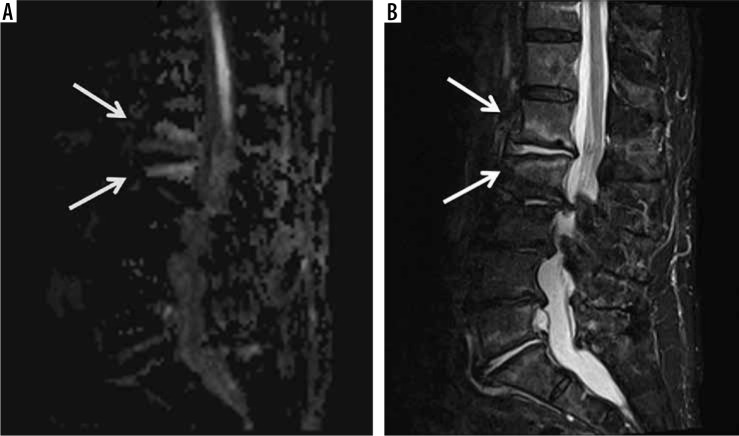
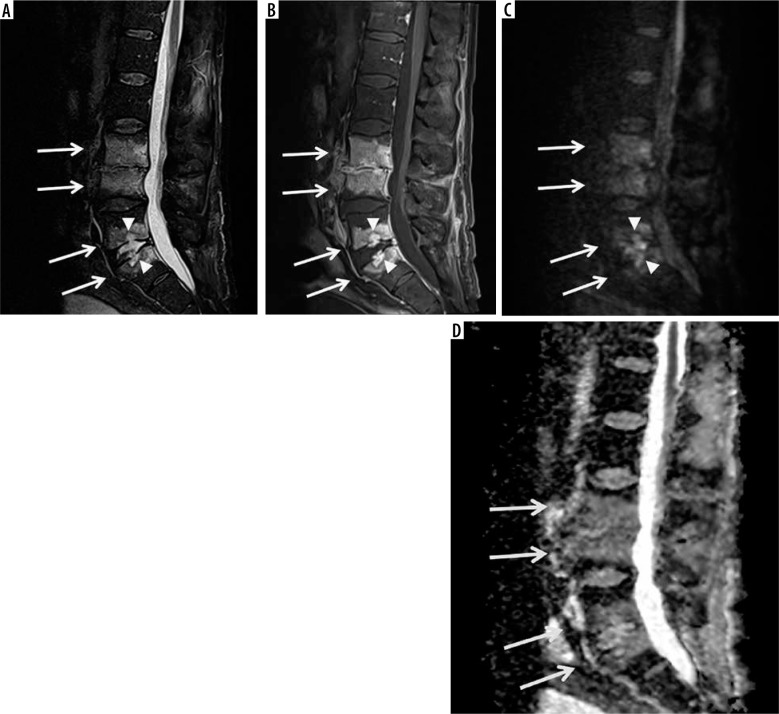
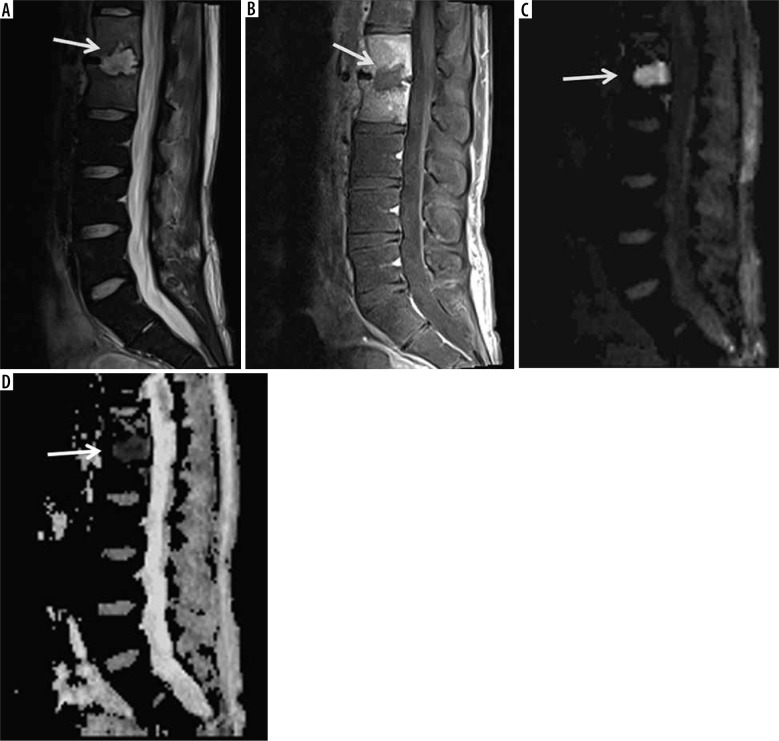
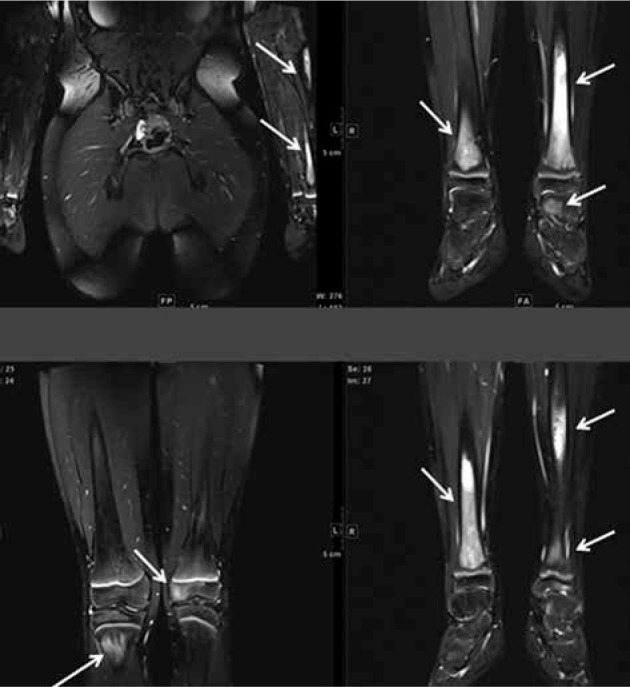
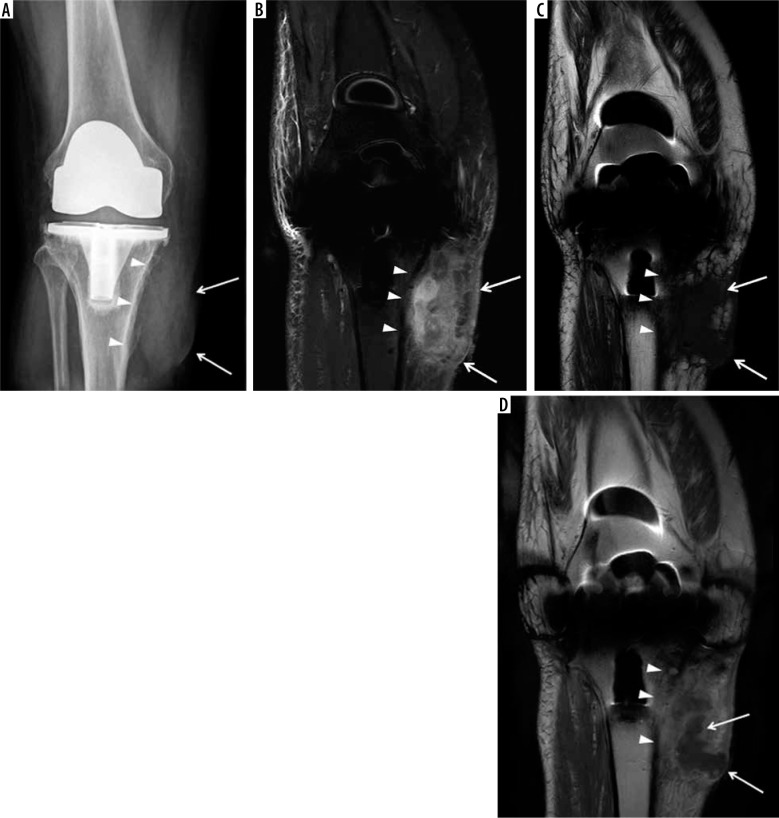
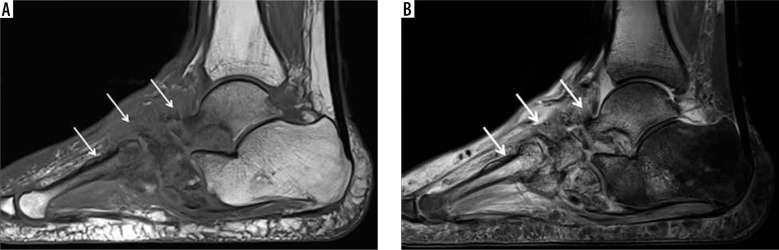
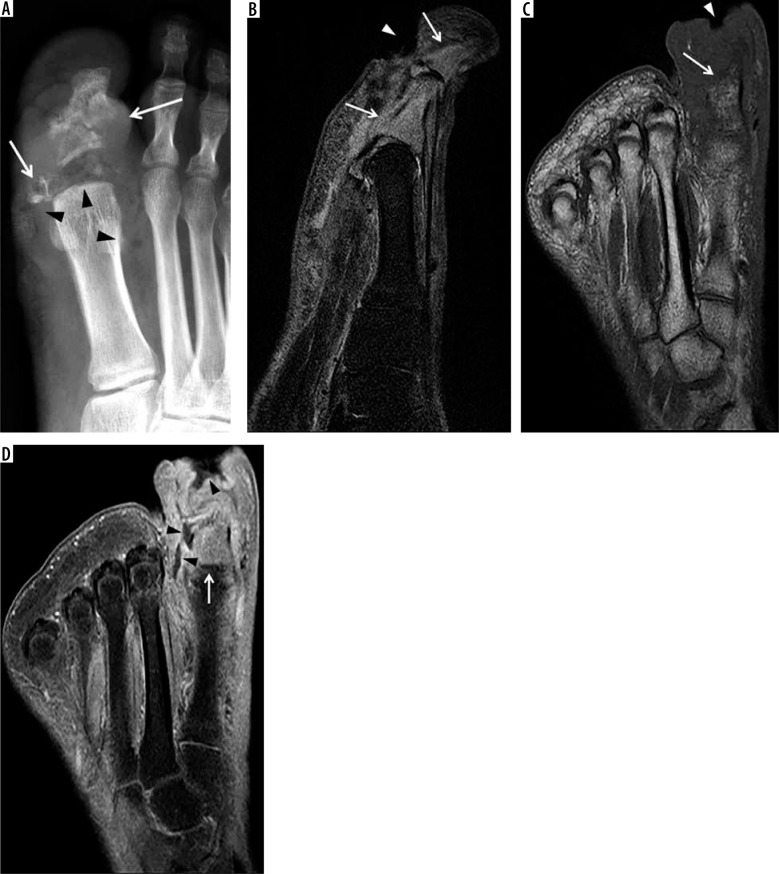
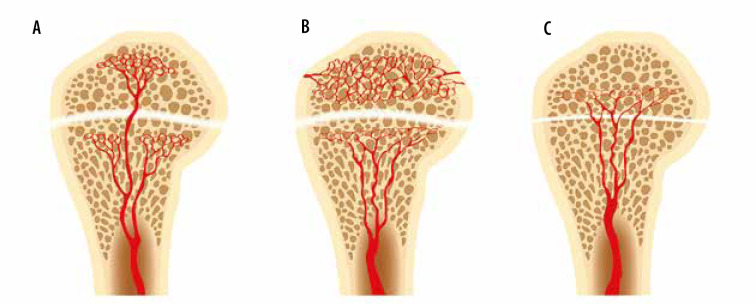
Magnetic resonance imaging (MRI) is a powerful imaging modality in the evaluation of musculoskeletal (MSK) soft tissue, joint, and bone infections. It allows prompt diagnosis and assessment of the extent of disease, which permits timely treatment to optimize long-term clinical outcomes. MRI is highly sensitive and specific in detecting the common findings of MSK infections, such as superficial and deep soft tissue oedema, joint, bursal and tendon sheath effusions, lymphadenopathy, bone marrow oedema, erosive bone changes and periostitis, and bone and cartilage destruction and sequestration. Contrast-enhanced MRI allows detection of non-enhancing fluid collections and necrotic tissues, rim-enhancing abscesses, heterogeneously or diffusely enhancing phlegmons, and enhancing active synovitis. Diffusion-weighted imaging (DWI) is useful in detecting soft-tissue abscesses, particularly in patients who cannot receive gadolinium-based intravenous contrast. MRI is less sensitive than computed tomography (CT) in detecting soft-tissue gas. This article describes the pathophysiology of pyogenic MSK infections, including the route of contamination and common causative organisms, typical MR imaging findings of various soft tissue infections including cellulitis, superficial and deep fasciitis and necrotizing fasciitis, pyomyositis, infectious bursitis, infectious tenosynovitis, and infectious lymphadenitis, and of joint and bone infections including septic arthritis and osteomyelitis (acute, subacute, and chronic). The authors also discuss MRI findings and pitfalls related to infected hardware and diabetic foot infections, and briefly review standards of treatment of various pyogenic MSK infections.

Keywords: MRI; cellulitis; fasciitis; osteomyelitis; pyomyositis; septic arthritis.


Conflict of interest statement

The authors declare that they have no conflict of interest.

Figures

Figure 1
Figure 1
A 46-year-old female intravenous drug user with right hand cellulitis, subcutaneous abscess, and septic superficial thrombophlebitis. Axial T1-weighted magnetic resonance image with fat saturation post intravenous gadolinium-based contrast shows heterogeneous enhancement of the right hand dorsal subcutaneous tissues related to cellulitis with a rim-enhancing abscess (dashed arrow) and multiple small rim-enhancing superficial veins with central non-enhancement consistent with septic thrombophlebitis (solid arrows)
Figure 2
Figure 2
A 50-year-old female with myeloid leukaemia on chemotherapy, with neutropaenia and right gluteal infection with soft-tissue abscess. A) Axial T2-weighted magnetic resonance image with fat saturation shows high signal intensity lobulated intramuscular right gluteal fluid collection (arrows) with surrounding patchy high-signal muscular oedema and overlying subcutaneous oedema. B) The fluid collection shows intermediate signal intensity on the axial T1-weighted MR image without fat saturation (arrows) with higher signal intensity rim consistent with penumbra sign. Note diffuse decreased bone marrow signal intensity in keeping with myeloid leukaemia. C) On the axial T1-weighted MR image with fat saturation post intravenous gadolinium-based contrast administration the lesion shows rim enhancement and no internal enhancement consistent with an abscess. Note heterogeneously enhancing surrounding muscular oedema consistent with myositis/phlegmon. DWI MRI shows high signal intensity within the intramuscular abscess in (D) axial fractional anisotropy/trace image and restricted diffusion with low signal intensity in (E) ADC map image. Surrounding myositis and overlying cellulitis show heterogeneous high signal intensity in both (D) and (E) consistent with T2 shine-through effect. In (A), (D), and (E) note a small amount of high signal intensity pre-sacral oedema
Figure 3
Figure 3
A 13-year-old male with sensory neuropathy and left thigh pyomyositis, fasciitis, and lymphadenitis. A) Axial STIR magnetic resonance (MR) image shows heterogeneous high signal intensity of the vastus lateralis and quadratus femoris musculature (arrows) with oedema in the adjacent deep fascial planes, which show intermediate signal in (B). Axial T1-weighted MR image (arrows). C) Axial T1-weighted MR image with fat saturation post intravenous gadolinium-based contrast shows avid heterogeneous enhancement of the affected musculature and deep fascial planes consistent with pyomyositis (arrows) and deep fasciitis with several non-enhancing intramuscular abscesses in the vastus lateralis muscle (arrowheads). D) Axial T1-weighted magnetic resonance MR image with fat saturation post intravenous gadolinium-based contrast shows avid heterogeneous enhancement of the gluteus medius muscle consistent with pyomyositis (solid arrows) with 2 small non-enhancing intramuscular abscesses (arrowheads). Note heterogeneously enhancing moderate inguinal lymphadenopathy (dashed arrow)
Figure 4
Figure 4
Necrotizing fasciitis in a 63-year-old male with poorly controlled diabetes mellitus type II, recurrent pedal soft tissue infections and osteomyelitis, and peripheral neuropathy. The patient was admitted to the ICU with fevers and worsening left lower extremity pain and swelling for 2 days, and had a nonhealing ulcer along the plantar surface of the foot. A) Lateral foot radiograph shows extensive soft tissue gas in the distal lower leg and plantar forefoot (arrows). There is plantar cutaneous ulceration over the metatarsophalangeal joints. B) Axial proton density-weighted without fat saturation and (C) axial T2-weighted with fat suppression magnetic resonance images of the mid lower leg show extensive areas of superficial and intermuscular fascial low signal intensity foci, consistent with soft tissue gas (arrows). This is associated with areas of patchy muscle oedema consistent with myositis, and circumferential subcutaneous oedema in keeping with cellulitis. D) Axial T1-weighted MR image with fat saturation post intravenous gadolinium-based contrast of the same region shows a non-enhancing area along the intermuscular facia of the posterior compartment associated with foci of gas consistent with necrosis (arrows). Mild peripheral enhancement is present, consistent with fasciitis. Note, heterogeneous muscular and subcutaneous soft tissue enhancement consistent with myositis and cellulitis. Together, these findings are highly concerning for soft-tissue infection with a gas-forming organism. Cultures from a subsequent emergent surgical debridement yielded polymicrobial infection, including Pseudomonas aeruginosa
Figure 5
Figure 5
A 44-year-old male with left thigh pain related to diabetic myonecrosis. A) Coronal STIR magnetic resonance (MR) image shows markedly increased signal intensity involving the mildly enlarged anteromedial left thigh musculature (arrow) with overlying mild subcutaneous oedema, which demonstrates intermediate signal intensity isointense to skeletal muscle in (B) coronal T1-weighted MR image. C) Coronal T1-weighted MR image with fat saturation post intravenous administration of gadolinium-based contrast shows an irregular non-enhancing area of myonecrosis with mildly enhancing affected surrounding anteromedial left thigh musculature related to granulation tissue and myositis
Figure 6
Figure 6
A 55-year-old female with septic arthritis and osteomyelitis of the left hip with associated septic iliopsoas bursitis. A) Coronal and (B) axial T1-weighted magnetic resonance image with fat saturation post intravenous gadolinium-based contrast shows left hip joint space narrowing, cortical erosions, and mild lateral subluxation of the femoral head with avid bone marrow enhancement of the femoral head and neck, and to a lesser extent of the acetabulum, and moderate distension of the joint capsule with irregular thick synovial enhancement and non-enhancing fluid consistent with septic arthritis and osteomyelitis (dashed arrows). Note moderate distension of the communicating left iliopsoas bursa with thick enhancing synovitis and non-enhancing fluid consistent with septic bursitis (solid arrows)
Figure 7
Figure 7
A 59-year-old male with uncontrolled diabetes mellitus, methicillin-susceptible Staphylococcus aureus and Group A streptococcal septic arthritis and osteomyelitis of the left middle finger metacarpophalangeal (MCP) joint, cellulitis, and septic tenosynovitis. A) Posteroanterior radiograph shows marked narrowing of the 3rd MCP joint with erosive bone changes along the metacarpal head and proximal phalangeal base consistent with septic joint and osteomyelitis. B) Coronal proton density-weighted magnetic resonance (MR) image with fat saturation shows narrowing of the 3rd MCP joint with erosive bone changes along the articular surfaces and marked high signal intensity bone marrow oedema involving the near entire 3rd metacarpal and proximal phalanx with associated periarticular periosteal thickening (arrows). Note associated extensive high signal intensity soft tissue oedema. The affected bone structures show low signal intensity with bone marrow effacement in (C) coronal T1-weighted MR image (arrows). D) Coronal T1-weighted MR image with fat saturation post intravenous gadolinium-based contrast shows marked enhancement of the affected bones with erosive bone changes about the 3rd MCP joint (white arrows), consistent with septic joint and osteomyelitis. Note serpiginous area of non-enhancement extending over the joint space consistent with necrotic bone (black arrows). There is additional extensive enhancement of the affected infected soft tissues. E) Axial proton density-weighted MR image with fat saturation shows high signal bone marrow oedema in the third proximal phalanx, high signal overlying soft tissue oedema, and a mildly distended middle finger flexor tenon sheath with heterogeneous increased signal intensity synovial-fluid complex (arrow). F) Axial T1-weighted MR image shows bone marrow effacement of the 3rd proximal phalanx with decreased intermediate signal in the overlying soft tissues including the flexor tendon sheath (arrow). G) Axial T1-weighted MR image with fat saturation post intravenous gadolinium-based contrast shows enhancement of the affected bony and soft tissue structures with thick synovial enhancement of the middle finger flexor tendon sheath (solid arrow) and a small amount of non-enhancing peritendinous fluid (dashed arrow) consistent with septic tenosynovitis
Figure 8
Figure 8
A 3-year-old male with Staphylococcus aureus acute osteomyelitis and subperiosteal abscess of the left tibia. A) Sagittal STIR magnetic resonance (MR) image shows heterogeneous increased signal intensity involving the left tibia throughout the bone marrow with several higher signal intensity intraosseous abscesses (black arrows), large heterogeneous high signal intensity posterior subperiosteal collection/abscess (solid white arrows), and high signal intensity periostitis along the distal tibial diametaphysis (dashed white arrow). Note high signal intensity in the overlying soft tissues related to cellulitis. B) On the sagittal T1-weighted MR image the intraosseous (black arrows) and subperiosteal (solid white arrows) abscesses and the anterior distal tibial periosteal thickening (dashed white arrow) show heterogeneous decreased signal intensity. Note serpiginous proximal extension of decreased signal intensity throughout the tibial diaphysis with interspersed preserved bone marrow fat of high signal intensity, which is frequently seen in acute osteomyelitis. C) Sagittal T1-weighted MR image with fat saturation post intravenous gadolinium-based contrast shows heterogeneous bone marrow enhancement throughout the majority of the tibia with non-enhancing intraosseous abscesses, rim enhancing large posterior subperiosteal abscess with central nonenhancement (solid white arrows), and enhancing distal diametaphyseal periostitis (dashed white arrow). Note heterogeneously enhancing overlying cellulitis
Figure 9
Figure 9
A 54-year-old male with chronic active polymicrobial including methicillin-resistant Staphylococcus aureus osteomyelitis at the medial aspect of the left distal tibia with overlying cellulitis after a burn 1 year ago. A) Anteroposterior radiograph shows a linear area of sclerosis at the periphery of the distal medial tibial metaphysis consistent with a sequestrum (arrow) with associated cortical defect/cloaca (between white arrowheads) and curvilinear lucency along the lateral aspect related to infection cavity with overlying reactive sclerosis/new bone formation related to involucrum (black arrowheads). B) Axial STIR magnetic resonance (MR) image shows low signal intensity sequestrum (arrow) with surrounding high signal intensity infection cavity, cortical defect/cloaca (between the white arrowheads), overlying central ill-defined low signal/involucrum (black arrowheads), adjacent high signal bone marrow oedema, and overlying high signal soft tissue oedema. C) On the axial T1-weighted MR image, note low signal intensity sequestrum (arrow) surrounded by intermediate signal infection cavity with medial cortical defect/cloaca and inner area of ill-defined low signal intensity involucrum (black arrowheads). D) Coronal T1-weighted MR image with fat saturation post intravenous gadolinium-based contrast shows non-enhancing low signal intensity sequestrum surrounded by avidly enhancing phlegmon with medial cortical defect/cloaca (between white arrowheads) and mildly heterogeneously enhancing involucrum at the lateral aspect (black arrowheads) with adjacent enhancing bone marrow oedema. Note heterogeneously enhancing overlying soft tissue oedema consistent with cellulitis
Figure 10
Figure 10
A 5-year-old male with Brodie abscess crossing the right proximal tibial physis. A) Internal oblique radiograph shows a circumscribed destructive osteolytic lesion at the medial aspect of the proximal tibial metaphysis involving the unfused physis and extending into the adjacent epiphysis with associated thin rim of reactive sclerosis (arrow). B) Sagittal proton density-weighted magnetic resonance (MR) image with fat saturation shows a lobulated lesion of high signal intensity lesion at the posteromedial aspect of the proximal tibial metaphysis with involvement of the physis and extension into the adjacent epiphysis with a tram-track-like rim of peripheral intermediate and central high signal consistent with brodie abscess (arrow) with adjacent high signal intensity bone marrow oedema. Note heterogeneous increased signal in the adjacent posterior soft tissues. C) On the sagittal T1-weighted MR image note decreased signal intensity in the affected bony structures with higher intermediate signal rim at the periphery of Brodie abscess consistent with hyperaemic phlegmonous tissue known as penumbra sign (arrow) with overlying thin linear low signal intensity consistent with reactive sclerosis. The affected posterior soft tissues show heterogeneous signal. D) Sagittal T1-weighted MR image with fat saturation post intravenous gadolinium-based contrast shows rim enhancing abscess cavity with central non-enhancement. Note surrounding linear low signal intensity related to reactive sclerosis. Also note enhancement of the surrounding bone marrow oedema, posterior periosteum, and adjacent posterior soft tissues
Figure 11
Figure 11
A 66-year-old female with Bacteroides fragilis L4-L5 discitis/osteomyelitis associated with epidural and prevertebral abscesses. Axial (A) and sagittal (B) T1-weighted magnetic resonance images post intravenous administration of gadolinium-based contrast show rim enhancing epidural (red arrows) and left prevertebral (blue arrow) soft-tissue abscesses. The epidural (red arrows) and left prevertebral (blue arrow) soft-tissue abscesses show high signal intensity on axial (C) and sagittal (D) diffusion-weighted imaging trace images and low signal intensity consistent with restricted diffusion on axial (E) and sagittal (F) ADC maps
Figure 12
Figure 12
A 90-year-old male with severe back pain without fever, with positive diffusion-weighted imaging (DWI) “claw sign” compatible with Modic type I degenerative changes at L1-L2. Sagittal diffusion (A) and STIR (B) magnetic resonance images show well-marginated, linear regions of high signal at the L1-L2 level situated within the adjacent vertebral bodies at the interface of normal with abnormal marrow consistent with DWI “claw sign” associated with Modic type I degenerative changes
Figure 13
Figure 13
A 62-year-old male with group B Streptococcus L3-L4 and L5-S1 discitisosteomyelitis and lack of diffusion-weighted imaging (DWI) “claw sign”. Sagittal STIR (A) magnetic resonance (MR) image shows diffuse high signal intensity at the L3-L4 level involving the near entire vertebral bodies with marked disc space narrowing (arrows). At the L5-S1 level, note similar but less extensive diffuse high signal intensity of the L5 and S1 vertebral bodies (arrows) with more intense high signal intensity at the disc space eroding into the adjacent central vertebral body endplates (arrowheads). T1-weighted sagittal (B) MR image with fat saturation post intravenous administration of gadolinium-based contrast shows diffuse bone marrow enhancement of the affected vertebral bodies at both levels (arrows) with non-enhancement of the L5-S1 disc space consistent with discitis-osteomyelitis and most extensive enhancement at the central aspect of the opposing vertebral body endplates (arrowheads), possibly representing phlegmons. Sagittal diffusion (C) and ADC map (D) MR images show high signal intensity in the affected vertebral bodies and disc spaces (arrows) without DWI “claw sign”
Figure 14
Figure 14
A 22-year-old male with Streptococcus anginosus L1-L2 discitis-osteomyelitis and diffusion- restricted intradiscal abscess. Sagittal STIR (A) magnetic resonance (MR) image shows mild increased signal of the L1 and L2 vertebral bodies with an irregular high signal intensity intradiscal abscess (arrow) eroding into the adjacent vertebral body endplates. Sagittal T1-weighted MR image with fat saturation post gadolinium-based intravenous contrast shows marked enhancement of the L1 and L2 vertebral bodies with non-enhancing intradiscal abscess (arrow). Sagittal diffusion (C) image demonstrates high signal intensity within the intradiscal abscess (arrow). Sagittal ADC map (D) shows low signal intensity of the intradiscal abscess consistent with restricted diffusion (arrow)
Figure 15
Figure 15
A 12-year-old male with chronic recurrent multifocal osteomyelitis (CRMO) presented with 2 weeks of persistent fever and bilateral lower extremity and left upper extremity pain. Selected coronal STIR images from whole-body magnetic resonance imaging show high signal intensity involving multiple bones including the bilateral tibiae, left talus, left medial femoral condyle, left humerus and left radius (arrows) consistent with CRMO. Courtesy of Kelley Marchall MD, Atlanta, Georgia
Figure 16
Figure 16
A 59-year-old male with infected total knee arthroplasty. A) Anteroposterior radiograph of the right knee shows soft-tissue thickening at the medial aspect of the right proximal leg (arrows) extending to the subjacent tibia. Note cortical irregularity and periostitis at the medial aspect of the proximal tibial diametaphysis (arrowheads), consistent with osteomyelitis. B) Coronal STIR magnetic resonance (MR) image shows heterogeneous high signal intensity soft tissue oedema at the medial aspect of the proximal leg (arrows) most extensive adjacent to the proximal tibia with subjacent cortical irregularity and periostitis consistent with osteomyelitis (arrowheads). C) Coronal T1-weighted MR image shows decreased intermediate signal intensity in the affected proximal medial leg soft tissues (arrows) with cortical irregularity, indistinctness, and periostitis of intermediate signal intensity along the proximal medial tibial diametaphysis (arrowheads). D) On the T1-weighted coronal MR image post intravenous administration of gadolinium-based contrast note non-enhancing soft tissue abscess (arrows) with enhancing surrounding phlegmonous tissues extending to the subjacent proximal tibia, which shows cortical indistinctness and enhancement consistent with osteomyelitis
Figure 17
Figure 17
A 62-year-old male with insulin-dependent type II diabetes mellitus and right foot swelling without associated ulcer and no fever or laboratory findings suggestive of infection. A) Sagittal T1-weighted magnetic resonance (MR) image shows destructive changes and marked decreased signal intensity involving the entire midfoot, talar head and neck, part of the anterior process of the calcaneus, and the majority of the visualized metatarsal bone (arrows). B) Sagittal proton density-weighted MR image with fat saturation shows heterogeneous increased signal intensity in the affected bones with overlying soft tissue oedema, which is in conjunction with clinical and laboratory findings most consistent with Charcot arthropathy
Figure 18
Figure 18
A 40-year-old male with insulin-dependent diabetes mellitus, methicillin-resistant Staphylococcus aureus infection, and draining deep soft ulcer at the distal aspect of the great toe with associated MRSA soft-tissue infection of the great toe with osteomyelitis involving the phalanges and septic interphalangeal joint. A) Anteroposterior radiograph shows destructive changes and fragmentation of the great toe phalanges (arrows) with overlying soft tissue oedema and irregularity. Note associated scattered foci of soft tissue gas extending into the great toe interphalangeal joint and along the distal first metatarsal (arrowheads). B) Sagittal STIR magnetic resonance (MR) image shows a deep plantar soft-tissue ulcer along the distal aspect of the great toe extending to the interphalangeal joint (arrowhead). There is diffuse increased signal intensity involving the great toe phalanges (arrows). Note extensive high signal intensity soft tissue oedema more pronounced along the plantar aspect of the great toe. C) Axial T1-weighted MR image shows deep soft tissue ulcer at the distal aspect of the great toe (arrowhead) and marked destructive changes of the great toe phalanges with foci of low signal intensity bone marrow effacement (arrow). D) Axial T1-weighted MR image with fat saturation post intravenous gadolinium-based contrast shows marked enhancement of the affected great toe phalanges (arrow) and markedly enhancing overlying soft tissue oedema with scattered small rim enhancing fluid collections consistent with abscesses as well as a small amount of draining fluid at the base of the soft-tissue ulcer (arrowheads)
Figure 19
Figure 19
An artist’s drawing of the end of the long bone blood supply (A) in an infant with the metaphyseal vessels crossing the open physis and extending into the epiphysis, B) child (1-16 years old) without extension of the metaphyseal vessels through the open physis into the epiphysis, and (C) adult with metaphyseal vessels extending through the closed physis into the epiphysis
Figure 20
Figure 20
Cellulitis of the left gluteal region in a 36-year-old female patient. Gluteal region photograph shows redness of the skin consistent with cellulitis. Courtesy of Jordan Smith MD, Tuscon, Arizona
Figure 21
Figure 21
Necrotizing fasciitis of the lower leg in a 40-year-old male patient. Lower leg photograph shows marked discoloration of the skin with an area of necrosis (arrows). Courtesy of Jordan Smith, Tuscon, Arizona
Figure 22
Figure 22
An artist’s drawing of osteomyelitis progression, subacute to chronic. A) Initial site of osteomyelitis involving the medial aspect of the long bone metaphysis/intraosseous abscess (green). B) The abscess extends through the cortex into the subperiosteal space forming subperiosteal abscess (shades of green). C) Chronic osteomyelitis with a detached central necrotic bone fragment/sequestrum (brown) within the intraosseous abscess (green) with peripheral new bone formation/involucrum and a cortical and periosteal opening in the involucrum/cloaca allowing pus to escape

Similar articles

Cited by

References

    1. Turecki MB, Taljanovic MS, Stubbs AY, et al. . Imaging of musculoskeletal soft tissue infections. Skeletal Radiol 2010; 39: 957-971. - PubMed
    1. Headley AJ. Necrotizing soft tissue infections: a primary care review. Am Fam Physician 2003; 68: 323-328. - PubMed
    1. Hill MK, Sanders CV. Skin and soft tissue infections in critical care. Crit Care Clin 1998; 14: 251-262. - PubMed
    1. Expert Panel on Musculoskeletal Imaging; Beaman FD, von Herrmann PF, Kransdorf MJ, et al. . ACR Appropriateness Criteria(®) suspected osteomyelitis, septic arthritis, or soft tissue infection (excluding spine and diabetic foot). J Am Coll Radiol 2017; 14 (5S): S326-S337. - PubMed
    1. Walker EA, Beaman FD, Wessell DE, et al. . ACR Appropriateness Criteria® suspected osteomyelitis of the foot in patients with diabetes mellitus. J Am Coll Radiol 2019, 16 (11S): S440-S450. - PubMed