Activity-Based NIR Bioluminescence Probe Enables Discovery of Diet-Induced Modulation of the Tumor Microenvironment via Nitric Oxide
- PMID: 35505872
- PMCID: PMC9052803
- DOI: 10.1021/acscentsci.1c00317
Activity-Based NIR Bioluminescence Probe Enables Discovery of Diet-Induced Modulation of the Tumor Microenvironment via Nitric Oxide
Abstract
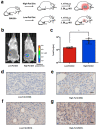
Nitric oxide (NO) plays a critical role in acute and chronic inflammation. NO's contributions to cancer are of particular interest due to its context-dependent bioactivities. For example, immune cells initially produce cytotoxic quantities of NO in response to the nascent tumor. However, it is believed that this fades over time and reaches a concentration that supports the tumor microenvironment (TME). These complex dynamics are further complicated by other factors, such as diet and oxygenation, making it challenging to establish a complete picture of NO's impact on tumor progression. Although many activity-based sensing (ABS) probes for NO have been developed, only a small fraction have been employed in vivo, and fewer yet are practical in cancer models where the NO concentration is <200 nM. To overcome this outstanding challenge, we have developed BL660-NO, the first ABS probe for NIR bioluminescence imaging of NO in cancer. Owing to the low intrinsic background, high sensitivity, and deep tissue imaging capabilities of our design, BL660-NO was successfully employed to visualize endogenous NO in cellular systems, a human liver metastasis model, and a murine breast cancer model. Importantly, its exceptional performance facilitated two dietary studies which examine the impact of fat intake on NO and the TME. BL660-NO provides the first direct molecular evidence that intratumoral NO becomes elevated in mice fed a high-fat diet, which became obese with larger tumors, compared to control animals on a low-fat diet. These results indicate that an inflammatory diet can increase NO production via recruitment of macrophages and overexpression of inducible nitric oxide synthase which in turn can drive tumor progression.
© 2022 The Authors. Published by American Chemical Society.
Conflict of interest statement
The authors declare no competing financial interest.
Figures


Similar articles
-
Hydrolysis-Resistant Ester-Based Linkers for Development of Activity-Based NIR Bioluminescence Probes.J Am Chem Soc. 2023 Jan 18;145(2):1460-1469. doi: 10.1021/jacs.2c12984. Epub 2023 Jan 5. J Am Chem Soc. 2023. PMID: 36603103 Free PMC article.
-
Tumor Microenvironment and Nitric Oxide: Concepts and Mechanisms.Adv Exp Med Biol. 2020;1277:143-158. doi: 10.1007/978-3-030-50224-9_10. Adv Exp Med Biol. 2020. PMID: 33119871
-
In vivo bioluminescence imaging monitoring of hypoxia-inducible factor 1alpha, a promoter that protects cells, in response to chemotherapy.AJR Am J Roentgenol. 2008 Dec;191(6):1779-84. doi: 10.2214/AJR.07.4060. AJR Am J Roentgenol. 2008. PMID: 19020250
-
Cooperation of liver cells in health and disease.Adv Anat Embryol Cell Biol. 2001;161:III-XIII, 1-151. doi: 10.1007/978-3-642-56553-3. Adv Anat Embryol Cell Biol. 2001. PMID: 11729749 Review.
-
Nitric Oxide Synthase-2-Derived Nitric Oxide Drives Multiple Pathways of Breast Cancer Progression.Antioxid Redox Signal. 2017 Jun 20;26(18):1044-1058. doi: 10.1089/ars.2016.6813. Epub 2016 Sep 7. Antioxid Redox Signal. 2017. PMID: 27464521 Free PMC article. Review.
Cited by
-
Effects of dietary intervention on human diseases: molecular mechanisms and therapeutic potential.Signal Transduct Target Ther. 2024 Mar 11;9(1):59. doi: 10.1038/s41392-024-01771-x. Signal Transduct Target Ther. 2024. PMID: 38462638 Free PMC article. Review.
-
Activity-based Photoacoustic Probes Reveal Elevated Intestinal MGL and FAAH Activity in a Murine Model of Obesity.Angew Chem Int Ed Engl. 2022 Nov 2;61(44):e202211774. doi: 10.1002/anie.202211774. Epub 2022 Oct 5. Angew Chem Int Ed Engl. 2022. PMID: 36083191 Free PMC article.
-
Activity-Based Bioluminescent Logic-Gate Probe Reveals Crosstalk Between the Inflammatory Tumor Microenvironment and ALDH1A1 in Cancer Cells.JACS Au. 2024 Dec 28;5(1):320-331. doi: 10.1021/jacsau.4c01001. eCollection 2025 Jan 27. JACS Au. 2024. PMID: 39886570 Free PMC article.
-
Organic probes for NO-activatable biomedical imaging: NIR fluorescence, self-luminescence, and photoacoustic imaging.Chem Sci. 2025 Jul 14;16(30):13574-13593. doi: 10.1039/d5sc03611a. eCollection 2025 Jul 30. Chem Sci. 2025. PMID: 40698164 Free PMC article. Review.
-
Xanthene-Based Nitric Oxide-Responsive Nanosensor for Photoacoustic Imaging in the SWIR Window.Angew Chem Int Ed Engl. 2023 Mar 20;62(13):e202214855. doi: 10.1002/anie.202214855. Epub 2023 Feb 17. Angew Chem Int Ed Engl. 2023. PMID: 36722146 Free PMC article.
References
-
- Shreshtha S.; Sharma P.; Kumar P.; Sharma R.; Singh S. Nitric Oxide: It’s Role in Immunity. J. Clin. Diagn. Res. 2018, 12 (7), BE01–BE05. 10.7860/JCDR/2018/31817.11764. - DOI
LinkOut - more resources
Full Text Sources
Miscellaneous
