. 2022 Apr 27;8(4):417-429.
doi: 10.1021/acscentsci.1c01603. Epub 2022 Feb 14.

Profiling the Landscape of Drug Resistance Mutations in Neosubstrates to Molecular Glue Degraders

Affiliations

Profiling the Landscape of Drug Resistance Mutations in Neosubstrates to Molecular Glue Degraders

Pallavi M Gosavi et al. ACS Cent Sci. .

Abstract

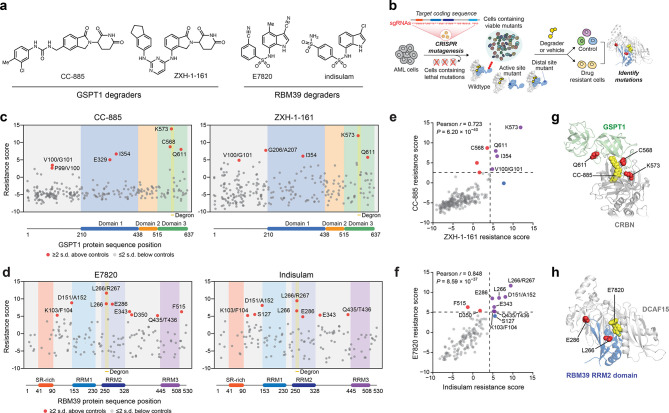
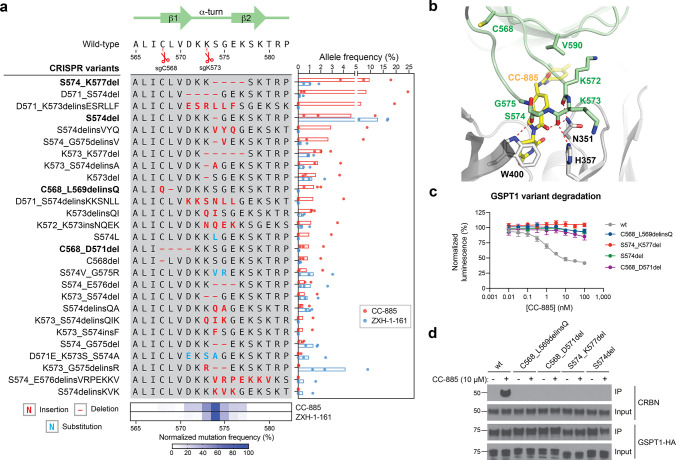
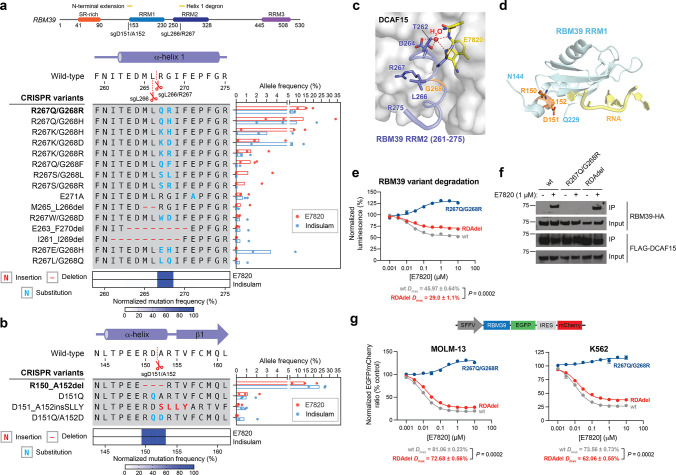
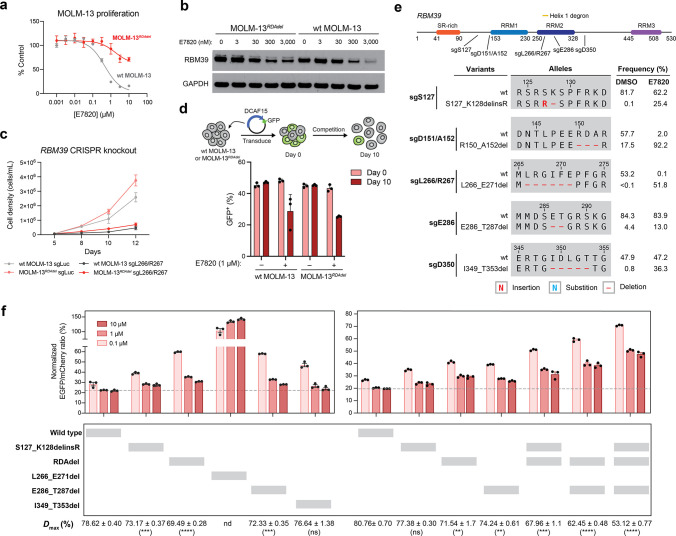
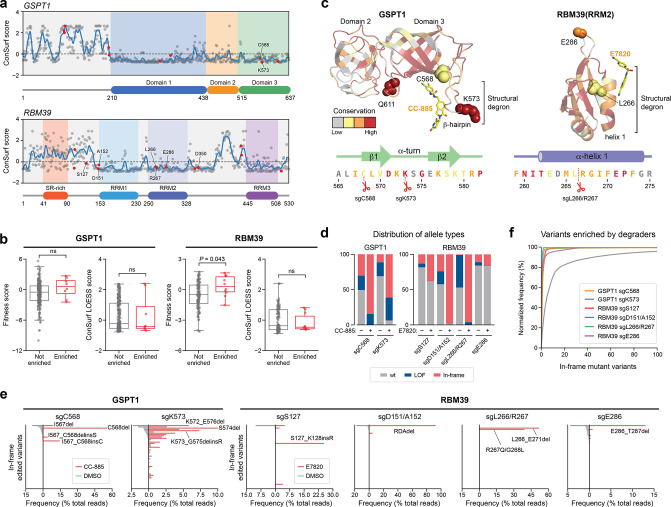
Targeted protein degradation (TPD) holds immense promise for drug discovery, but mechanisms of acquired resistance to degraders remain to be fully identified. Here, we used clustered regularly interspaced short palindromic repeats (CRISPR)-suppressor scanning to identify mechanistic classes of drug resistance mutations to molecular glue degraders in GSPT1 and RBM39, neosubstrates targeted by E3 ligase substrate receptors cereblon and DCAF15, respectively. While many mutations directly alter the ternary complex heterodimerization surface, distal resistance sites were also identified. Several distal mutations in RBM39 led to modest decreases in degradation, yet can enable cell survival, underscoring how small differences in degradation can lead to resistance. Integrative analysis of resistance sites across GSPT1 and RBM39 revealed varying levels of sequence conservation and mutational constraint that control the emergence of different resistance mechanisms, highlighting that many regions co-opted by TPD are nonessential. Altogether, our study identifies common resistance mechanisms for molecular glue degraders and outlines a general approach to survey neosubstrate requirements necessary for effective degradation.


Conflict of interest statement

The authors declare the following competing financial interest(s): Brian Liau is on the scientific advisory board of H3 Biomedicine.

Figures

Figure 1
Figure 1
CRISPR-suppressor scanning identifies regions of GSPT1 and RBM39 that mediate targeted protein degradation by molecular glue degraders. (a) Chemical structures of degraders used in this study. (b) Schematic showing the CRISPR-suppressor scanning workflow applied to molecular glue degraders. (c) Scatter plot showing resistance scores (y axis) in MOLM-13 under CC-885 (left) or ZXH-1-161 (right) treatment at four weeks. Resistance scores were calculated as the log2(fold-change sgRNA enrichment under drug treatment) normalized to the mean of the negative control sgRNAs (n = 22). The GSPT1-targeting sgRNAs (n = 239) are arrayed by amino acid position in the GSPT1 CDS on the x axis corresponding to the position of the predicted cut site. When the sgRNA cut site falls between two amino acids, both amino acids are denoted. Data points represent mean values across three replicate treatments. Protein domains and the structural degron site are demarcated by the colored panels. (d) Scatter plots showing resistance scores (y axis) in MOLM-13 under E7820 (left) or indisulam (right) treatment at four weeks. Resistance scores were calculated as the log2(fold-change sgRNA enrichment under drug treatment) normalized to the mean of the negative control sgRNAs (n = 77). The RBM39-targeting sgRNAs (n = 129) are arrayed by the amino acid position in the RBM39 CDS on the x axis corresponding to the position of the predicted cut site. Data points represent the mean values across three replicate treatments. Protein domains and the structural degron site are demarcated by the colored panels. (e) Scatter plot showing GSPT1-targeting sgRNA resistance scores under CC-885 (y axis) or ZHX-1-161 (x axis) treatment at 4 weeks. Dotted lines represent two s.d. above the mean of the negative control sgRNAs. Pearson’s r and two-sided P values are shown. (f) Scatter plot showing RBM39-targeting sgRNA resistance scores under E7820 (y axis) or indisulam (x axis) treatment at four weeks. Dotted lines represent two s.d. above the mean of the negative control sgRNAs. Pearson’s r and two-sided P values are shown. (g) Structural view of the CC-885-CRBN-GSPT1 ternary complex showing the location of top-enriched sgRNAs (red) (Protein Data Bank (PDB: 5HXB)). (h) Structural view of the E7820-DCAF15-RBM39(RRM2) ternary complex showing the location of top-enriched sgRNAs (red) (PDB: 6UE5).
Figure 2
Figure 2
CC-885 resistance mutations alter the GSPT1 β-hairpin structural degron and impair GSPT1 degradation. (a) Left: Schematic shows the coding variants of the most abundant in-frame mutations enriched in the β-hairpin structural degron of GSPT1 (>1% frequency in any condition). Right: Bar plot showing frequency (%, x axis) of each variant. Bars represent the mean across three replicate treatments, and dots show the individual replicate values. Bottom: Heat map showing normalized mutational frequency (y axis, %) by sequence position (x axis). Mutational frequency was normalized as a percentage of the total frequency of the displayed variants. (b) Structural view of the CC-885-CRBN-GSPT1 ternary complex, with key residues in CRBN (gray) and GSPT1 (green) highlighted. Carbon atoms of CC-885 are depicted in yellow (PDB: 5HXB). (c) Dose–response curves for wt and mutant HiBiT-GSPT1-HA cellular protein levels, as indicated by vehicle-normalized luminescence (y axis, %), in HEK293T cells treated with CC-885 for 6 h. Data represent mean ± s.e.m. across three technical replicates. One of two independent experiments is shown. (d) Immunoblots showing co-IP of GSPT1-HA wt and mutant variants with CRBN after vehicle or CC-885 treatment (10 μM, 2 h) in transiently transfected HEK293T cells. All cells were first pretreated with MLN-4924 (1 μM, 3 h) prior to vehicle or CC-885 treatment. Co-IP was performed using anti-HA antibody. One of two independent replicates is shown.
Figure 3
Figure 3
E7820 resistance mutations in different domains of RBM39 operate via distinct mechanisms. (a) Top: Schematic of the RBM39 coding sequence. Left: Schematic shows the coding variants of the most abundant in-frame mutations enriched in the RRM2 helix 1 structural degron of RBM39 (>1% frequency in any condition). Right: Bar plot showing frequency (%, x axis) of each variant. Bars represent the mean across three replicate treatments, and dots show the individual replicate values. Bottom: Heat map showing normalized mutational frequency (y axis, %) by sequence position (x axis). Mutational frequency was normalized as a percentage of the total frequency of the displayed variants. (b) Left: Schematic shows the coding variants of the most abundant in-frame mutations enriched in the RRM1 N-terminal extension of RBM39 (>1% frequency in any condition). Right: Bar plot showing frequency (%, x axis) of each variant. Bars represent the mean across three replicate treatments, and dots show the individual replicate values. Bottom: Heat map showing normalized mutational frequency (y axis, %) by sequence position (x axis). Mutation frequency was normalized as a percentage of the total frequency of the displayed variants. (c) Structural view of the E7820-DCAF15-RBM39(RRM2) ternary complex, with key residues of RBM39 highlighted in blue. RBM39 G268 and a water molecule are highlighted in orange and red, respectively. Carbon atoms of E7820 are depicted in yellow (PDB: 6UE5). (d) Structural view of the RBM39 RRM1 domain (light blue), with key residues corresponding to the RDA deletion highlighted in orange (PDB: 4YUD). RNA molecule from a CUGBP1 structure (PDB: 3NMR) is shown in yellow, overlaid and visualized by structural alignment. (e) Dose–response curves for wt and mutant HiBiT-RBM39-HA cellular protein levels, as indicated by vehicle-normalized luminescence (y axis, %), in HEK293T cells treated with E7820 for 24 h. Data represent mean ± s.e.m. across three technical replicates. The P value was calculated using a two-sided Student’s t-test. One of two independent experiments is shown. (f) Immunoblots showing co-IP of RBM39-HA wt and mutant variants with FLAG-DCAF15 after vehicle or E7820 treatment (1 μM, 4 h) in transiently transfected HEK293T cells. All cells were first pretreated with MLN-4924 (1 μM, 2 h) prior to vehicle or E7820 treatment. Co-IP was performed using an anti-FLAG antibody. One of two independent replicates is shown. (g) Top: Schematic of the fluorescent EGFP-IRES-mCherry degradation reporter vector. Bottom: Dose–response curves for wt and mutant RBM39 cellular protein levels, as indicated by vehicle-normalized EGFP to mCherry ratio (y axis, %), in MOLM-13 (left) or K562 (right) cells treated with E7820 for 24 h. Data represent mean ± s.e.m. across three technical replicates. The Dmax ± s.e.m. and P values (two-sided Student’s t-test) are shown below. One of two independent experiments is shown for MOLM-13 cells, while one independent experiment was conducted for K562 cells.
Figure 4
Figure 4
Mutations distal to the RBM39 RRM2 helix 1 structural degron alter maximum levels of RBM39 degradation to abrogate E7820 cytotoxicity. (a) Dose–response curves for wt MOLM-13 and MOLM-13RDAdel cell proliferation relative to vehicle-treated cells (y axis, % control) after E7820 treatment for 72 h. Data represent mean ± s.e.m. across three technical replicates. One of two independent experiments is shown. (b) Immunoblots showing levels of RBM39 and GAPDH after vehicle or E7820 treatment for 24 h. One of two independent replicates is shown. (c) Line graphs showing cell proliferation (y axis) over a time course (x axis) following lentiviral transduction of SpCas9 and sgRNAs targeting luciferase (sgLuc) or RBM39 (sgL266/R267) into wt MOLM-13 and MOLM-13RDAdel cells. Data represent mean ± s.e.m. across three technical replicates. One of two independent experiments is shown. (d) Bar graphs showing fraction of GFP-positive cells (y axis) in a competition growth assay with nontransduced cells at day 0 and day 10 after treatment with either vehicle or 1 μM E7820 following lentiviral transduction of plasmid overexpressing DCAF15 and GFP in wt MOLM-13 and MOLM-13RDAdel. One of three independent replicates is shown. (e) Schematic showing the coding variants of the most abundant in-frame RBM39 mutations enriched in E7820 treatment (1 μM) by each sgRNA tested. Variant frequencies in vehicle- and E7820-treatment conditions are indicated. (f) Bar plots showing wt and mutant RBM39 cellular protein levels, as indicated by vehicle-normalized EGFP to mCherry ratio (y axis, %), in MOLM-13 cells treated with E7820 for 24 h. Data represent mean ± s.e.m. across three technical replicates. Dotted gray line indicates the mean signal of wt MOLM-13 treated with 10 μM E7820. Values for Dmax ± s.e.m. are shown (right) with significance levels from a two-sided Student’s t-test comparing to wt RBM39 Dmax indicated in parentheses (P < 10–3: ***; P < 10–4: ****; ns: not significant; nd: not determined). One of two independent experiments is shown. Full dose–response curves are shown in Figure S5d.
Figure 5
Figure 5
Resistance mutation sites across TPD targets exhibit low levels of sequence conservation. (a) ConSurf conservation scores (y axis) of amino acid residues in GSPT1 (top panel) and RBM39 (bottom panel) shown as dots with the LOESS regression line in blue. Amino acids corresponding to enriched sgRNA cut site positions from the CRISPR-suppressor scanning are highlighted in red and key residues are labeled. (b) Box plots with jitter showing fitness scores and ConSurf LOESS scores for nonenriched (gray, n = 230 for GSPT1 and 119 for RBM39) or enriched (red, n = 9 for GSPT1 and 10 for RBM39) sgRNAs. Fitness scores were calculated as the log2(fold-change sgRNA enrichment at week 4 under vehicle treatment versus the plasmid library) normalized to the mean of the negative control sgRNAs. sgRNAs were assigned ConSurf LOESS scores based on the amino acid corresponding to their predicted cut site positions; sgRNAs cutting between amino acids were assigned the mean of the flanking amino acids’ scores. Dots represent the fitness scores or corresponding amino acid ConSurf LOESS scores for individual sgRNAs. Two-sided P values were calculated with the Mann–Whitney test (ns: not significant). The box shows the median, 25th, and 75th percentiles with whiskers denoting 1.5 × the interquartile range. (c) Structural view of GSPT1(I440-P634) (left) and RBM39(RRM2) (right), with residues colored according to ConSurf conservation scores. The top three most conserved bins of ConSurf scores are colored in red, orange, and yellow, respectively, and the bottom six bins are colored in gray. sgRNAs enriched in the CRISPR-suppressor scan are depicted as spheres. Sequences corresponding to the approximate region around the structural degrons are shown below and colored according to ConSurf scores. (d) Stacked bar plot showing the frequency distribution of variant types (y axis, % of total reads) after transduction of the indicated sgRNAs targeting GSPT1 and RBM39 and treatment with vehicle or drug molecules (see Methods) for four weeks. (e) Bar plots showing variant frequencies (x axis, % of total reads) for the top 50 variants (y axis) generated by the indicated sgRNAs after treatment with vehicle (gray bars, left) or drug molecules (red bars, right) for four weeks. Variants are rank-ordered on the y axis by decreasing frequency in vehicle treatment for each sgRNA. (f) Cumulative plot showing the normalized variant frequency (y axis) for the 100 most abundant in-frame edited variants (x axis) for each indicated sgRNA after drug treatment for four weeks. Variants are rank-ordered on the x axis by decreasing normalized frequency for each respective sgRNA condition. Variant frequency was normalized to the total frequency of all in-frame edited variants.

References

    1. Chamberlain P. P.; Hamann L. G. Development of Targeted Protein Degradation Therapeutics. Nat. Chem. Biol. 2019, 15 (10), 937–944. 10.1038/s41589-019-0362-y. - DOI - PubMed
    1. Schapira M.; Calabrese M. F.; Bullock A. N.; Crews C. M. Targeted Protein Degradation: Expanding the Toolbox. Nat. Rev. Drug Discov 2019, 18 (12), 949–963. 10.1038/s41573-019-0047-y. - DOI - PubMed
    1. Wu T.; Yoon H.; Xiong Y.; Dixon-Clarke S. E.; Nowak R. P.; Fischer E. S. Targeted Protein Degradation as a Powerful Research Tool in Basic Biology and Drug Target Discovery. Nat. Struct Mol. Biol. 2020, 27 (7), 605–614. 10.1038/s41594-020-0438-0. - DOI - PMC - PubMed
    1. Jan M.; Sperling A. S.; Ebert B. L. Cancer Therapies Based on Targeted Protein Degradation — Lessons Learned with Lenalidomide. Nat. Rev. Clin Oncol 2021, 18, 401–417. 10.1038/s41571-021-00479-z. - DOI - PMC - PubMed
    1. Schreiber S. L. The Rise of Molecular Glues. Cell 2021, 184 (1), 3–9. 10.1016/j.cell.2020.12.020. - DOI - PubMed

LinkOut - more resources