First genomic prediction and genome-wide association for complex growth-related traits in Rock Bream (Oplegnathus fasciatus)
- PMID: 35505886
- PMCID: PMC9046763
- DOI: 10.1111/eva.13218
First genomic prediction and genome-wide association for complex growth-related traits in Rock Bream (Oplegnathus fasciatus)
Abstract
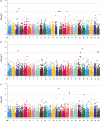
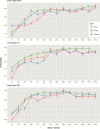
Rock Bream (Oplegnathus fasciatus) is an important aquaculture species for offshore cage aquaculture and fish stocking of marine ranching in East Asia. Genomic selection has the potential to expedite genetic gain for the key target traits of a breeding program, but has not yet been evaluated in Oplegnathus. The purposes of the present study were to explore the performance of genomic selection to improve breeding value accuracy through real data analyses using six statistical models and to carry out genome-wide association studies (GWAS) to dissect the genetic architecture of economically vital growth-related traits (body weight, total length, and body depth) in the O. fasciatus population. After quality control, genotypes for 16,162 SNPs were acquired for 455 fish. Heritability was estimated to be moderate for the three traits (0.38 for BW, 0.33 for TL, and 0.24 for BD), and results of GWAS indicated that the underlying genetic architecture was polygenic. Six statistic models (GBLUP, BayesA, BayesB, BayesC, Bayesian Ridge-Regression, and Bayesian LASSO) showed similar performance for the predictability of genomic estimated breeding value (GEBV). The low SNP density (around 1 K selected SNP based on GWAS) is sufficient for accurate prediction on the breeding value for the three growth-related traits in the current studied population, which will provide a good compromise between genotyping costs and predictability in such standard breeding populations advanced. These consequences illustrate that the employment of genomic selection in O. fasciatus breeding could provide advantages for the selection of breeding candidates to facilitate complex economic growth traits.
Keywords: Oplegnathus fasciatus; genome‐wide association; genomic selection; growth trait.
© 2021 The Authors. Evolutionary Applications published by John Wiley & Sons Ltd.
Conflict of interest statement
The authors declare that they have no conflict of interest.
Figures


References
-
- Barría, A. , Christensen, K. A. , Yoshida, G. M. , Correa, K. , & Jedlicki, A. (2018). Genomic predictions and genome‐wide association study of resistance against Piscirickettsia salmonis in Coho salmon (Oncorhynchus kisutch) using ddRAD sequencing. G3: Genes, Genomes, Genetics, 8(4), g3.200053.202018. 10.1534/g3.118.200053 - DOI - PMC - PubMed
-
- Campos, C. F. , Lopes, M. S. , Silva, F. F. E. , Veroneze, R. , Knol, E. F. , Lopes, P. S. , & Guimaraes, S. E. F. (2015). Genomic selection for boar taint compounds and carcass traits in a commercial pig population. Livestock Science, 174, 10–17. 10.1016/j.livsci.2015.01.018 - DOI
LinkOut - more resources
Full Text Sources

