

Genome size evolution of the extant lycophytes and ferns
- PMID: 35505989
- PMCID: PMC9043363
- DOI: 10.1016/j.pld.2021.11.007
Genome size evolution of the extant lycophytes and ferns
Abstract
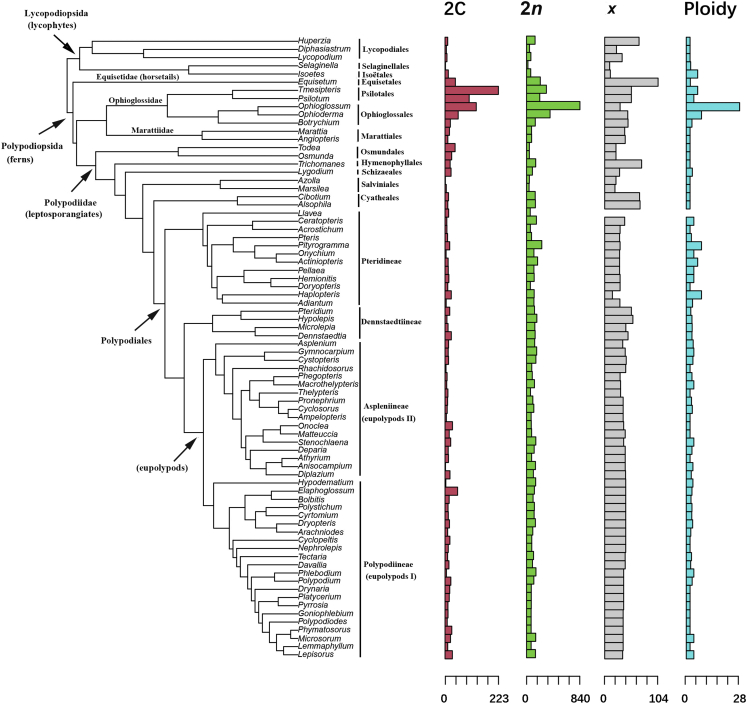
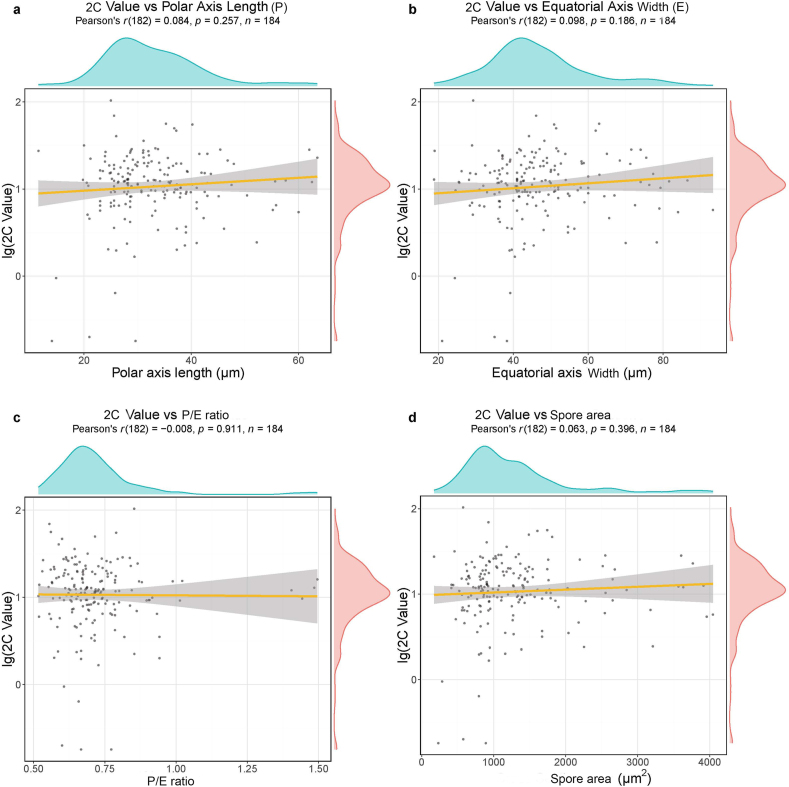
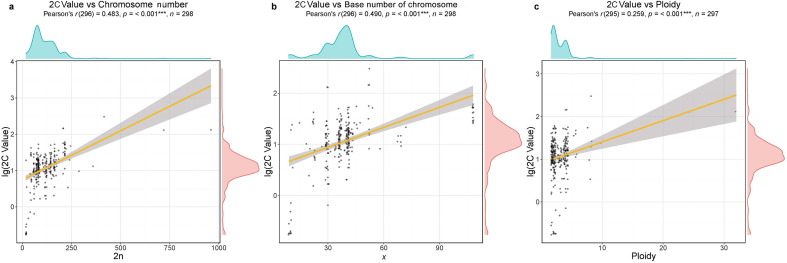
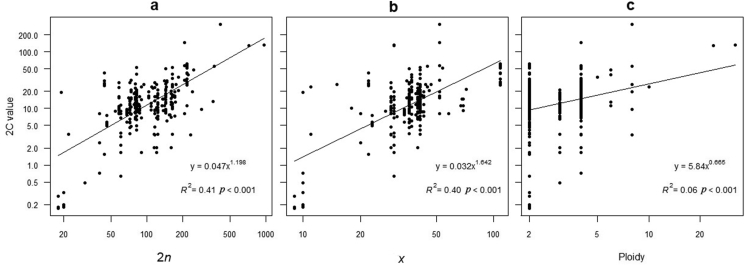
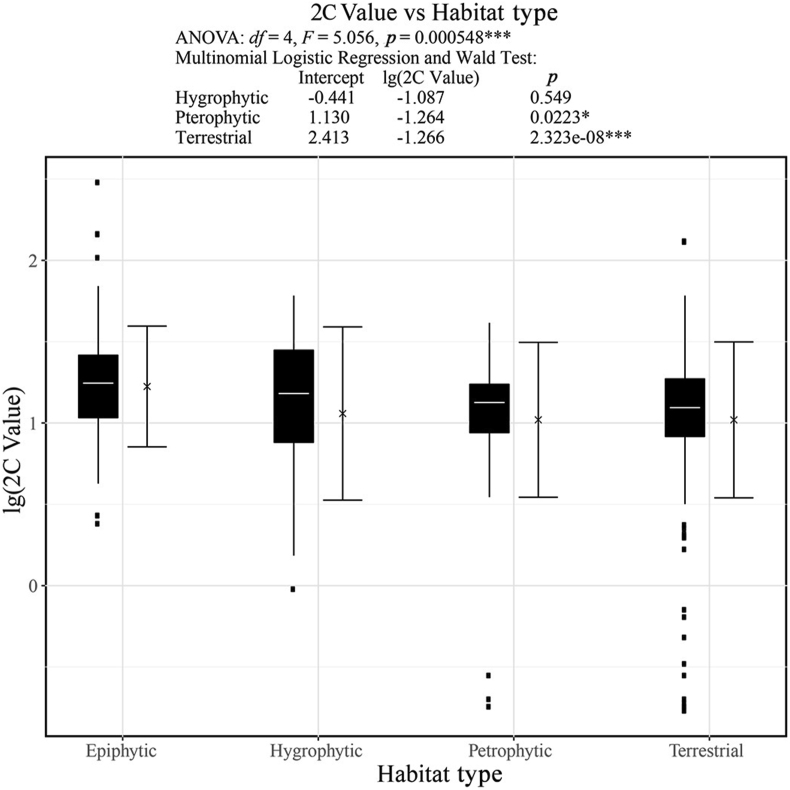
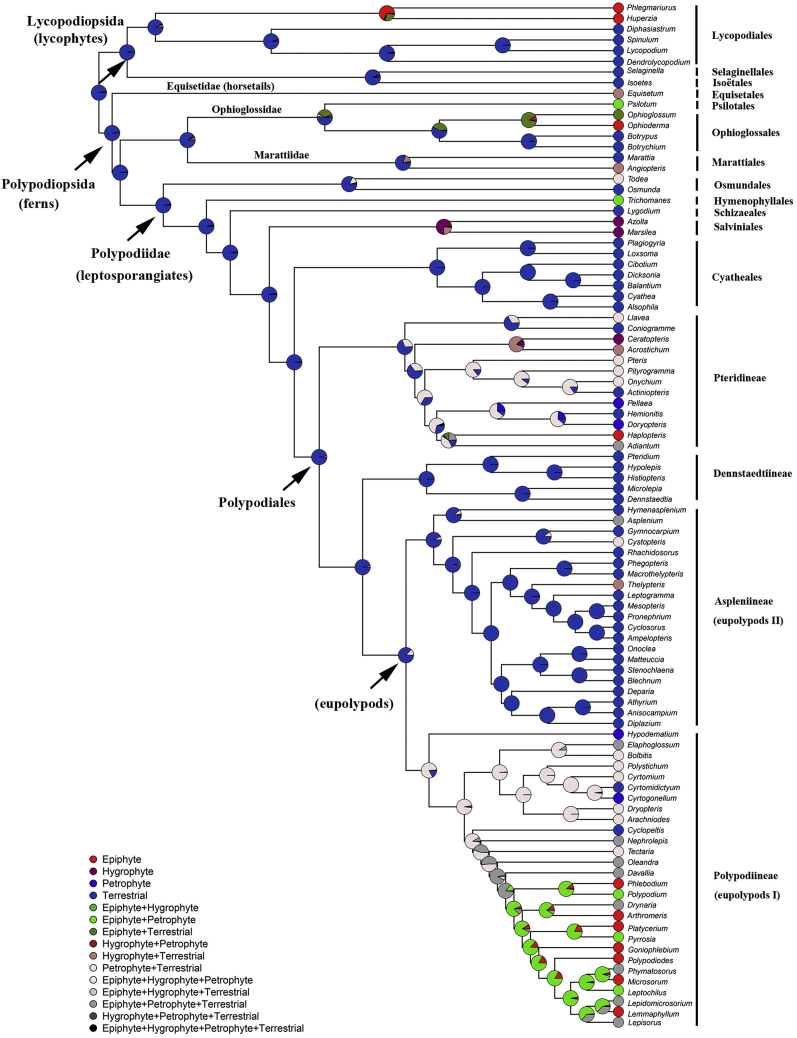
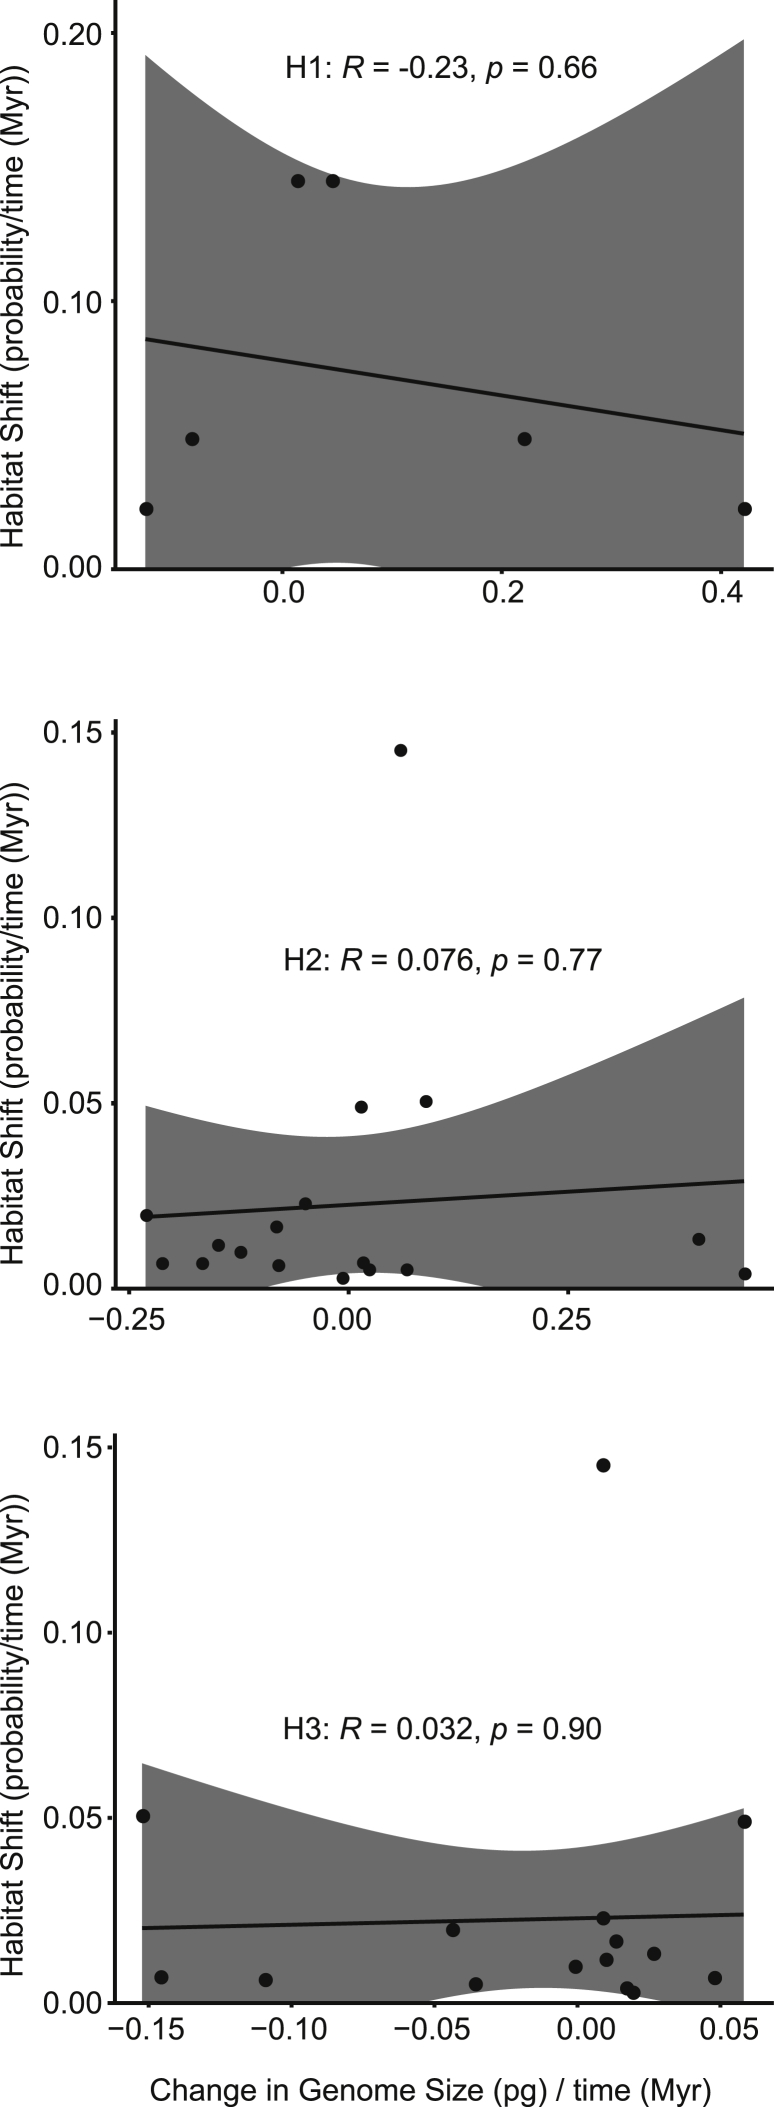
Ferns and lycophytes have remarkably large genomes. However, little is known about how their genome size evolved in fern lineages. To explore the origins and evolution of chromosome numbers and genome size in ferns, we used flow cytometry to measure the genomes of 240 species (255 samples) of extant ferns and lycophytes comprising 27 families and 72 genera, of which 228 species (242 samples) represent new reports. We analyzed correlations among genome size, spore size, chromosomal features, phylogeny, and habitat type preference within a phylogenetic framework. We also applied ANOVA and multinomial logistic regression analysis to preference of habitat type and genome size. Using the phylogeny, we conducted ancestral character reconstruction for habitat types and tested whether genome size changes simultaneously with shifts in habitat preference. We found that 2C values had weak phylogenetic signal, whereas the base number of chromosomes (x) had a strong phylogenetic signal. Furthermore, our analyses revealed a positive correlation between genome size and chromosome traits, indicating that the base number of chromosomes (x), chromosome size, and polyploidization may be primary contributors to genome expansion in ferns and lycophytes. Genome sizes in different habitat types varied significantly and were significantly correlated with habitat types; specifically, multinomial logistic regression indicated that species with larger 2C values were more likely to be epiphytes. Terrestrial habitat is inferred to be ancestral for both extant ferns and lycophytes, whereas transitions to other habitat types occurred as the major clades emerged. Shifts in habitat types appear be followed by periods of genomic stability. Based on these results, we inferred that habitat type changes and multiple whole-genome duplications have contributed to the formation of large genomes of ferns and their allies during their evolutionary history.
Keywords: Chromosome numbers; Evolution; Ferns; Genome size; Habitat type; Whole-genome duplications.
© 2022 Kunming Institute of Botany, Chinese Academy of Sciences. Publishing services by Elsevier B.V. on behalf of KeAi Communications Co. Ltd.
Conflict of interest statement
There are no conflicts of interest to declare.
Figures
Similar articles
-
Genome evolution of ferns: evidence for relative stasis of genome size across the fern phylogeny.New Phytol. 2016 May;210(3):1072-82. doi: 10.1111/nph.13833. Epub 2016 Jan 12. New Phytol. 2016. PMID: 26756823
-
Stasis and convergence characterize morphological evolution in eupolypod II ferns.Ann Bot. 2014 Jan;113(1):35-54. doi: 10.1093/aob/mct247. Epub 2013 Nov 5. Ann Bot. 2014. PMID: 24197753 Free PMC article.
-
Evolution of genome space occupation in ferns: linking genome diversity and species richness.Ann Bot. 2023 Feb 7;131(1):59-70. doi: 10.1093/aob/mcab094. Ann Bot. 2023. PMID: 34259813 Free PMC article.
-
Why Do Heterosporous Plants Have So Few Chromosomes?Front Plant Sci. 2022 Feb 16;13:807302. doi: 10.3389/fpls.2022.807302. eCollection 2022. Front Plant Sci. 2022. PMID: 35251082 Free PMC article. Review.
-
Ever since Klekowski: testing a set of radical hypotheses revives the genetics of ferns and lycophytes.Am J Bot. 2014 Dec;101(12):2036-42. doi: 10.3732/ajb.1400317. Epub 2014 Nov 18. Am J Bot. 2014. PMID: 25480700 Review.
Cited by
-
Revisiting ancient polyploidy in leptosporangiate ferns.New Phytol. 2023 Feb;237(4):1405-1417. doi: 10.1111/nph.18607. Epub 2022 Dec 7. New Phytol. 2023. PMID: 36349406 Free PMC article.
-
Identification of ARF transcription factor gene family and its defense responses to bacterial infection and salicylic acid treatment in sugarcane.Front Microbiol. 2023 Sep 7;14:1257355. doi: 10.3389/fmicb.2023.1257355. eCollection 2023. Front Microbiol. 2023. PMID: 37744907 Free PMC article.
-
Uncovering the influence of genomic traits in shaping land plant diversity. A commentary on 'Are chromosome number and genome size associated with habit and environmental niche variables? Insights from the Neotropical orchids'.Ann Bot. 2022 Jul 19;130(1):i-iii. doi: 10.1093/aob/mcac068. Ann Bot. 2022. PMID: 35699527 Free PMC article. No abstract available.
-
Microsatellite Content in 397 Nuclear Exons and Their Flanking Regions in the Fern Family Ophioglossaceae.Plants (Basel). 2024 Mar 4;13(5):713. doi: 10.3390/plants13050713. Plants (Basel). 2024. PMID: 38475562 Free PMC article.
-
Comparative transcriptomics in ferns reveals key innovations and divergent evolution of the secondary cell walls.Nat Plants. 2025 May;11(5):1028-1048. doi: 10.1038/s41477-025-01978-y. Epub 2025 Apr 23. Nat Plants. 2025. PMID: 40269175
References
-
- Baniaga A.E., Barker M.S. Nuclear genome size is positively correlated with median LTR-RT insertion time in fern and lycophyte genomes. Am. Fern J. 2019;109:248–266.
-
- Barker M.S., Wolf P.G. Unfurling fern biology in the genomics age. Bioscience. 2010;60:177–185.
LinkOut - more resources
Full Text Sources
