

Host succinate inhibits influenza virus infection through succinylation and nuclear retention of the viral nucleoprotein
- PMID: 35506364
- PMCID: PMC9194747
- DOI: 10.15252/embj.2021108306
Host succinate inhibits influenza virus infection through succinylation and nuclear retention of the viral nucleoprotein
Abstract
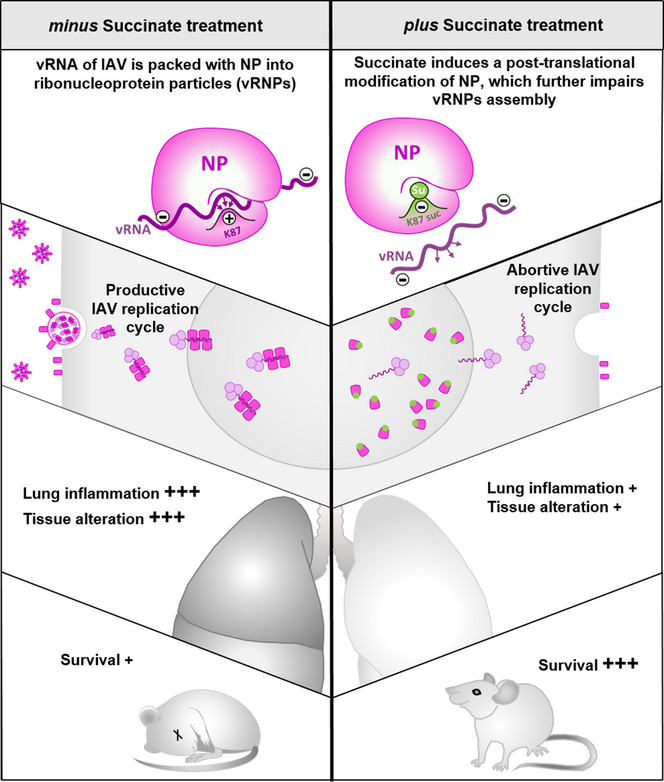
Influenza virus infection causes considerable morbidity and mortality, but current therapies have limited efficacy. We hypothesized that investigating the metabolic signaling during infection may help to design innovative antiviral approaches. Using bronchoalveolar lavages of infected mice, we here demonstrate that influenza virus induces a major reprogramming of lung metabolism. We focused on mitochondria-derived succinate that accumulated both in the respiratory fluids of virus-challenged mice and of patients with influenza pneumonia. Notably, succinate displays a potent antiviral activity in vitro as it inhibits the multiplication of influenza A/H1N1 and A/H3N2 strains and strongly decreases virus-triggered metabolic perturbations and inflammatory responses. Moreover, mice receiving succinate intranasally showed reduced viral loads in lungs and increased survival compared to control animals. The antiviral mechanism involves a succinate-dependent posttranslational modification, that is, succinylation, of the viral nucleoprotein at the highly conserved K87 residue. Succinylation of viral nucleoprotein altered its electrostatic interactions with viral RNA and further impaired the trafficking of viral ribonucleoprotein complexes. The finding that succinate efficiently disrupts the influenza replication cycle opens up new avenues for improved treatment of influenza pneumonia.
Keywords: antiviral; influenza; metabokine; signaling; virus.
© 2022 The Authors. Published under the terms of the CC BY NC ND 4.0 license.
Figures
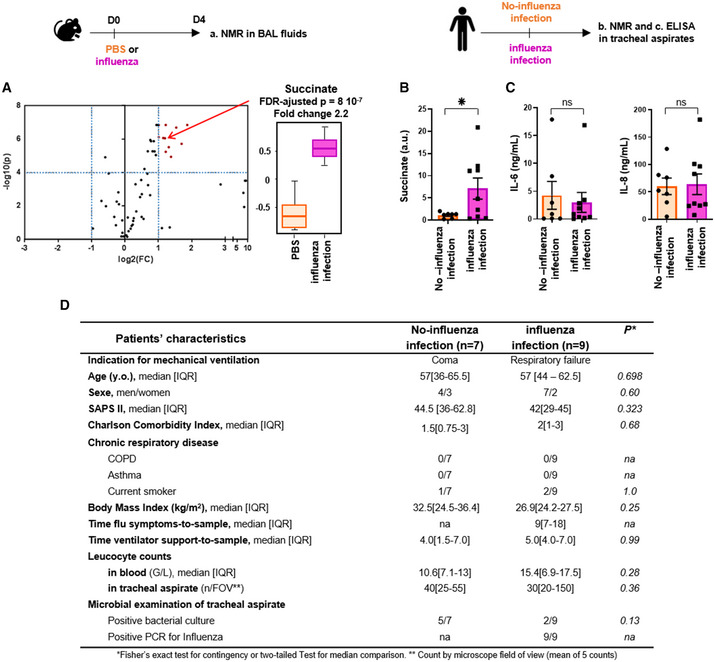
C57Bl/6 mice were infected (n = 9) or not (n = 8) intranasally with 150 pfu of influenza A virus (IAV; A/Scotland/20/74 (H3N2)). Bronchoalveolar lavage fluids (BALs) were collected 4 days postinfection. Samples were further processed for metabolomic analysis by NMR. Left panel shows a volcano‐plot representing the comparison of “IAV‐infected” versus “control, non‐infected” animals. The graph plots the −log (P‐value) against the fold change (log2 (ratio)) for individual metabolites. Vertical dashed blue lines mark the two‐fold change and horizontal dashed blue line marks the cut‐off P‐value of 0.0001. Metabolites in the upper right square in red are significantly more abundant in “IAV‐infected” compared to “control, non‐infected” samples. Succinate (annotated by a red arrow) is one of these compounds with a FC = 2.2 and a FDR‐adjusted P‐value = 8 × 10⁻⁷. The boxplots whiskers correspond to the minimum and maximum values, while the central band is the mean. The first and third quartiles (boxes) are merely the average values between the median and the extrema.
Shows succinate quantification by NMR from tracheal aspirates collected in mechanically ventilated patients with (pink bar, n = 9) or without (orange bar, n = 7) diagnostic of IAV pneumonia. *P < 0.05.
IL‐6 and IL‐8 measurements by ELISA from these same tracheal aspirates.
Main baseline characteristics of the patients included in the study.
- A
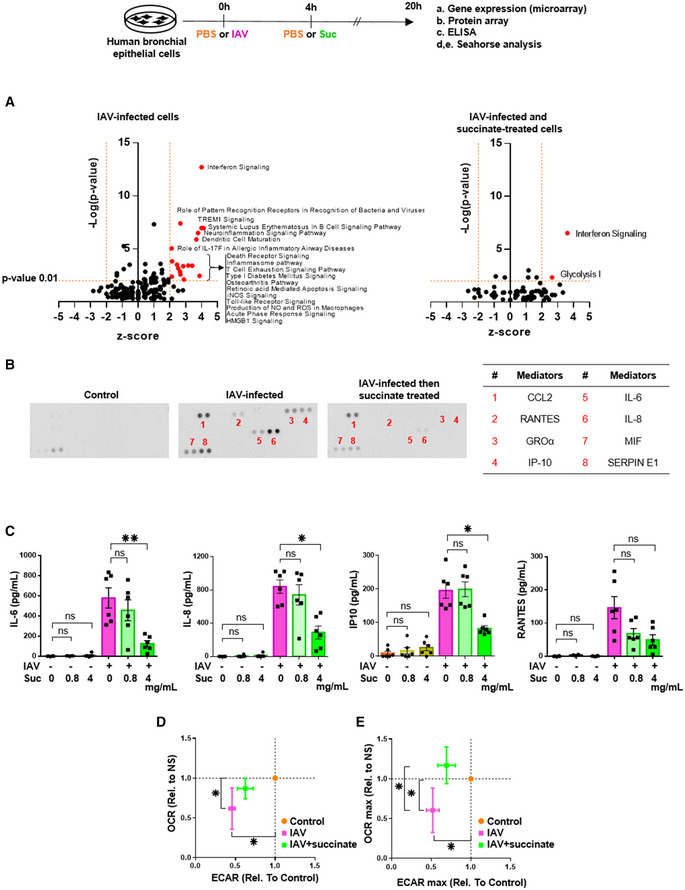
Volcano‐plot showing the most significantly regulated canonical pathways determined by microarray analysis compared with mock‐treated cells. Each dot represents a specific canonical pathway as determined by GSEA. Pathway representations result from the magnitude of regulation (z‐score, x‐axis) and significance (−log10 adjusted P‐value, y‐axis). The dashed horizontal line indicates the statistical significance threshold (P ≤ 0.01 after adjustment with the Bonferroni correction). The two vertical dashed lines show the z‐score threshold (−2: repressed; 2: induced). Colored spots characterize the most highly regulated canonical pathways endowed with statistical significance.
- B
Representative inflammatory protein‐array blots obtained from the supernatants of control‐ or IAV‐infected‐ or IAV‐infected and succinate‐treated cells. The table on the right side indicates the 8 most regulated mediators by succinate.
- C
Quantification by ELISA of IL‐6, IL‐8, IP‐10, and RANTES in the supernatants of cells infected or not by IAV and treated or not with succinate.
- D, E
Panels show the basal replotted ECAR and OCR (D), and glycolytic capacity (ECAR max) and maximal respiration (OCR max) (E) in cells infected with IAV and treated (green symbols) or not (pink symbols) with succinate. Data were normalized with respect to mock‐infected, untreated cells (orange symbols), and were also normalized for DNA content.
- A
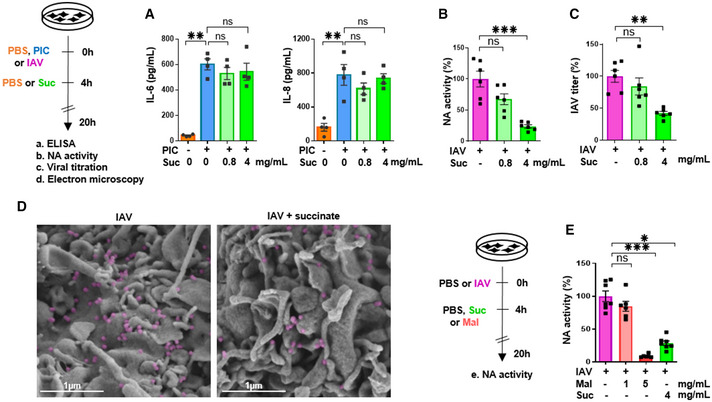
Levels of IL‐6 and IL‐8/CXCL8, as measured by ELISA in the supernatants of cells stimulated with (PIC) and subsequently treated or not with succinate.
- B–E
A neuraminidase (NA) activity test (B), a Plaque‐Forming Units assay (C) and scanning electron microscopy (D) were used to assess the production of physical (B, D) and infectious (C) viral particles in the supernatants of IAV‐infected cells, treated or not with succinate. IAV particles budding are colored in purple. Scale bar: 1 µm. (E) A neuraminidase activity test was also applied in cells infected or not by IAV and treated or not with malonate (a succinate dehydrogenase inhibitor), in comparison with succinate.
- A, B
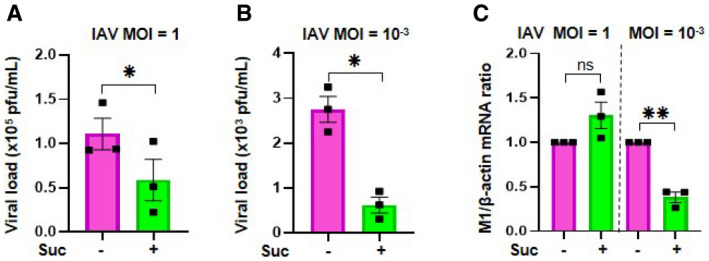
Plaque‐Forming Unit assays determined the production of infectious viral particles in cell supernatants.
- C
The effect of succinate on IAV transcription was assessed by RT‐qPCR to quantify M1 viral mRNA. Data information: Data are represented as the mean ± SEM of 3 independent experiments. Statistical analysis was performed using paired t‐test (A, B) or one sample t‐test (C), (*P < 0.05 and **P < 0.01).
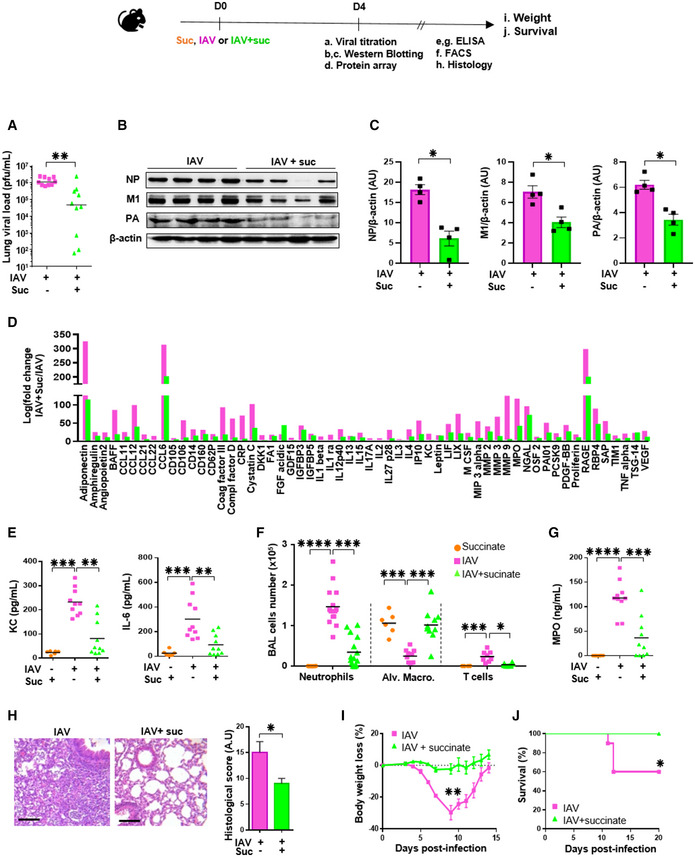
- A–H
Some mice were euthanized at 4 days postinfection and lungs as well as BAL fluids were collected to determine: (A) the viral load by a plaque forming unit assay; (B) the viral protein expression by Western blotting followed by a relative quantification (C), (D) the levels of 111 additional mediators using a specific protein array; (E, G) the levels of KC, IL‐6 and MPO by ELISA; (F) the number of immune and inflammatory cells by flow cytometry; (H) tissue lesions in lung sections stained with hematoxylin‐eosin and further assessed by microscopy. Scale bar: x6/20 µm. All data are represented as the mean or the mean ± SEM and are cumulative of 2 independent experiments with 5 animals each.
- I, J
In separate experiments, body weight loss (n = 8) (I) and animal survival (n = 10) (J) were monitored daily. Data are represented as the mean ± SEM.
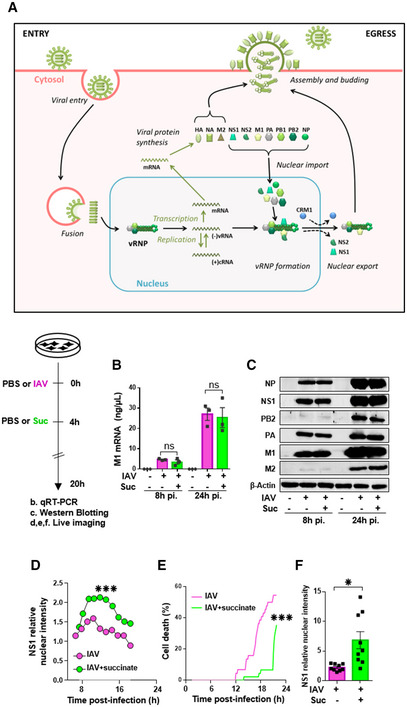
- A
Schematic representation of the IAV replication cycle. After endocytosis, the viral ribonucleoprotein (vRNP) complexes are transported into the nucleus. Viral RNAs (vRNAs) serve as templates for the synthesis of messenger RNAs (mRNAs) and complementary RNAs (cRNAs) are used for the replication of vRNAs. mRNAs are exported in the cytoplasm for translation. Some proteins are transported back to the nucleus to form new vRNPs with neosynthesized vRNAs. Newly synthesized vRNPs are exported in the cytoplasm via the CRM1 protein. HA, NA, M2 proteins and the vRNPs are transported to the plasma membrane for assembly and budding of the progeny virions.
- B–F
Human bronchial epithelial BEAS‐2B cells were infected with A/Scotland/20/74 (H3N2) virus (IAV) at MOI = 1. After 4 h, cells were treated or not with succinate (Suc; 4 mg/ml) up to 20 h. The effect of succinate on IAV transcription (B) and protein expression (C) were assessed by RT‐qPCR to quantify the M1 viral mRNA and Western blotting to detect viral proteins (β‐actin was used as a loading control), respectively. (D–F) Human alveolar epithelial A549 cells were infected with the recombinant influenza A/WSN/33 virus expressing a fusion NS1‐eGFP protein at MOI = 0.5 for 4 h, then treated with 4 mg/ml of succinate. A549 cells were monitored for 24 h using a BioStation IM‐Q device. (D) Single‐cell dynamics of the nuclear/cytoplasmic fluorescence ratio. (E) Single‐cell dynamics of cell death as assessed by morphological analysis. (F) Quantification of the nuclear/cytoplasmic fluorescence ratio measured at 13 h postsuccinate treatment. Data are represented as the mean ± SEM of 3 biological replicates (B, C) or 3 independent experiments with 3 technical replicates each (D–F). Statistical analysis was performed using the Mann–Whitney test (B–E) or t‐test (F), (*P < 0.05 and ***P < 0.001).
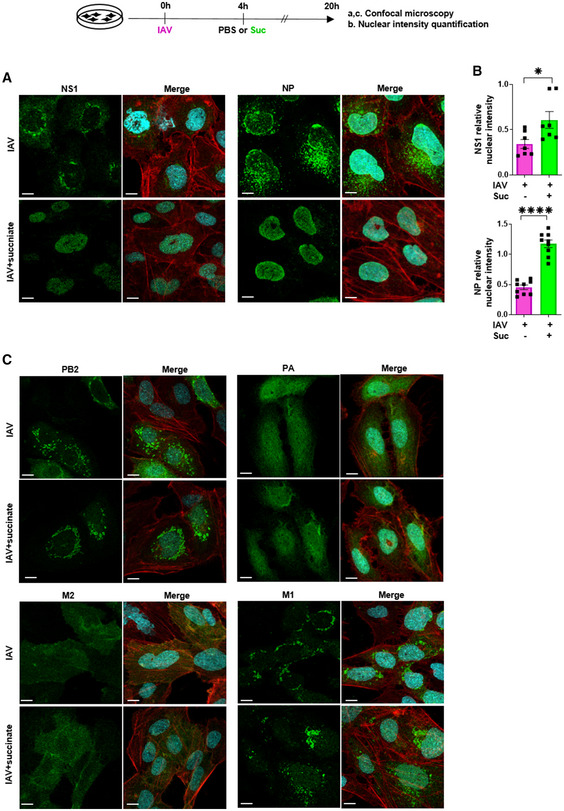
- A–C
Human bronchial epithelial BEAS‐2B cells were infected with influenza A/Scotland/20/74 (H3N2) virus (IAV) at MOI = 1 for 4 h, then washed and treated or not with succinate (Suc; 4 mg/ml) for 20 h. (A, C) Expression of IAV proteins (i.e., PA, PB2, M2, M1, NP, NS1) was analyzed by confocal microscopy using specific antibodies. Viral proteins are stained in green, DNA in blue and actin in red. For a given antibody, pictures were taken on the exact same day with the same laser power settings, Pictures are representative of five independent experiments. Scale bar 10 µM. (B) Relative nuclear intensity of NS1 or NP was determined by using the Intensity Ratio Nuclei Cytoplasm Tool. Seven (NS1) or nine (NP) random images were collected per treatment with at least 5 cells per field. Data are represented as the mean ± SEM. Statistical analysis was performed using the Mann–Whitney test, (*P < 0.05 and ****P < 0.0001).
- A–C
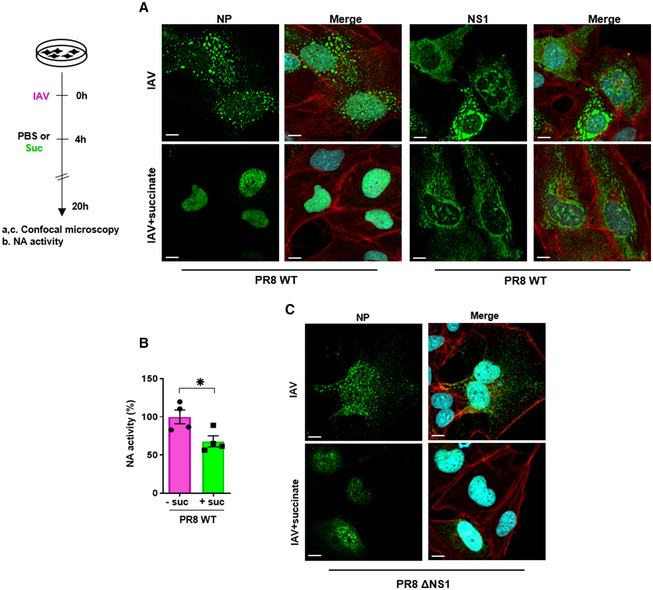
Human bronchial epithelial BEAS‐2B cells were infected for 4 h with influenza A/PR/8/34 (H1N1) virus, either wild‐type (PR8 WT; at MOI = 10 (A, B)) or carrying a deletion of the NS1 coding sequence (PR8ΔNS1; at MOI = 4 (C)), and subsequently treated or not for 20 h with 4 mg/ml of succinate (Suc). Expression of NP (A, C) and NS1 (A) proteins was analyzed by confocal immunofluorescence microscopy. Viral proteins are stained in green, DNA in blue and actin in red. For a given antibody, pictures were taken on the exact same day with the same laser power settings. They are representative of three independent experiments; scale bar 10 µM. (B) Neuraminidase (NA) activity in the supernatants of epithelial cells infected by PR8 WT treated or not with succinate. Data are represented as the mean ± SEM of 4 independent experiments. Statistical analysis was performed using the Student’s t‐test, (*P < 0.05).
- A, B
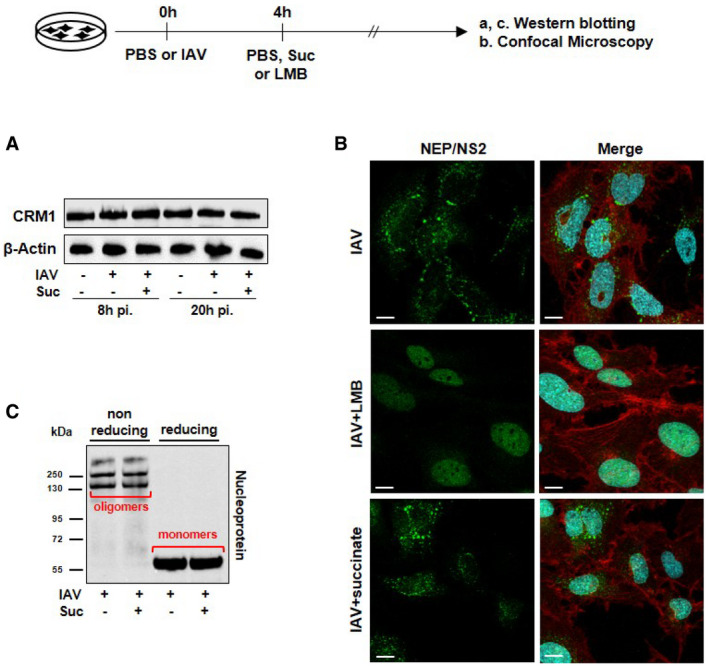
Human bronchial epithelial BEAS‐2B cells were infected or not with the A/Scotland/20/74 (H3N2) virus (IAV) at MOI = 1 for 4 h, and subsequently treated or not with 4 mg/ml of succinate for 20 h (A) or with 10 mM of the CRM1 inhibitor leptomycin B (LMB; middle panels in B). The expression of CRM1 was analyzed by Western blotting (A). Expression of the viral protein NEP/NS2 was analyzed by confocal fluorescence microscopy (B). NEP/NS2 is stained in green, nuclear DNA in blue and actin cytoskeleton in red. Scale bar: 10 µM.
- C
The formation of NP oligomers and monomers was assessed by Western blotting under nonreducing and reducing conditions.
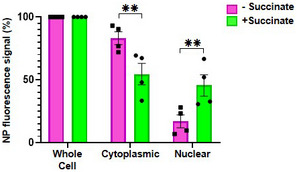
- A, B
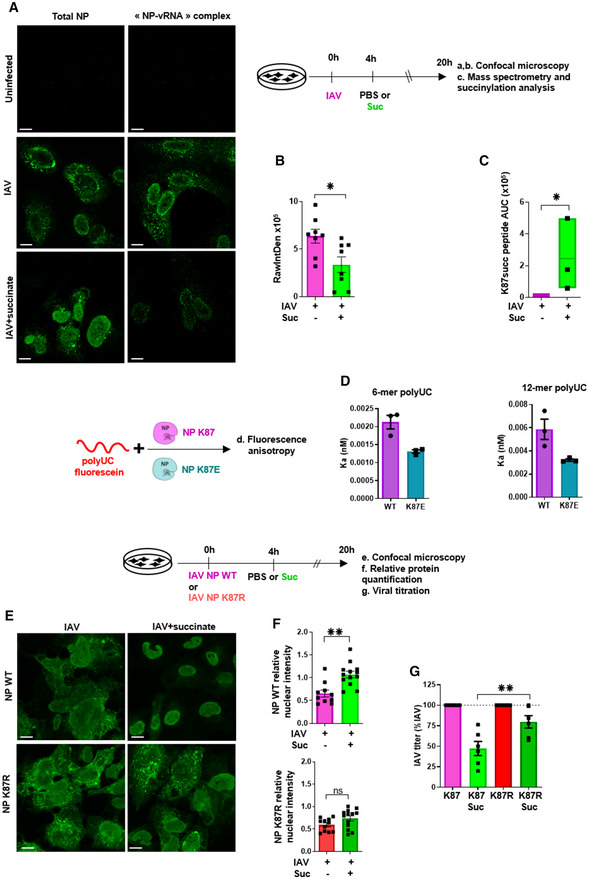
Cells were stained using a monoclonal antibody that specifically recognizes “NP‐vRNA” complexes, but not RNA‐free NP, and confocal microscopy (A) was performed (green staining). The value raw integrated density (RawIntDen, which is the sum of all pixel values in the ROI (region of interest)) was further measured (B).
- C
Cells were lysed and proteins were digested to peptides with Lys‐C and trypsin. Then, succinylated peptides were isolated directly from protease‐digested protein extracts by immunoaffinity purification (IAP) using an antibody specific for the succinyl‐Lysine motif. Next, the modified peptides were further analyzed by LC‐MS/MS. Box plots show the distribution of intensities of the succinylated NP “YLEEHPSAGK87succDPK” peptide, computed as the integrated mass spectrometry peak area of the modified K87 succinyl peptide (n = 3). The boxplots whiskers correspond to the minimum and maximum values, while the central band is the median. The first and third quartiles (boxes) are merely the average values between the median and the extrema.
- D
Interaction of recombinant of wild‐type NP (NP K87) or a K87E mutant protein (NP K87E) with the indicated synthetic polyUC RNAs as measured by fluorescence anisotropy.
- E
Human bronchial epithelial BEAS‐2B cells were infected with a A/Scotland/20/74 (H3N2) virus (IAV) carrying a wild‐type NP (NP WT) or with the corresponding mutated virus bearing a NP with a K87R substitution (NP K87R). Cells were infected by either virus at MOI = 1 for 4 h, then washed and treated or not with 4 mg/ml of succinate for 20 h. Localization of NP proteins was analyzed by confocal immunofluorescence microscopy. Scale bar: 10 µM. Pictures are representative of three independent experiments.
- F
Relative nuclear intensity of NP was determined by using the Intensity Ratio Nuclei Cytoplasm Tool.
- G
Plaque‐Forming Unit assays determined the production of infectious viral particles in cell supernatants.
References
-
- Bahadoran A, Bezavada L, Smallwood HS (2020) Fueling influenza and the immune response: Implications for metabolic reprogramming during influenza infection and immunometabolism. Immunol Rev 295: 140–166 - PubMed
-
- Blanc F, Furio L, Moisy D, Yen H‐L, Chignard M, Letavernier E, Naffakh N, Mok CKP, Si‐Tahar M (2016) Targeting host calpain proteases decreases influenza A virus infection. Am J Physiol Lung Cell Mol Physiol 310: L689–L699 - PubMed
-
- Chandler JD, Hu X, Ko E‐J, Park S, Lee Y‐T, Orr M, Fernandes J, Uppal K, Kang S‐M, Jones DP et al (2016) Metabolic pathways of lung inflammation revealed by high‐resolution metabolomics (HRM) of H1N1 influenza virus infection in mice. Am J Physiol Regul Integr Comp Physiol 311: R906–R916 - PMC - PubMed
Publication types
MeSH terms
Substances
LinkOut - more resources
Full Text Sources
Other Literature Sources
Medical
