. 2022 Jul;79(7):1423-1434.
doi: 10.1161/HYPERTENSIONAHA.122.19159. Epub 2022 May 4.

Mineralocorticoid Receptor Antagonists Cause Natriuresis in the Absence of Aldosterone

Affiliations

Mineralocorticoid Receptor Antagonists Cause Natriuresis in the Absence of Aldosterone

Yujiro Maeoka et al. Hypertension. 2022 Jul.

Abstract

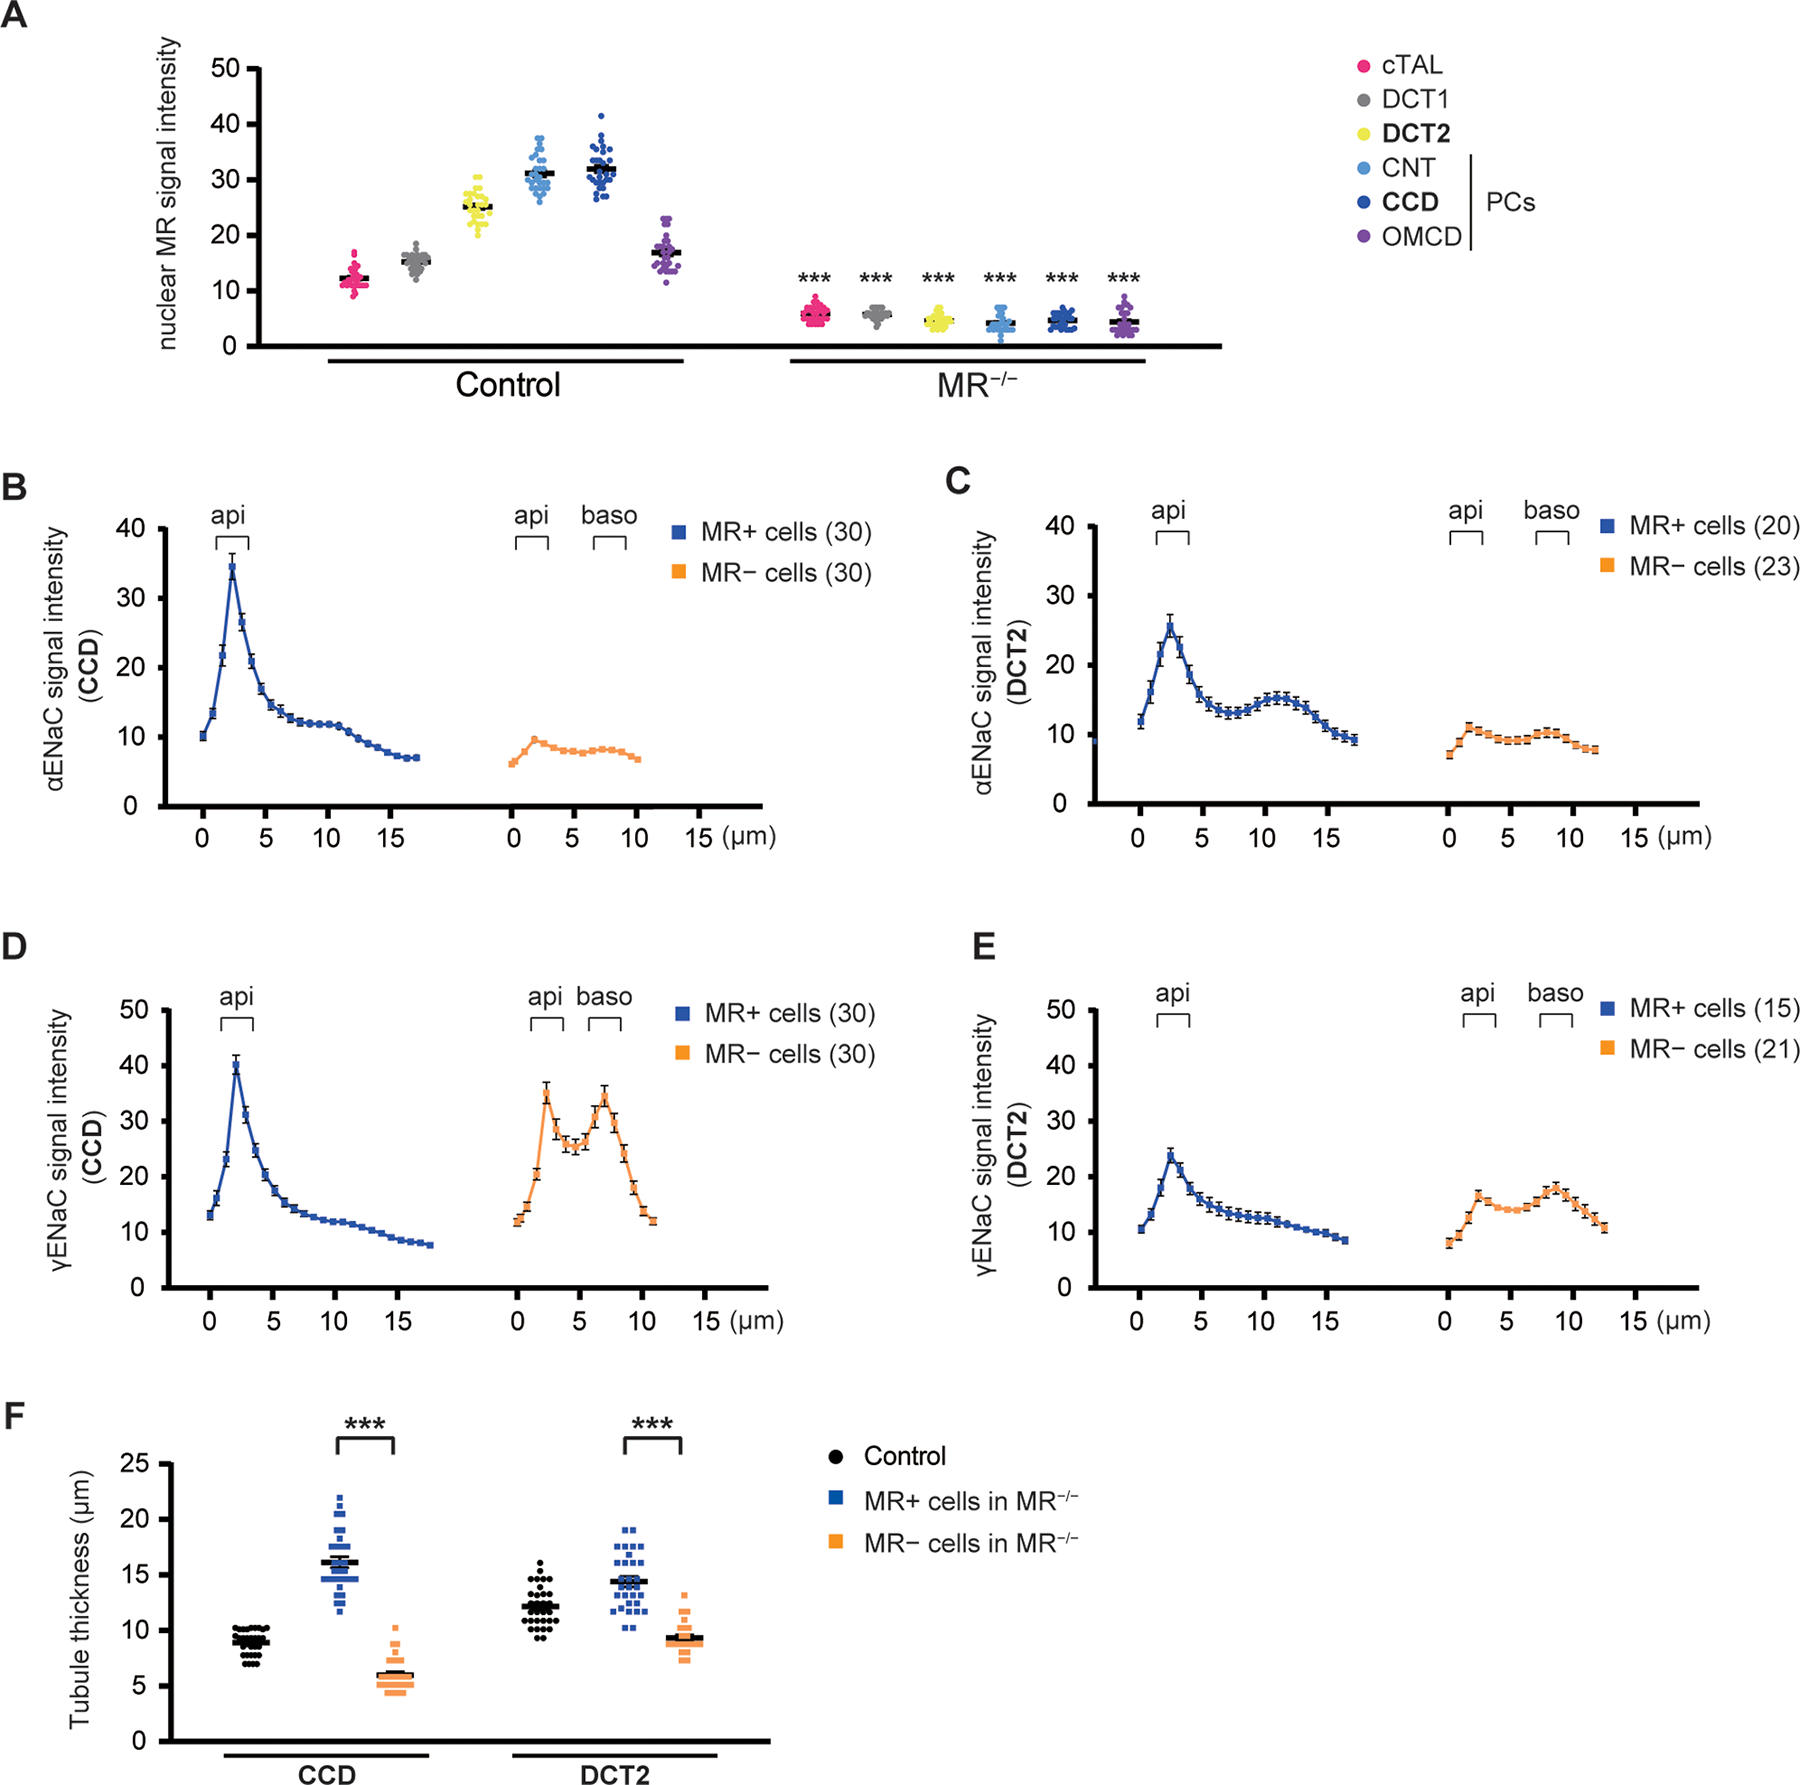
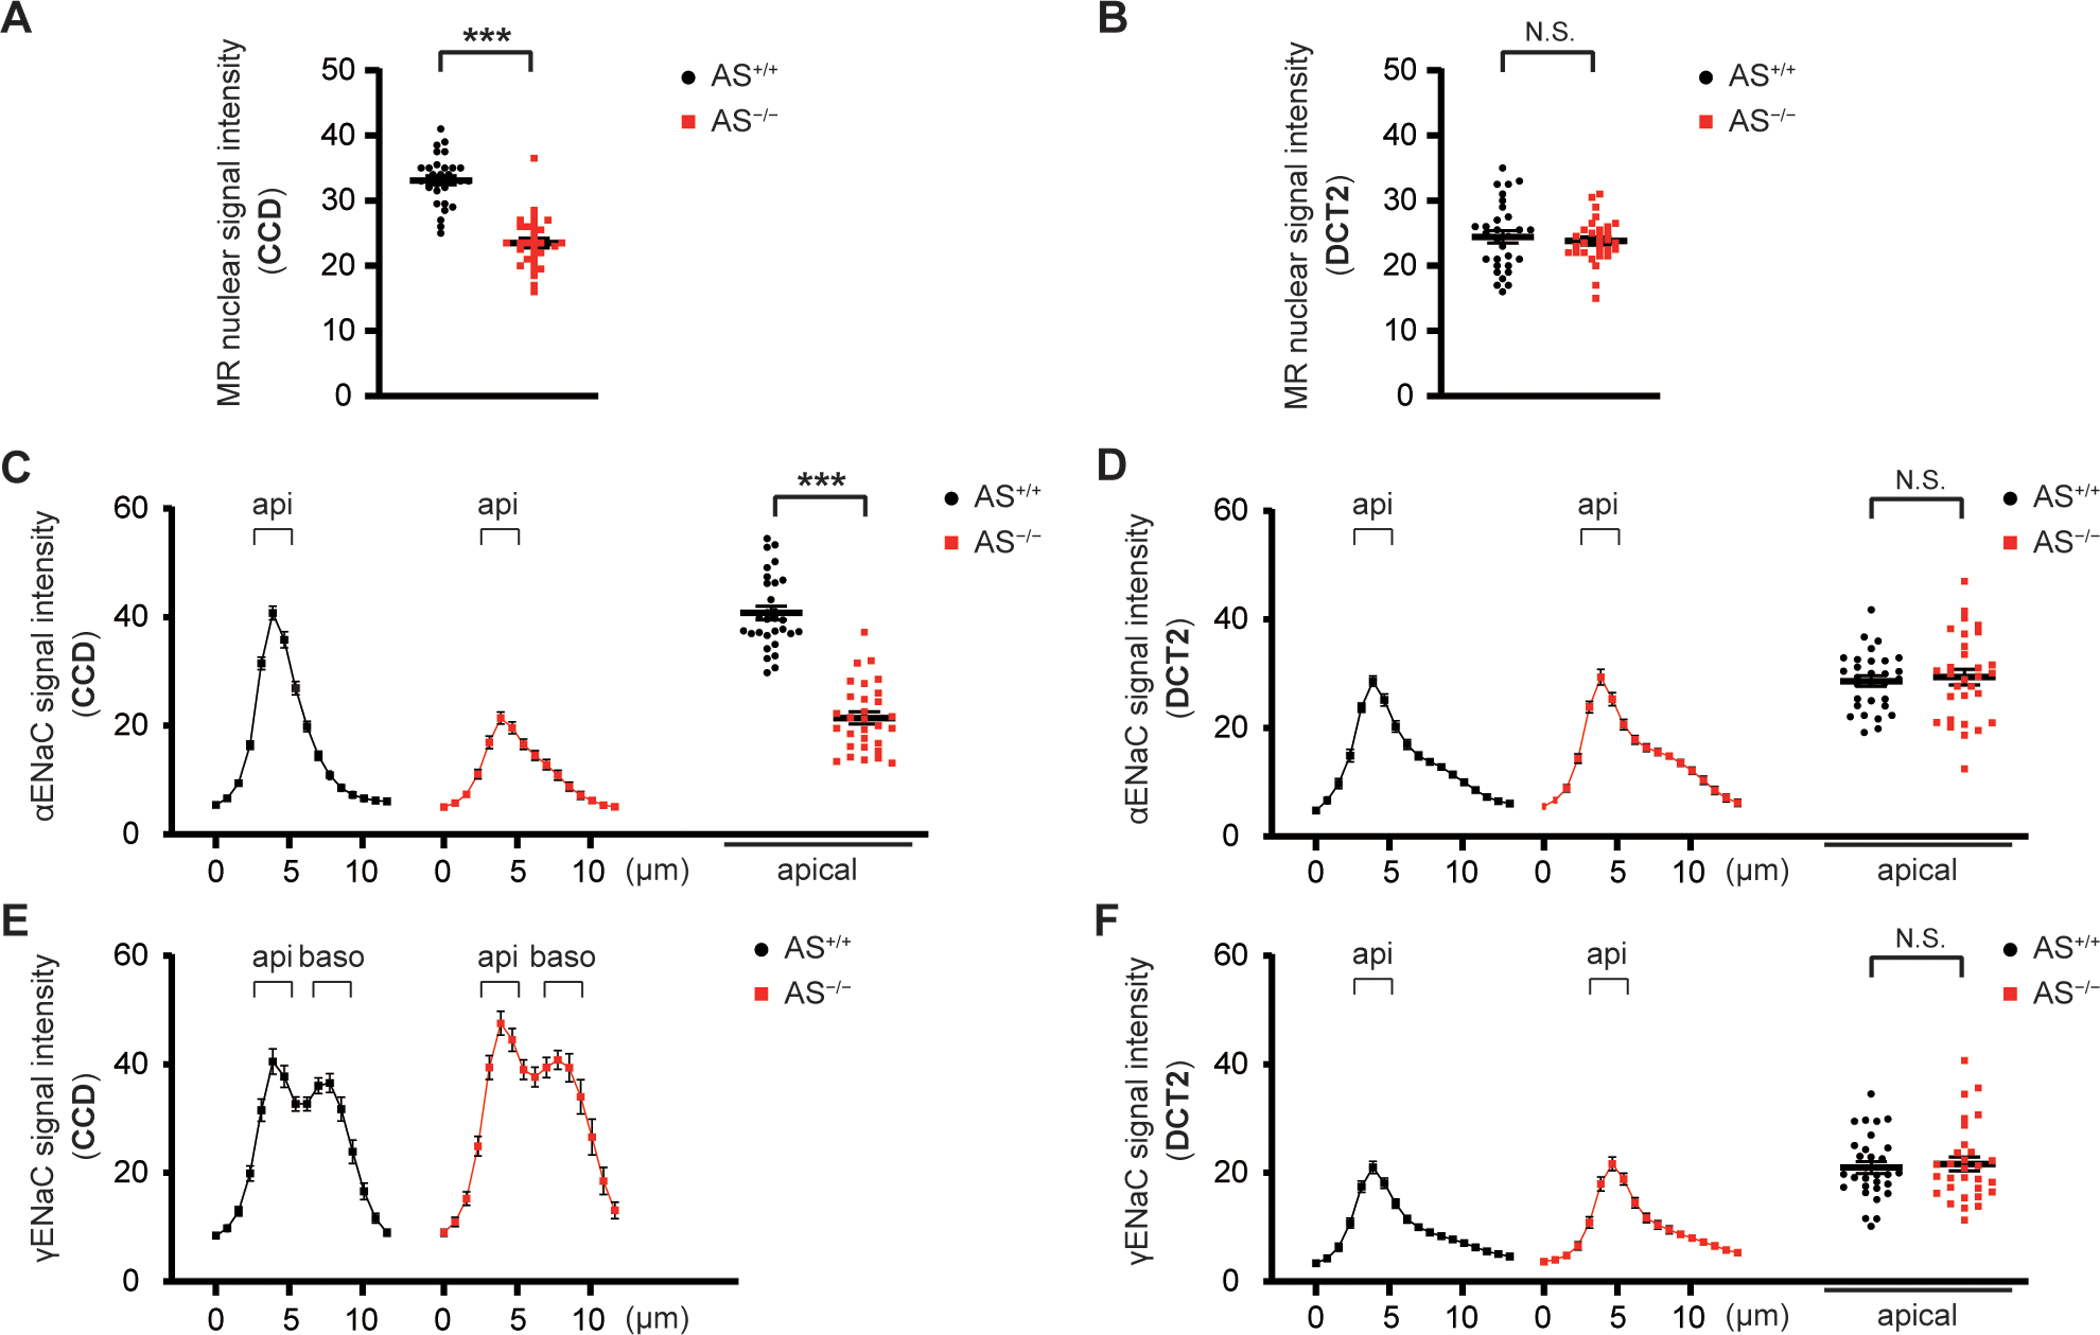
Background: MR (mineralocorticoid receptor) antagonists are recommended for patients with resistant hypertension even when circulating aldosterone levels are not high. Although aldosterone activates MR to increase epithelial sodium channel (ENaC) activity, glucocorticoids also activate MR but are metabolized by 11βHSD2 (11β-hydroxysteroid dehydrogenase type 2). 11βHSD2 is expressed at increasing levels from distal convoluted tubule (DCT) through collecting duct. Here, we hypothesized that MR maintains ENaC activity in the DCT2 and early connecting tubule in the absence of aldosterone.

Methods: We studied AS (aldosterone synthase)-deficient (AS-/-) mice, which were backcrossed onto the same C57BL6/J strain as kidney-specific MR knockout (KS-MR-/-) mice. KS-MR-/- mice were used to compare MR expression and ENaC localization and cleavage with AS-/- mice.

Results: MR was highly expressed along DCT2 through the cortical collecting duct (CCD), whereas no 11βHSD2 expression was observed along DCT2. MR signal and apical ENaC localization were clearly reduced along both DCT2 and CCD in KS-MR-/- mice but were fully preserved along DCT2 and were partially reduced along CCD in AS-/- mice. Apical ENaC localization and ENaC currents were fully preserved along DCT2 in AS-/- mice and were not increased along CCD after low salt. AS-/- mice exhibited transient Na+ wasting under low-salt diet, but administration of the MR antagonist eplerenone to AS-/- mice led to hyperkalemia and decreased body weight with higher Na+ excretion, mimicking the phenotype of MR-/- mice.

Conclusions: Our results provide evidence that MR is activated in the absence of aldosterone along DCT2 and partially CCD, suggesting glucocorticoid binding to MR preserves sodium homeostasis along DCT2 in AS-/- mice.

Keywords: aldosterone; cortisol; hypertension; ion channels, sodium; mice.


Conflict of interest statement

Disclosures

The authors have no conflicts of interest to declare.

Figures

Figure 1.
Figure 1.. MR regulates apical ENaC localization along DCT2 and CCD.
A, Nuclear MR signal intensity along the distal nephron. Analysis of raw data from Figure S3. MR is highly expressed along DCT2, CNT, and CCD in control mice (left). Nuclear MR signal intensities along these segments were nearly absent along the majority of cells in KS-MR−/− mice (right), although a few cells retained nuclear MR (Figure S6). B–E, Quantitative image analysis of α- and γ-ENaC signal intensity in MR-positive cells and MR-negative cells of KS-MR−/− mice (from Figure S7 1B–1E), measured from the lumen to the basolateral side at 0.78 μm-increment resolution. Along CCD and DCT2, MR-positive cells had strong α- and γ-ENaC apical signal (dark blue line), and both α- and γ-ENaC were exclusively cytoplasmic in MR-negative cells with extremely weak α-ENaC signal (orange line). F, Tubule thickness along CCD and DCT2 in control and KS-MR−/− mice. MR-positive cells had increased thickness compared with MR-negative cells in these segments. Data represent individual values and mean ± SEM. Statistical differences were examined by two-tailed unpaired t-tests (A and F). ***, P < 0.001.
Figure 2.
Figure 2.. Nuclear MR expression and apical ENaC localization are regulated along DCT2 and partially CCD in an aldosterone-independent manner.
A and B, Nuclear MR signal intensity in CCD and DCT of AS+/+ and AS−/− mice. Analysis of raw data from Figure S7 2A–2B. MR signal intensity was partially reduced along CCD but was preserved along DCT2 in AS−/− mice. C–F, Quantitative image analysis of α- and γ-ENaC signal intensity in CCD and DCT of AS+/+ and AS−/− mice (from Figure S7 2B–2E), which was measured from the lumen to the basolateral side at 0.78 μm-increment resolution. Differences in apical signal intensity were analyzed only when apical localization could be discriminated (C, D, and F). α-ENaC signal was only partially reduced along CCD and fully preserved along DCT2 in AS−/− mice. Apical γ-ENaC localization was preserved along DCT2 in AS−/− mice, and γ-ENaC was localized to cytoplasmic in both AS+/+ and AS−/− mice. Data represent individual values and mean ± SEM. Statistical differences were examined by two-tailed unpaired t-tests (A–D and F). ***, P < 0.001; N.S., P > 0.05.
Figure 3.
Figure 3.. Dietary salt restriction leads to transient Na+-wasting in AS−/− mice.
AS+/+ and AS−/− mice were acclimated to normal salt diet (NS: 0.49% NaCl and 0.8% K+) then treated with low salt diet (LS: 0.03% Na+ and 0.8% K+) for 5 days. A, Body weight was not significantly changed in AS−/− mice fed LS diet compared with AS+/+ mice. B and C, Na+ excretion was higher on LS Day 1 in AS−/− mice but was similar to AS+/+ mice on LS Day 5. D, K+ balance (K+ intake – urinary K+ excretion) was similar between AS−/− mice and AS+/+ mice. E, Plasma potassium trended higher on NS diet and was significantly higher on LS diet in AS−/− mice compared with AS+/+ mice. F, Plasma sodium levels did not change in AS−/− or AS+/+ mice. Data represent individual values and mean ± SEM. Statistical differences were examined by two-tailed unpaired t-tests (C and D), two-way repeated measures ANOVA (A and B), or two-way ANOVA, followed by post hoc Tukey tests (E and F). **, P < 0.01; ***, P < 0.001; N.S., P > 0.05.
Figure 4.
Figure 4.. Na+ depletion does not stimulate ENaC cleavage and its activity in AS−/− mice.
A–D, Western blot of ENaC when mice were switched from normal salt diet (NS: 0.49% NaCl and 0.8% K+) to low salt diet (LS: 0.03% Na+ and 0.8% K+), and quantification of results in A. Cleaved and total αENaC expression, and the ratio of cleaved to uncleaved γENaC, were all significantly higher in AS+/+ mice fed LS diet compared with NS diet, but not in AS−/− mice. White arrow head indicates non-specific band. E, ENaC currents measured at −60 mV along DCT2 and CCD in AS+/+ and AS−/− mice. Right, ENaC currents were preserved along DCT2 in AS−/− mice, and were not higher along CCD in AS−/− mice after LS diet. Left, ENaC currents were increased along CCD in WT mice fed LS diet. The bar graphs are redrawn from Wu et al. and are included for comparison with the normal response. Data represent individual values and mean ± SEM. Statistical differences were examined by one-way ANOVA (E) or two-way ANOVA, followed by post hoc Tukey tests (B–D). *, P < 0.01; **, P < 0.01; ***, P < 0.001; N.S., P > 0.05.
Figure 5.
Figure 5.. Effect of eplerenone on urine Na+ excretion and Na+/K+ ratio in AS−/− mice fed LS diet.
AS−/− mice assigned to control group (AS−/−, LS) fed LS diet and eplerenone group (AS−/−, LS+Epl) treated with 100 mg/kg/day of eplerenone, as shown in detail in Figure S17A. A and B, Urine Na+ excretion (A) and urine Na+/K+ ratio (B), was significantly increased after eplerenone treatment. C and D, Plasma sodium was decreased and BUN was increased in eplerenone-treated AS−/− mice. E and F, Urine K+ excretion was significantly decreased and plasma potassium was increased after eplerenone treatment. Data represent individual values and mean ± SEM. Statistical differences were examined by two-tailed unpaired t-tests (C, D, and F) or two-way repeated measures ANOVA (A, B, and E). *, P < 0.05; **, P < 0.01; ***, P < 0.001; NS, P > 0.05.
Figure 6.
Figure 6.. Aldosterone-independent MR activation regulates ENaC activity along DCT2 and partially CCD, contributing to sodium reabsorption.
MR is highly expressed along both DCT2 and CCD, but 11βHSD2 is not expressed along DCT2. Left, In a state of aldosterone (Aldo) excess, α- and γ-ENaC is localized to apical along DCT2 and CCD. Right, In KS-MR−/− mice, apical α- and γ-ENaC localization are severely reduced along both DCT2 and CCD. Middle, In AS−/− mice, nuclear MR expression and apical ENaC localization is preserved along DCT2 and is not fully reduced along CCD highly expressing 11βHSD2. This aldosterone-independent MR signaling along DCT2 and CCD, possibly regulated by corticosterone or cortisone (Cort), can explain mild their phenotype, and prevents from continuous salt wasting under LS diet.

References

    1. Rossier BC, Baker ME, Studer RA. Epithelial sodium transport and its control by aldosterone: the story of our internal environment revisited. Physiol Rev. 2015;95:297–340. doi: 10.1152/physrev.00011.2014 - DOI - PubMed
    1. Williams B, MacDonald TM, Morant S, Webb DJ, Sever P, McInnes G, Ford I, Cruickshank JK, Caulfield MJ, Salsbury J, et al. Spironolactone versus placebo, bisoprolol, and doxazosin to determine the optimal treatment for drug-resistant hypertension (PATHWAY-2): a randomised, double-blind, crossover trial. Lancet. 2015;386:2059–2068. doi: 10.1016/S0140-6736(15)00257-3 - DOI - PMC - PubMed
    1. Williams B, MacDonald TM, Morant SV, Webb DJ, Sever P, McInnes GT, Ford I, Cruickshank JK, Caulfield MJ, Padmanabhan S, et al. Endocrine and haemodynamic changes in resistant hypertension, and blood pressure responses to spironolactone or amiloride: the PATHWAY-2 mechanisms substudies. Lancet Diabetes Endocrinol. 2018;6:464–475. doi: 10.1016/S2213-8587(18)30071-8 - DOI - PMC - PubMed
    1. Williams B, MacDonald TM, Morant SV, Brown MJ. PATHWAY-2: spironolactone for resistant hypertension - Authors’ reply. Lancet. 2016;387:1373–1374. doi: 10.1016/S0140-6736(16)00698-X - DOI - PubMed
    1. Parthasarathy HK, Alhashmi K, McMahon AD, Struthers AD, McInnes GT, Ford I, Connell JM, MacDonald TM. Does the ratio of serum aldosterone to plasma renin activity predict the efficacy of diuretics in hypertension? Results of RENALDO. J Hypertens. 2010;28:170–177. doi: 10.1097/HJH.0b013e328332b79b - DOI - PubMed

Publication types

MeSH terms