. 2022 May 4:11:e75660.
doi: 10.7554/eLife.75660.

De novo-designed transmembrane domains tune engineered receptor functions

Affiliations

De novo-designed transmembrane domains tune engineered receptor functions

Assaf Elazar et al. Elife. .

Abstract

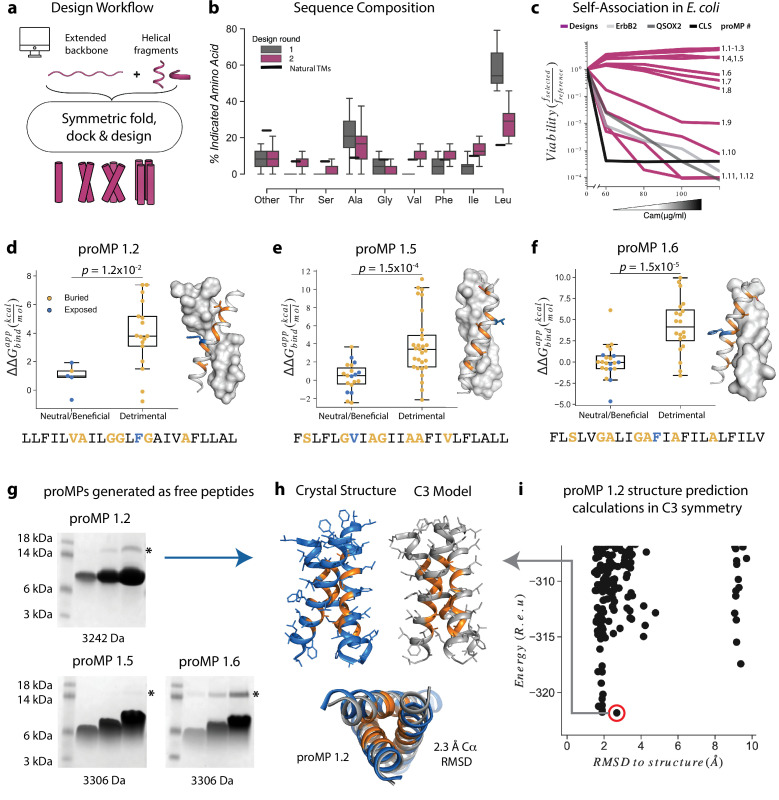
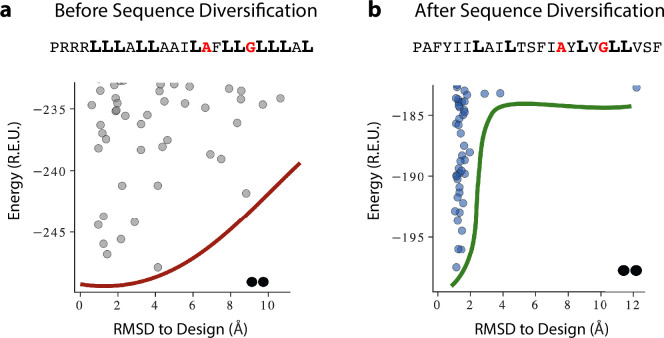
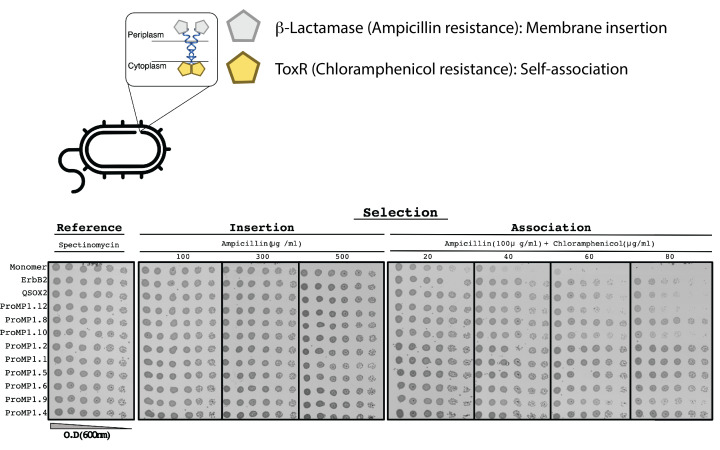
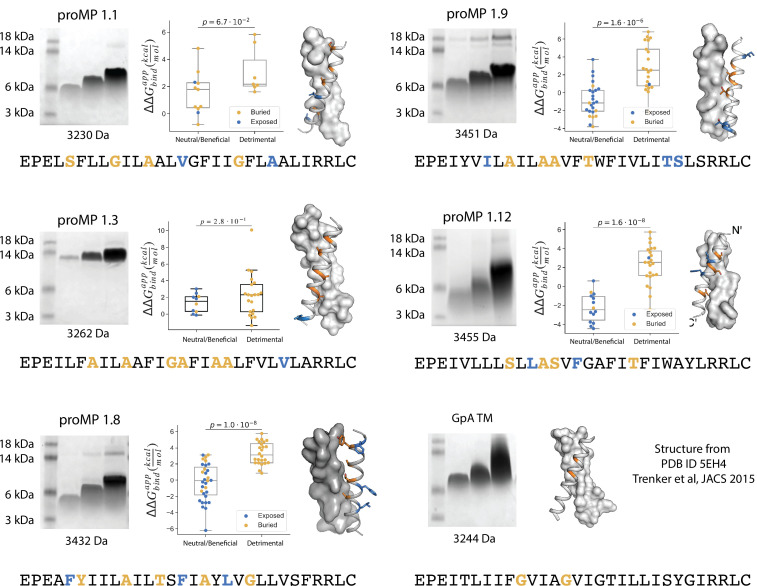
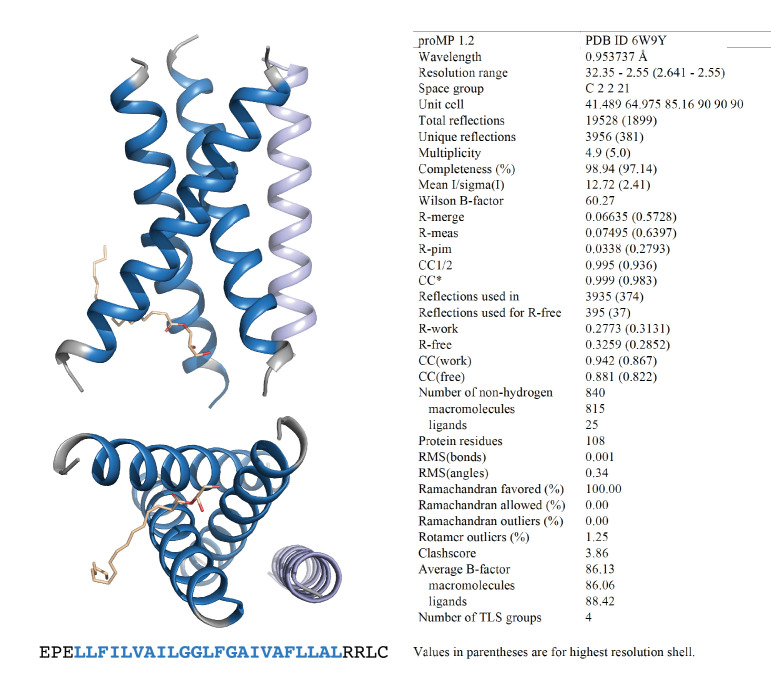
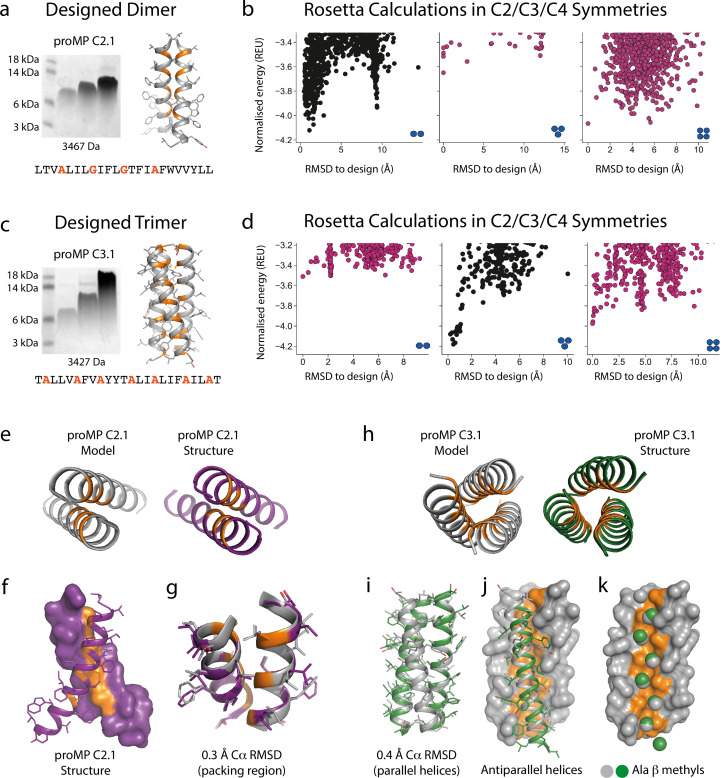
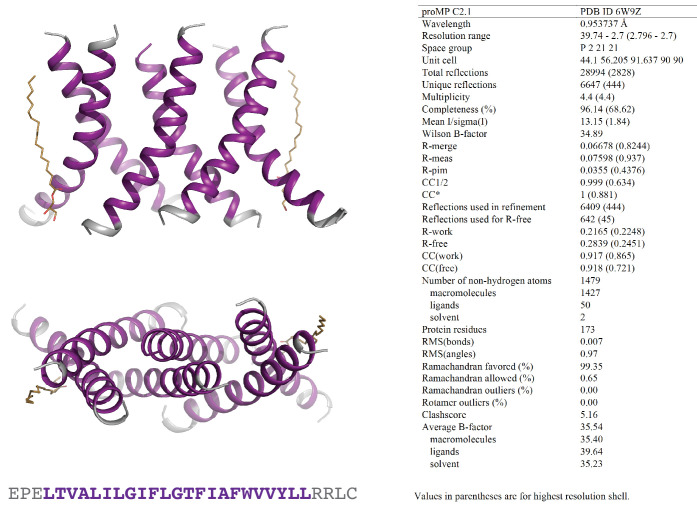
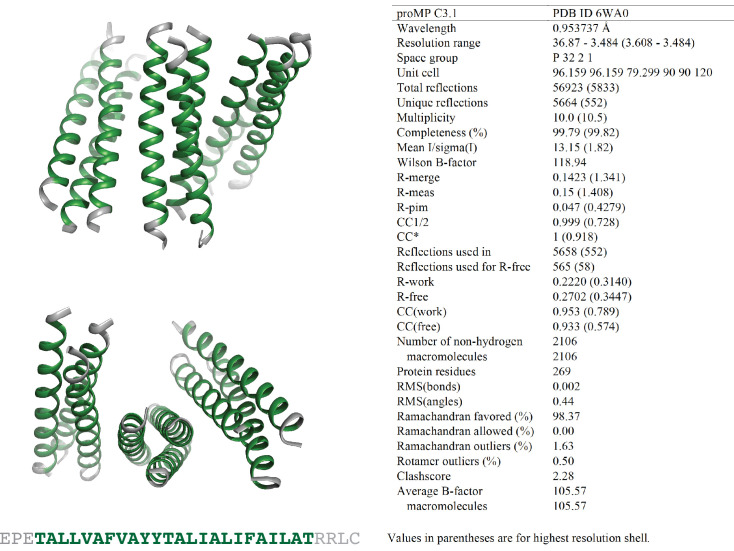
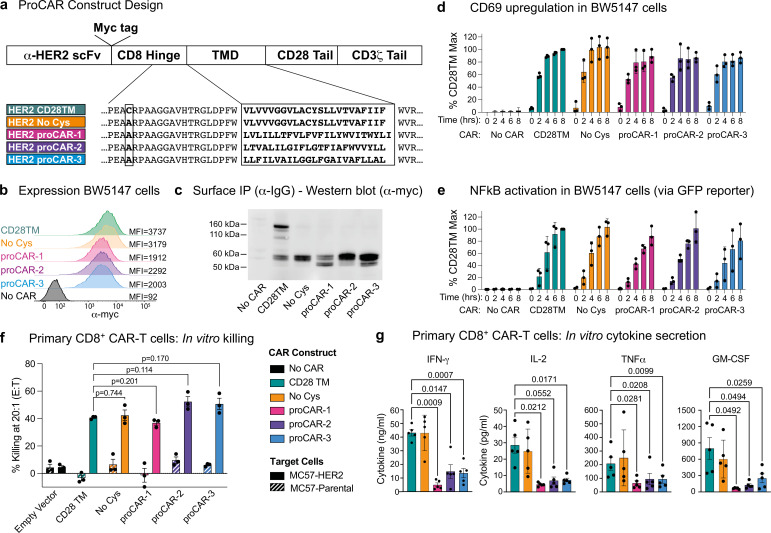
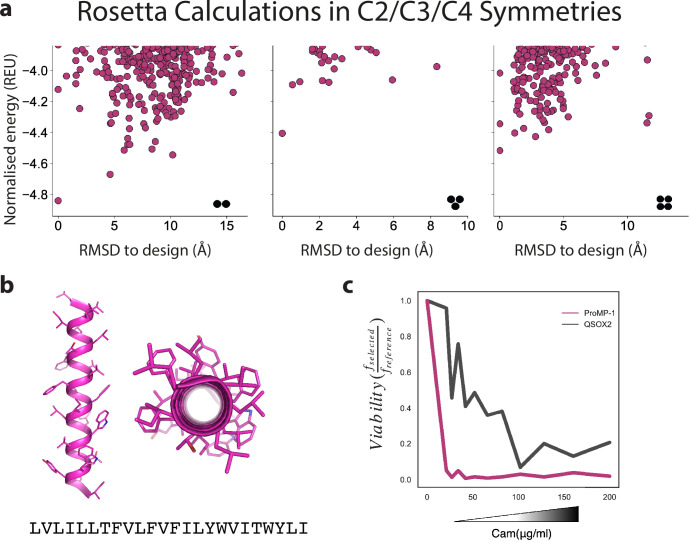
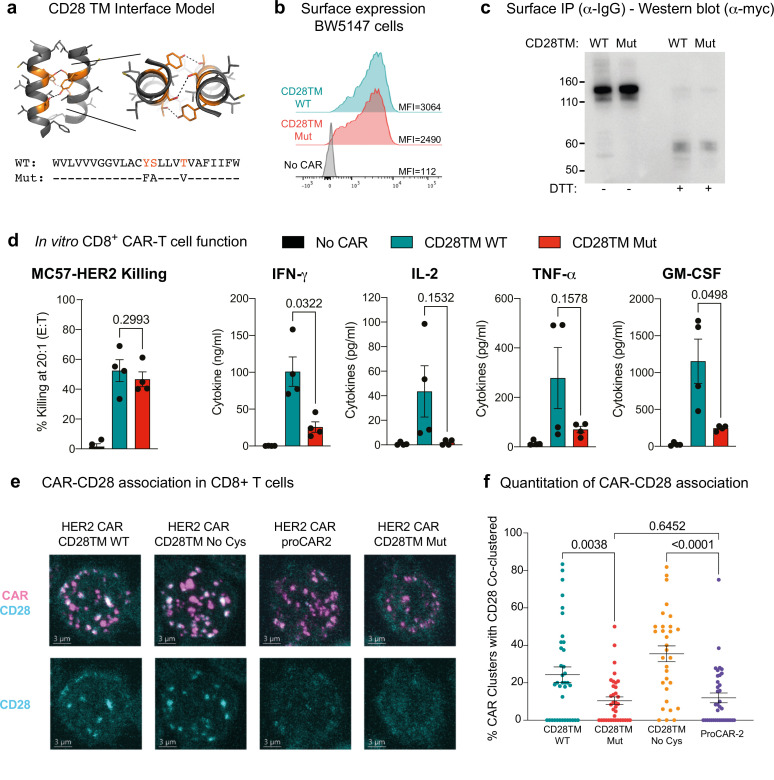
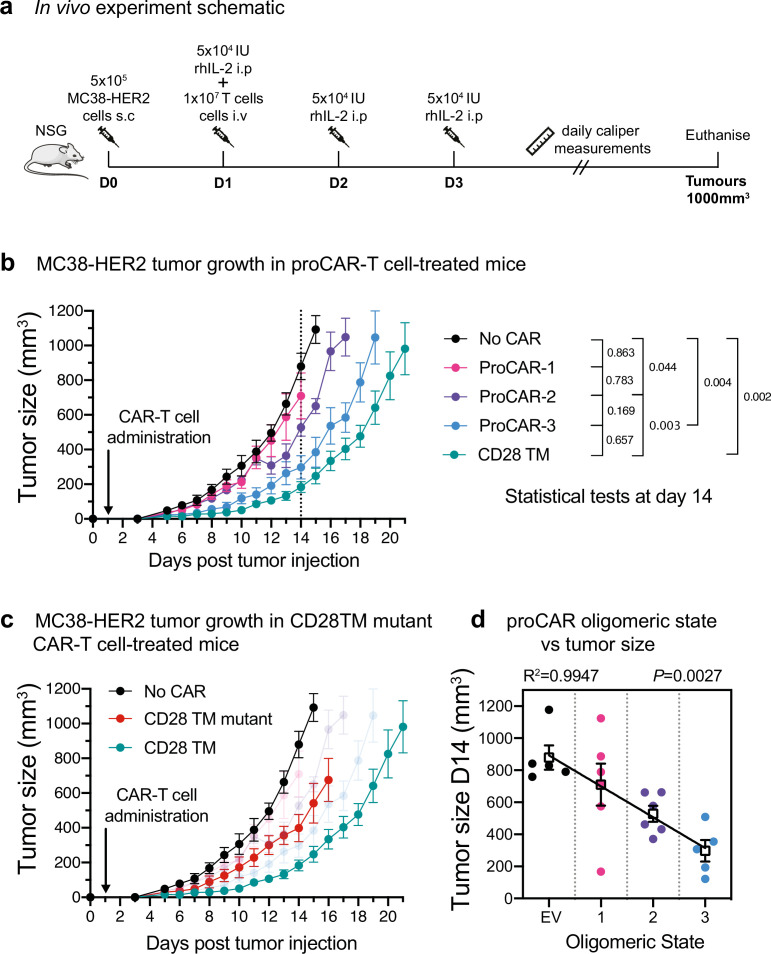
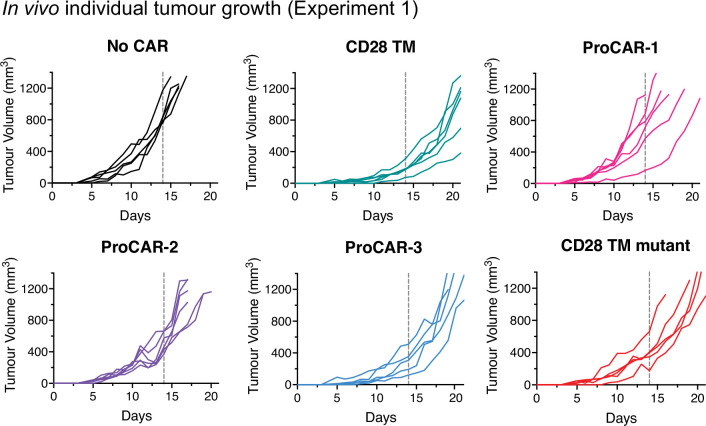
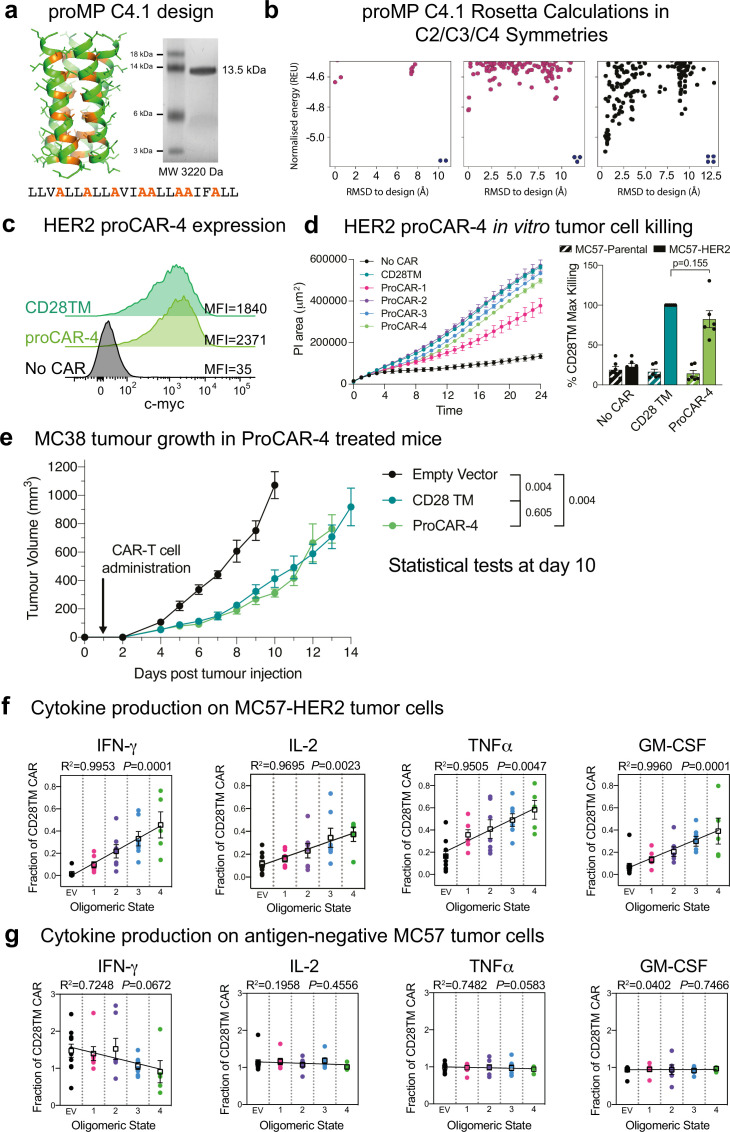
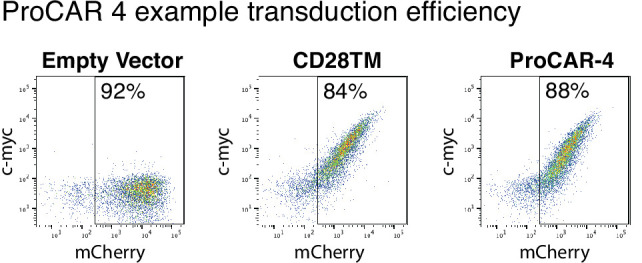
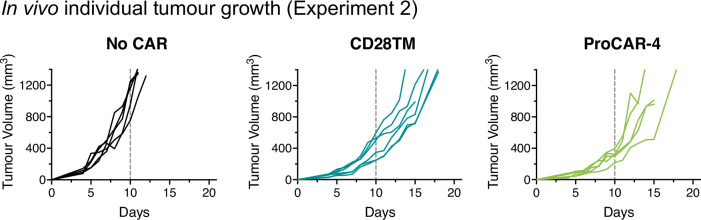
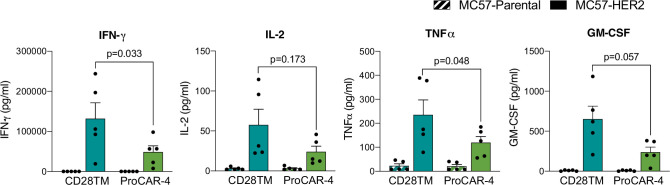
De novo-designed receptor transmembrane domains (TMDs) present opportunities for precise control of cellular receptor functions. We developed a de novo design strategy for generating programmed membrane proteins (proMPs): single-pass α-helical TMDs that self-assemble through computationally defined and crystallographically validated interfaces. We used these proMPs to program specific oligomeric interactions into a chimeric antigen receptor (CAR) that we expressed in mouse primary T cells and found that both in vitro CAR T cell cytokine release and in vivo antitumor activity scaled linearly with the oligomeric state encoded by the receptor TMD, from monomers up to tetramers. All programmed CARs stimulated substantially lower T cell cytokine release relative to the commonly used CD28 TMD, which we show elevated cytokine release through lateral recruitment of the endogenous T cell costimulatory receptor CD28. Precise design using orthogonal and modular TMDs thus provides a new way to program receptor structure and predictably tune activity for basic or applied synthetic biology.

Keywords: CAR T cell; E. coli; Rosetta; chimeric antigen receptor; de novo design; immunology; immunotherapy; inflammation; membrane protein; molecular biophysics; mouse; structural biology; transmembrane.


Conflict of interest statement

AE, NC, JW, MC, MC Author is an inventor on a related patent WO2021229581A2, AD, JN, RT, RC, MJ No competing interests declared, SF Reviewing editor, eLife

Figures

Figure 1.
Figure 1.. Learning the rules for programming self-associating membrane proteins (MPs).
(a) Rosetta fold, dock, and design uses backbone fragments from natural MPs to construct symmetric, de novo architectures and an MP energy function (Weinstein et al., 2019) to optimize the amino acid sequence. (b) Round 1 designs were biased towards the hydrophobic amino acid Leu relative to naturally occurring transmembrane domains (TMDs). In round 2, we incorporated a sequence diversification step that conformed the amino acid propensities to those observed in natural TMDs. (c) The programmed membrane proteins (proMPs) strongly self-associate in the E. coli inner membrane as evidenced by high viability in the deep sequencing TOXCAT-β-lactamase (dsTβL) self-association assay (Elazar et al., 2016a). The TMDs from human quiescin sulfhydryl oxidase 2 (QSOX2) and ErbB2 provide positive controls for TMD self-association, whereas the C-terminal portion of human L-selectin (CLS) provides a negative control. (d–f) Designed positions that are buried at the interface (orange) are more sensitive to mutation according to dsTβL analysis (Elazar et al., 2016a) (y-axis) than exposed positions (blue). Mutations are predicted to be detrimental or neutral/beneficial using computational mutation scanning of the model structures (Materials and methods). Changes in self-association energies upon mutation are computed according to Equation 9. (g) proMPs produced as free peptides form SDS-stable homo-oligomers. SDS-PAGE samples containing approximately 15, 45, and 135 μg of peptide were heated to 95℃ for 1 min and run under reducing conditions. * indicates the position of a minor contaminant from the fusion protein used to generate proMP peptides (Materials and methods). Molecular weight below each gel is for a monomer of the corresponding peptide sequence with additional N-terminal EPE and C-terminal RRLC flanking sequences (Materials and methods). See additional examples in Figure 3. (h, i) The 2.55 Å resolution structure (blue ribbon) determined from crystals grown in monoolein lipid cubic phase (LCP) shows that proMP 1.2, designed to form a dimer, associates to form a trimer in a lipid bilayer environment. (i) Forward-folding ab initio prediction of proMP 1.2 in trimeric (C3) symmetry results in a model structure (h, gray ribbon) that is very close to the experimentally determined one.
Figure 1—figure supplement 1.
Figure 1—figure supplement 1.. A representative example of programmed membrane protein (proMP) sequence diversification resulting in the sequence for proMP 1.8.
(a) De novo-designed proMPs exhibited a high proportion of the large, flexible, and hydrophobic amino acid Leu (bold), in accordance with the high lipophilicity of this amino acid according to the deep sequencing TOXCAT-β-lactamase (dsTβL) lipophilicity scale. Forward-folding ab initio calculations in C2 symmetry, however, exhibited a flat energy landscape with multiple low-energy structures that diverged from the design. (b) Simulated annealing Monte Carlo simulations starting from the sequence in (a) augmented with a potential that biased sequence choices to the propensities observed in natural transmembrane domains (TMDs), resulting in sequences with fewer Leu amino acids. Although the Rosetta energies of the designs prior to sequence diversification were more favorable than after (compare the y-axes of the two plots), the sequence-diversified sequences clearly converged to the designed structure. These results suggest that the sequence composition of natural TMDs encodes negative design principles that ensure folding to a unique conformation. Red one-letter codes indicate positions at the homodimer interface; smooth red and green lines are visual aids. The oligomeric state (dimers) is noted by the pair of black dots at the bottom of the figure.
Figure 1—figure supplement 2.
Figure 1—figure supplement 2.. The E. coli TOXCAT-β-lactamase (TβL) selection system.
Top: the construct comprises two selection domains, β-lactamase and the transcriptional activator ToxR of the chloramphenicol acetyltransferase. The former is only active in the periplasmic space; the latter depends on dimerization and is only active in the cytoplasm. Therefore, this system selects bacteria that express a self-associating domain in the inner membrane. Bottom: spectinomycin selects for transformed bacteria; ampicillin selects for membrane insertion; and ampicillin + chloramphenicol selects for membrane insertion and self-association. All the constructs we tested are expressed in the inner membrane, as evidenced by the uniform resistance to ampicillin. The monomeric construct (the C-terminal portion of human L-selectin [CLS]) serves as a negative control for self-association, and human ErbB2 and quiescin sulfhydryl oxidase 2 (QSOX2) serve as positive controls based on the transmembrane domains (TMDs) of the respective proteins. Many of the programmed membrane proteins (proMPs) display a higher level of survival than the positive controls (e.g., 1.1, 1.2, 1.4, 1.5, 1.6, and 1.8).
Figure 1—figure supplement 3.
Figure 1—figure supplement 3.. Additional design round 1 sequences, model structures, gel shift, and deep mutational scanning analysis.
Each design and a set of single-point mutants were introduced in selected positions (bold) and assayed using the TOXCAT-β-lactamase (TβL) selection scheme. Amino acids that are positioned at the interface are in orange and those that are lipid-facing are in blue. The mutations were generated using DNA oligos with the degenerate codon NYS, encoding the amino acid identities: Ala, Val, Ile, Leu, Phe, Met, Ser, Thr, and Pro (mutations to Pro were excluded from the analysis). We note that programmed membrane protein (proMP) 1.3, whose migration on SDS-PAGE indicates an oligomer larger than a dimer, also shows poor segregation of mutations at predicted interface versus lipid-exposed positions in TβL selection, consistent with the formation of a structure that is different from the design model in this case.
Figure 1—figure supplement 4.
Figure 1—figure supplement 4.. Programmed membrane protein (proMP) 1.2 asymmetric unit and structure statistics.
Crystals of proMP 1.2 were obtained via lipid cubic phase (LCP) crystallization at 35 mg/ml peptide concentration as described in ‘Experimental methods.’ Screening was performed by the CSIRO Collaborative Crystallisation Centre (C3). Oblong hexagonal discs grown in 25% w/v polyethylene glycol 1500, 10% v/v succinate-phosphate-glycine (pH 6.0) were harvested and frozen in liquid nitrogen using 30% glycerol in precipitant solution as cryo-protectant. proMP 1.2 packs in the crystal as a trimer (blue) with one monoolein molecule (wheat stick representation) and a less well-ordered helix that is antiparallel in orientation with respect to the trimer (light blue) in the asymmetric unit. Blue ribbons and text represent the designed sequence; gray ribbons and text represent the appended N- and C-terminal sequences included to aid production and crystallization.
Figure 2.
Figure 2.. Designed membrane proteins (MPs) of defined structure and oligomeric state.
(a) SDS-PAGE migration of programmed membrane protein (proMP) C2.1 is consistent with a dimer in gel shift assays performed as in Figure 1. Design model and peptide sequence shown for reference. (b) Rosetta ab initio structure prediction calculations predict that proMP C2.1 preferentially forms a dimer. (c) proMP C3.1 exhibits a novel Ala-dominated interface, and its migration pattern at high sample concentration suggests a complex larger than a dimer. Design model and peptide sequence shown for reference. (d) Ab initio calculations predict that it primarily forms a trimer. (e–g) The proMP C2.1-designed structure is atomically verified by a 2.7 Å crystal structure. Interfacial positions marked in orange. (h–k) The crystallographic analysis of proMP C3.1 (3.5 Å resolution) reveals a trimer that is almost identical to the design, although one of the three helices in the trimer is antiparallel relative to the other two in the crystal lattice. Alignment of the structure and model (i) shows that the antiparallel helix (green) (j) positions Ala Cβ methyls that pack into the trimer through the designed interface (gray) (k).
Figure 2—figure supplement 1.
Figure 2—figure supplement 1.. Programmed membrane protein (proMP) C2.1 asymmetric unit and structure statistics.
Crystals of proMP C2.1 were obtained via lipid cubic phase (LCP) crystallization at 40 mg/ml peptide concentration as described in ‘Experimental methods.’ Screening was performed by the CSIRO Collaborative Crystallisation Centre (C3). Large rhomboid plates grown in 8% v/v 2-methyl-2,4-pentanediol, 0.1 M ADA (pH 6.7), 0.4 M potassium nitrate, 0.1 M tripotassium citrate were harvested and frozen in liquid nitrogen using 30% glycerol in precipitant solution as cryo-protectant. proMP C2.1 packs in the crystal as a trimer of dimers with two monoolein molecules (wheat stick representation) in the asymmetric unit. Purple ribbons and text represent the designed sequence; gray ribbons and text represent the appended N- and C-terminal sequences included to aid production and crystallization.
Figure 2—figure supplement 2.
Figure 2—figure supplement 2.. Programmed membrane protein (proMP) C3.1 asymmetric unit and structure statistics.
Crystals of proMP C3.1 were obtained via sitting-drop vapor diffusion crystallization at 10 mg/ml peptide in 30 mM C8E4 detergent as described in ‘Experimental methods.’ Screening was performed by the CSIRO Collaborative Crystallisation Centre (C3). Small ellipsoid crystals grown in 65% v/v 2-methyl-2,4-pentanediol, 0.1 M tris chloride pH 8.0 were harvested and frozen in liquid nitrogen with no additional cryo-protectant. proMP C3.1 packs in the crystal with a trimer of trimers in the asymmetric unit. Green ribbons and text represent the designed sequence; gray ribbons and text represent the appended N- and C-terminal sequences included to aid production and crystallization.
Figure 3.
Figure 3.. Construction and in vitro functional profiling of HER2-specific programmed chimeric antigen receptors (proCARs).
(a) Schematic showing the domain organization of the reference HER2-specific CAR constructs and modifications made to introduce programmed membrane protein (proMP) transmembrane domains (TMDs). Bold, boxed sequence indicates the human CD28 TMD in the reference CD28TM and no cys CARs and designed proMP sequences in the monomeric (proCAR-1), dimeric (proCAR-2), and trimeric (proCAR-3) receptors. (b) BW5147 murine thymoma cells stably expressing proCARs and a destabilized GFP NF-κB reporter were surface labeled with anti-Myc antibody and analyzed by flow cytometry to assess surface expression levels. (c) Live cells from (b) were coated with polyclonal anti-IgG to bind CARs through the scFv domain and immunoprecipitated using protein G beads. Products were separated by nonreducing SDS-PAGE and immunoblotted using anti-Myc antibody to visualize surface-expressed CAR proteins. Molecular weight of the unglycosylated CAR polypeptide is 55 kDa. (d, e) Cells from (b) were co-cultured with HER2+ SKBR3 human breast adenocarcinoma cells for the indicated times and analyzed by flow cytometry for upregulation of activation marker CD69 (d) and GFP expression from the NF-κB reporter (e). All activation levels are normalized to the 8 hr time point in cells expressing the CD28TM CAR (% CD28TM Max). Bars represent the mean ± SD, and dots show the individual data points for three independent experiments. (f) Maximum target killing percentage at 20:1 effector to target ratio from 4 hr 51Cr release assay. Bars show mean ± SEM with each data point representing an individual experiment (n = 3). p-Values determined from paired t-tests. (g) Cytokine production by primary mouse HER2 proCAR T cells following 24 hr co-culture with MC57-HER2 target tumor cells. Bars show mean concentration ± SEM with each data point representing an individual experiment (n = 5). Significance was determined from one-way ANOVA with multiple comparisons. Cytokine production on antigen-negative parental MC57 cells shown separately in Figure 3—figure supplement 3.
Figure 3—figure supplement 1.
Figure 3—figure supplement 1.. Design of a highly expressed monomeric programmed membrane protein (proMP).
(a) Ab initio structure predictions for proMP-1 in C2, C3, and C4 symmetries exhibit flat energy landscapes, suggesting that the design would not form homo-oligomers. (b) The design model of proMP-1 shows no flat surfaces that are prone to self-association; yet, the sequence is highly hydrophobic with apparent insertion energy computed using the deep sequencing TOXCAT-β-lactamase (dsTβL) scale of –18.7 kcal/mol (compared to –5.9 kcal/mol for a reference monomer [the human CLS sequence]). (c) The design is extremely sensitive to chloramphenicol in the dsTβL assay (compared to the weak natural homodimer transmembrane domain [TMD] from human quiescin sulfhydryl oxidase 2 [QSOX2], which served as a reference), verifying that it does not form homo-oligomers.
Figure 3—figure supplement 2.
Figure 3—figure supplement 2.. Mouse chimeric antigen receptor (CAR) T cell gating strategy and example programmed chimeric antigen receptor (proCAR) transduction.
(a) Flow cytometry gating strategy to determine the transduction efficiency of primary murine CAR T cells. Lymphocytes selected via morphology, live cells selected as zombie aqua negative, T cells selected as CD3+CD8+ and mCherry+ cells defined as CAR T cells. c-Myc co-expression with mCherry indicates surface CAR expression. (b) Example 2D plots showing extracellular c-Myc labeling (y-axis) vs. intracellular mCherry (x-axis) of CD3+CD8+ T cells on day 5 post-transduction with CD28TM CARs and ProCARs 1–3, demonstrating the percentage of cells expressing the CARs. Empty mCherry vector included as c-Myc-negative control.
Figure 3—figure supplement 3.
Figure 3—figure supplement 3.. Raw cytokine secretion against MC57-parental targets for programmed chimeric antigen receptors (proCARs) 1–3.
Cell culture supernatants from CD28TM, no cysteine, proCAR-1, proCAR-2, and proCAR-3 T cells co-cultured with antigen-negative MC57 tumor cells for 24 hr were assessed for cytokine secretion using LEGENDPlex cytokine kits for IFN-γ, IL-2, TNFɑ, and GM-CSF. Mean ± SEM of n = 5 independent experiments shown.
Figure 4.
Figure 4.. Functional consequences of chimeric antigen receptor (CAR)-CD28 association in CAR T cells.
(a) Model of the CD28TM interface generated by mutagenesis of the CD3ζ TMD (PDB: 2HAC). Polar residues of the CD28 dimerization motif (orange) with predicted hydrogen bonds depicted (dotted lines). (b) Surface expression and (c) SDS-PAGE and immunoblot analysis of HER2 CARs possessing WT CD28TM or CD28TM mutations depicted in (a) expressed in the BW5147 cell line. (d) Quantitation of target cell killing measured by chromium release assay and cytokine production by primary mouse CD8+ CAR T cells in response to the MC57-HER2 target cell line (n = 4). Experiments performed as in Figure 3. p-Values determined by paired t-tests. (e) Representative immunofluorescent confocal images of CAR-CD28 co-clustering in primary mouse CAR T cells. CAR clustering was induced with anti-Myc primary followed by crosslinking with fluorescent secondary antibody (magenta). Cells were then labeled for CD28 (cyan). Images are Z-projections over 12 m, scale bar represents 3 m. (f) Quantitation of CAR-CD28 co-clustering, each dot representing the percentage of CAR clusters in one cell that co-localized with a CD28 cluster. Lines show mean CAR-CD28 co-clustering percentage/per cell ± SEM, n ≥ 30 cells. p-Values determined by unpaired t-tests.
Figure 5.
Figure 5.. In vivo antitumor potency scales directly with programmed chimeric antigen receptor (proCAR) oligomeric state.
(a) Treatment schedule and experimental setup. NOD-SCID-IL2RG-/- (NSG) mice were injected subcutaneously with MC38-HER2 tumor cells and treated the following day with CD8+ T cells delivered intravenously. Mice were supplemented with daily intraperitoneal injections of recombinant human IL-2 from days 1–3, and tumors measured daily until they reached ethical limits. (b) Tumor growth over time for No CAR (empty vector), CD28TM WT, and proCAR T cell groups (n = 5–6 mice/group). Data points represent mean ± error bars showing SEM. Statistical analysis performed using a two-way ANOVA at day 14. (c) Tumor growth over time of the CD28TM mutant group superimposed on (b). (d) Linear correlation of tumor size on day 14 from (b) vs. proCAR oligomeric state, where the ‘0’ point is provided by empty vector (EV)-transduced T cells. Individual data points are colored, mean values in white box and error bars indicate SEM. p-Values indicate the confidence that the slope of the linear regression is nonzero.
Figure 5—figure supplement 1.
Figure 5—figure supplement 1.. Individual tumor growth from in vivo experiment 1.
Individual tumor growth curves for all mice treated and presented in Figure 5b and c (n = 5–6 mice/group). Vertical dotted lines indicate day 14, the last time point all mice were alive in each experiment and the day of statistical analysis.
Figure 6.
Figure 6.. In vitro cytokine production scales with programmed chimeric antigen receptor (proCAR) oligomeric state including tetramers.
(a) SDS-PAGE migration of programmed membrane protein (proMP) C4.1 is consistent with a tetramer. Design model and peptide sequence shown for reference. (b) Rosetta ab initio structure prediction calculations predict that proMP C4.1 preferentially forms a tetramer. (c) CAR surface expression on primary mouse CD8+ T cells stably expressing CD28TM and proCAR-4 analyzed by c-Myc staining on flow cytometry. HER2 proCAR-4 was designed using the proMP C4.1 sequence without the final C-terminal leucine as a transmembrane domain (TMD), inserted as shown in Figure 3a. (d) IncuCyte killing assay over 24 hr of no CAR, CD28TM, and proCAR1-4 T cells on MC57-HER2 target cells at 1:1 effector to target ratio. Comparison of maximum killing for n = 6 independent experiments shown between CD28TM vs. ProCAR-4. Data points represent individual experiments, with mean ± SEM error bars plotted. (e) Tumor growth over time using the same experimental design in Figure 5a for No CAR (empty vector), CD28TM WT, and proCAR-4 T cell groups (n = 5–6 mice/group). Data points represent mean ± error bars showing SEM. Statistical analysis performed using a two-way ANOVA at day 10. (f, g) Linear correlation of proCAR oligomeric state vs. IFNγ, IL-2, TNFα, and GM-CSF cytokine production (normalized to CD28TM reference) from 24 hr co-culture with (e) MC57-HER2 and (f) antigen-negative MC57 tumor cells. Individual data points are colored, mean values in white box and error bars indicate SEM.
Figure 6—figure supplement 1.
Figure 6—figure supplement 1.. Example CD28TM vs. proCAR-4 transduction.
Example 2D plots showing extracellular c-Myc labeling (y-axis) vs. intracellular mCherry (x-axis) of CD3+CD8+ T cells on day 5 post-transduction with CD28TM chimeric antigen receptors (CARs) and proCAR-4, demonstrating the percentage of cells expressing the CARs. Empty mCherry vector included as c-Myc-negative control.
Figure 6—figure supplement 2.
Figure 6—figure supplement 2.. Individual tumor growth from in vivo experiment 2.
Individual tumor growth curves for all mice treated and presented in Figure 6e (n = 5–6 mice/group). Vertical dotted lines indicate day 10, the last time point all mice were alive in each experiment and the day of statistical analysis.
Figure 6—figure supplement 3.
Figure 6—figure supplement 3.. Raw cytokine secretion of proCAR-4 vs. CD28TM.
proCAR-4 and CD28TM chimeric antigen receptor (CAR) T cells were co-cultured with either antigen-negative (MC57-Parental) or MC57-HER2 target tumor cells and incubated for 24 hr. Cell culture supernatants were subsequently collected analyzed for cytokine secretion using LEGENDPlex cytokine kits for IFN-γ, IL-2, TNFɑ, and GM-CSF. Mean ± SEM of five biological replicates shown.

References

    1. Alabanza L, Pegues M, Geldres C, Shi V, Wiltzius JJW, Sievers SA, Yang S, Kochenderfer JN. Function of Novel Anti-CD19 Chimeric Antigen Receptors with Human Variable Regions Is Affected by Hinge and Transmembrane Domains. Molecular Therapy. 2017;25:2452–2465. doi: 10.1016/j.ymthe.2017.07.013. - DOI - PMC - PubMed
    1. Arkhipov A, Shan Y, Das R, Endres NF, Eastwood MP, Wemmer DE, Kuriyan J, Shaw DE. Architecture and membrane interactions of the EGF receptor. Cell. 2013;152:557–569. doi: 10.1016/j.cell.2012.12.030. - DOI - PMC - PubMed
    1. Balakrishnan A, Rajan A, Salter AI, Kosasih PL, Wu Q, Voutsinas J, Jensen MC, Plückthun A, Riddell SR. Multispecific Targeting with Synthetic Ankyrin Repeat Motif Chimeric Antigen Receptors. Clinical Cancer Research. 2019;25:7506–7516. doi: 10.1158/1078-0432.CCR-19-1479. - DOI - PMC - PubMed
    1. Barth P, Senes A. Toward high-resolution computational design of the structure and function of helical membrane proteins. Nature Structural & Molecular Biology. 2016;23:475–480. doi: 10.1038/nsmb.3231. - DOI - PMC - PubMed
    1. Berry R, Call ME. Modular Activating Receptors in Innate and Adaptive Immunity. Biochemistry. 2017;56:1383–1402. doi: 10.1021/acs.biochem.6b01291. - DOI - PubMed

Publication types