. 2023 Jan;19(1):126-151.
doi: 10.1080/15548627.2022.2063003. Epub 2022 May 4.

Nucleoporin POM121 signals TFEB-mediated autophagy via activation of SIGMAR1/sigma-1 receptor chaperone by pridopidine

Affiliations

Nucleoporin POM121 signals TFEB-mediated autophagy via activation of SIGMAR1/sigma-1 receptor chaperone by pridopidine

Shao-Ming Wang et al. Autophagy. 2023 Jan.

Abstract

Macroautophagy/autophagy is an essential process for cellular survival and is implicated in many diseases. A critical step in autophagy is the transport of the transcription factor TFEB from the cytosol into the nucleus, through the nuclear pore (NP) by KPNB1/importinβ1. In the C9orf72 subtype of amyotrophic lateral sclerosis-frontotemporal lobar degeneration (ALS-FTD), the hexanucleotide (G4C2)RNA expansion (HRE) disrupts the nucleocytoplasmic transport of TFEB, compromising autophagy. Here we show that a molecular chaperone, the SIGMAR1/Sigma-1 receptor (sigma non-opioid intracellular receptor 1), facilitates TFEB transport into the nucleus by chaperoning the NP protein (i.e., nucleoporin) POM121 which recruits KPNB1. In NSC34 cells, HRE reduces TFEB transport by interfering with the association between SIGMAR1 and POM121, resulting in reduced nuclear levels of TFEB, KPNB1, and the autophagy marker LC3-II. Overexpression of SIGMAR1 or POM121, or treatment with the highly selective and potent SIGMAR1 agonist pridopidine, currently in phase 2/3 clinical trials for ALS and Huntington disease, rescues all of these deficits. Our results implicate nucleoporin POM121 not merely as a structural nucleoporin, but also as a chaperone-operated signaling molecule enabling TFEB-mediated autophagy. Our data suggest the use of SIGMAR1 agonists, such as pridopidine, for therapeutic development of diseases in which autophagy is impaired.Abbreviations: ALS-FTD, amyotrophic lateral sclerosis-frontotemporal dementiaC9ALS-FTD, C9orf72 subtype of amyotrophic lateral sclerosis-frontotemporal dementiaCS, citrate synthaseER, endoplasmic reticulumGSS, glutathione synthetaseHRE, hexanucleotide repeat expansionHSPA5/BiP, heat shock protein 5LAMP1, lysosomal-associated membrane protein 1MAM, mitochondria-associated endoplasmic reticulum membraneMAP1LC3/LC3, microtubule-associated protein 1 light chain 3NP, nuclear poreNSC34, mouse motor neuron-like hybrid cell lineNUPs, nucleoporinsPOM121, nuclear pore membrane protein 121SIGMAR1/Sigma-1R, sigma non-opioid intracellular receptor 1TFEB, transcription factor EBTMEM97/Sigma-2R, transmembrane protein 97.

Keywords: ALS/FTD; KPNB1/importinβ1; SIGMAR1; TFEB; c9orf72; chaperone; nucleocytoplasmic transport; nucleoporin POM121; pridopidine; sigma-1 receptor.


Conflict of interest statement

SMW, HEW, MC, TPS have no conflict of financial interest in the publication of this manuscript. MRH is CEO of Prilenia Neurotherapeutics, BV. MG is an employee of Prilenia Neurotherapeutics, Ltd, a subsidiary of Prilenia Therapeutics, BV. TM holds patents describing SIGMAR1/Sig1R ligands and did consultancies for Prilenia Therapeutics. TPS served from March, 2019- March, 2020, per NIDA/NIH approval, as a non-paid member of the Advisory Board to the Prilenia Therapeutics.

Figures

Figure 1.
Figure 1.
SIGMAR1/Sigma-1 receptor colocalized with POM121 at nuclear envelope in NSC34 motoneuron-like cells. (A) SIGMAR1 colocalized with POM121. Confocal images demonstrated the aerial view for the colocalization of SIGMAR1 (green) and POM121 (red) in NSC34 cells. (B) Confocal images with multiple Z-axis sections of a chosen cell from (A). (C) Confocal images of “Z-axis section 5” in aerial view (middle) and in 3D views (XZ- or YZ- axis on top and right side of the main image) indicating the colocalization of immunoreactive SIGMAR1 (green) and POM121 (red) even on the Z-dimension. (D) Tracking (arrows shown in B) of the signal intensities for SIGMAR1, POM121, and DAPI in the “Z-axis section 5” indicated the colocalization of SIGMAR1 and POM121 in close proximity to the nucleus per DAPI staining.
Figure 2.
Figure 2.
SIGMAR1/Sigma-1 receptor, POM121, and KPNB1/importinβ1 formed a complex. (A) In HA-SIGMAR1 transfected NSC-34 cells, coimmunoprecipitation (coIP) study showed the association of HA-SIGMAR1 with POM121 and KPNB1. (B) Similarly, in POM121-MYC/DDK and SIGMAR1-GFP co-expressing NSC-34 cells, sample blot demonstrates the coIP of MYC/DDK-POM121, SIGMAR1-GFP, and endogenous KPNB1. (C) Summary data from (B) show an increased association of endogenous KPNB1 and SIGMAR1-EGFP. Data are presented as means ± SEM; N = 3; two-tailed unpaired Student<apos;>s t test, p = 0.0091, **p < 0.01. (D) Immunoprecipitation with the POM121 antibody successfully coIPed endogenous KPNB1 and SIGMAR1. n = 3 (A), n = 3 (B), and n = 2 (D) independent experiments with similar results each from biologically independent cells or cellular preparations. Note 1: The intense wide band, observed directly above the SIGMAR1 band, was the IgG light chain (labeled in Figure 2D). Note 2: Our lab has extensive experience in evaluating levels of endogenous SIGMAR1 proteins. From our experience, in order to obtain reliable and measurable levels of “endogenous” SIGMAR1 in a co-IP experiment, a high amount of sample in the co-IP is needed. The amount of sample in the input was for illustration purposes and was therefore smaller than the amount employed in the co-IP. For that reason, the POM121 was bigger than in the input.
Figure 3.
Figure 3.
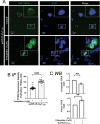
(G4C2)31-RNA repeats attenuated the SIGMAR1/Sigma-1 receptor-POM121 association as well as the SIGMAR1/Sigma-1 receptor-KPNB1/importinβ1 association in NSC34 cell. (A) In (G4C2)31-RNA repeats-transfected-NSC34 cells, the HA antibody was used to pull down HA-SIGMAR1. Technically, this is not the HA control. The real control is the IP using IgG in lanes #3, #4, which unfortunately show some background. Western blot showed a decreased association between SIGMAR1 and POM121 as well as between SIGMAR1 and KPNB1. Data were quantified in (B) for SIGMAR1-POM121 and in (C) for SIGMAR1-KPNB. Data are presented as means ± SEM; N = 3; two-tailed unpaired Student<apos;>s t test, ****p <0.0001 (for Pom121) and ***p = 0.0001 (for KPNB1). Note: Band intensities in IgG control [i.e., lanes 3, 4 in (A)] were subtracted from samples lanes [(i.e., lanes numbers 5, 6 respectively in (A)]. (D) Sample blot showed POM121 and KPNB1 protein level in EGFP-(G4C2)31-expressing NSC-34 cells. (E) Quantification of data from (D) showed no statistically significant difference. Data are presented as means ± SEM; N = 6; two-tailed unpaired Student<apos;>s t test, p = 0.1308 (for POM121) and p= 0.4212 (for KPNB1/importinβ1). (F) SIGMAR1 increased POM121 protein expression but not KPNB1 in EGFP-(G4C2)31-expressing NSC-34 cells. (G) Quantification of data from (F) showed that POM121 is upregulated by SIGMAR1 overexpression when NSC34 cells were treated with (G4C2)31-RNA repeats. Data are presented as means ± SEM; N = 3; two-tailed unpaired Student<apos;>s t test, p = 0.0258 (for POM121) and p = 0.2765 (for KPNB1), *p < 0.01.
Figure 4.
Figure 4.
SIGMAR1/Sigma-1 receptor stabilized POM121 but not KPNB1/importinβ1 in (G4C2)31-RNA-treated NSC34 cells. (A) Stability of POM121 and KPNB1 in EGFP-(G4C2)31-overexpressing NSC-34 cells in the presence of cycloheximide (100 µg/ml). Time-lapsed levels of POM121 and KPNB1 were examined by western blot. (B) Summary data from (A) show a decrease of protein turnover rate in POM121. (C) Summary data for KPNB1. Data are mean ± SEM; N = 3; Note: non-liner regression with best fit; for POM121 in (B), p = 0.0805; for KPNB1 in (C), p = 0.1514. (D) Stability of POM121 and KPNB1 in HA-SIGMAR1 and EGFP-(G4C2)31 co-overexpressing NSC34 cells by using the same cycloheximide (100 µg/ml) treatment tracking technique. Time-lapsed levels of POM121 and KPNB1 were examined by western blot. (E) Summary data from (D) show a decrease of protein turnover rate in POM121. (F) Summary data for KPNB1. Data are means± SEM; N = 3; non-liner regression with best fit; for POM121 (E), p = 0.0297, *p < 0.05; for KPNB1 (F), p = 0.5202.
Figure 5.
Figure 5.
Overexpression of SIGMAR1/Sigma-1 receptor or POM121 in NSC-34 cells rescued (G4C2)31-RNA-repressed autophagy response. (A) Overexpression of HA-SIGMAR1 increased the autophagy marker LC3-II in EGFP-(G4C2)31-treated NSC34 cells. (B) Quantitative data from (A) are mean ± SEM; N = 3; one-way ANOVA followed by Tukey<apos;>s multiple comparisons test, p = 0.0027 and 0.0289 for HA/EGFP and HA-SIGMAR1/EGFP-(G4C2)31 vs HA/EGFP-(G4C2)31, respectively; *p < 0.05, **p < 0.01. Blots were washed 3 times for 10 min with TBST and developed by using the Azure Biosystem c600 Gel Imaging System. The band intensity was analyzed by Image Studio Lite (LiCor 5.2) according to the manufacturer<apos;>s manual. Note: Band intensities were normalized to that of ACTB/β-actin. (C) Overexpression of POM121-MYC/DDK increases LC3-II expression. (D) Quantitative data from (C) are mean ± SEM; N = 3; one-way ANOVA followed by Tukey<apos;>s multiple comparisons test, p = 0.0057 and p = 0.0005 for MYC/DDK/EGFP vs MYC/DDK/EGFP-(G4C2)31 and MYC/DDK/EGFP-(G4C2)31 vs POM121-MYC/DDK/EGFP-(G4C2)31, respectively; **p < 0.01, ***p < 0.001. Blots were washed 3 times for 10 min with TBST and developed by using the Azure Biosystem C600. The band intensity was analyzed by Image Studio Lite (LiCor 5.2) according to the manufacturer<apos;>s manual. Band intensities were normalized to that of ACTB/β-actin.
Figure 6.
Figure 6.
Nuclear to cytosolic ratio (N:C) of TFEB and KPNB1/importinβ1 was decreased by (G4C2)31-RNA repeats while the overexpression of SIGMAR1/Sigma-1 receptor or POM121 rescued the N:C ratio deficit of TFEB and KPNB1/importinβ1 caused by the RNA repeats. (A) Overexpression of EGFP-(G4C2)31 in NSC-34 cells decreased the N:C ratio of TFEB and KPNB1. Note: Three repetitions of Figure 6A, are detailed (Fig. S4). (B) Quantitative data from (A) are means ± SEM; N = 3; two-tailed unpaired Student<apos;>s t test, p = 0.0474 (TFEB) and p = 0.0307 (KPNB1), *p < 0.05. (C) Overexpression of HA-SIGMAR1 rescued the N:C ratio deficit of TFEB and KPNB1 caused by the EGFP-(G4C2)31. Note: Four repetitions of Figure 6C are shown (Fig. S5). (D) Quantitative data from (C) are means ± SEM; N = 4; two-tailed unpaired Student<apos;>s t test, p = 0.0259 (TFEB) and p = 0.0032 (KPNB1), *p < 0.05, **p < 0.01. (E) POM121-MYC/DDK overexpression rescued the N:C ratio deficit of TFEB and KPNB1 imposed by and EGFP-(G4C2)31. Note: Three repetitions of Figure 6E are shown (Fig. S6). (F) Quantitative data from (E) are means ± SEM; N = 3; two-tailed unpaired Student<apos;>s t test, p = 0.0107 (TFEB) and p = 0.0313 (KPNB1), *p < 0.05. Note: The subcellular fraction was conducted by using HDAC2 as nuclear fraction marker and TUBA/α-tubulin or ACTB/β-Actin as cytoplasmic fraction marker throughout the experiments.
Figure 7.
Figure 7.
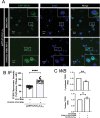
Overexpression of SIGMAR1/Sigma-1 receptor increased nuclear TFEB level in (G4C2)31-RNA repeat-transfected NSC34 cells. (A) TFEB translocation in nucleus under SIGMAR1-expressing in (G4C2)31-RNA repeat NSC-34 cells. Confocal images demonstrated GFP-TFEB colocalizes with DAPI in NSC34 cells. (B) The quantification data from (A) showed an increased nuclear GFP-TFEB intensity. Intensity analyses were performed by using NIH ImageJ. (version 1.51b). Note: Data shown are percentages of “Average nuclear fluorescence intensity/Average whole cell fluorescence intensity” for each group. HA groups N = 42; HA-SIGMAR1 groups N = 34; two-tailed unpaired Student<apos;>s t test, ****p < 0.0001. (C) Overexpression of HA-SIGMAR1 increased the nuclear TFEB expression caused by the EGFP-(G4C2)31. Analyses of Figure 6C western blot showed that the overexpression of HA-SIGMAR1 increased the protein level of nuclear TFEB and concomitantly decreased the cytoplasmic TFEB caused by GFP-(G4C2)31. Quantitative data are means ± SEM; N = 4; two-tailed unpaired Student<apos;>s t test, p = 0.0814 (cytosolic TFEB), p = 0.0323 (nuclear TFEB), *p < 0.05.
Figure 8.
Figure 8.
Overexpression of POM121 rescues the TFEB translocation into nucleus in (G4C2)31-RNA repeat-treated NSC34 cells. (A) Increased level of nuclear GFP-TFEB in POM121-overexpressing, (G4C2)31-RNA repeat-treated NSC34 cells. Confocal images demonstrated the GFP-TFEB colocalization with DAPI in NSC34 cells. (B) The quantification of data from (A) showed a significant increase in the intensity of nuclear GFP-TFEB. The intensity analysis was performed by using NIH ImageJ. (version 1.51b). Note: Data shown are percentages of “Average nuclear fluorescence intensity/Average whole cell fluorescence intensity” for each group; MYC/DDK group, N = 35; POM121-MYC/DDK group, N = 24; two-tailed unpaired Student<apos;>s t test, ****p < 0.0001. (C) Analyses of Figure 6E western blot shows that the overexpression of POM121 increased the protein level of nuclear TFEB and concomitantly decreased the cytoplasmic TFEB caused by GFP-(G4C2)31. Quantitative data are means ± SEM; N = 3; two-tailed unpaired Student<apos;>s t test, p = 0.0060 (cytoplasmic TFEB), p = 0.0407 (nuclear TFEB), *p < 0.05, ** p < 0.01.
Figure 9.
Figure 9.
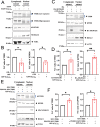
Pridopidine, a highly selective SIGMAR1/Sigma-1 receptor agonist, facilitated the dissociation of SIGMAR1/Sigma-1 receptor from HSPA5/BiP in an apparently biphasic manner which was mirrored by the increased association of SIGMAR1/Sigma-1 receptor with POM121 in a biphasic manner as well as a decreased SIGMAR1/Sigma-1 receptor oligomerization at effective dose. (A) Pridopidine caused the dissociation of SIGMAR1 from HSPA5 in an apparently biphasic manner. The three repetitions of the assay detailed in Figure 9A are shown in Figure S7. (B) Summary quantitative data from (A) are means ± SEM; N = 3; one-way ANOVA followed by Dunnett<apos;>s multiple comparisons test (HSPA5 assoc. SIGMAR1-EYFP), ***p = 0.0004 (0 µM vs 0.5 µM Pridopidine); ***p = 0.0004 (0 µM vs 1 µM Pridopidine); *p = 0.0279 (0 µM vs 5 µM Pridopidine). Note: Band intensities of HSPA5 were normalized to those of SIGMAR1-YFP. (C) Pridopidine conversely increased the association between SIGMAR1 and POM121 in a biphasic manner. (D) Summary data from (C) are means ± SEM; N = 3; one-way ANOVA followed by Dunnett<apos;>s multiple comparisons test (POM121 assoc. SIGMAR1-EYFP), p = 0.0270 (0 µM vs 0.5 µM Pridopidine); p = 0.0194 (0 µM vs 1 µM pridopidine). (E) Native gel separation of oligomers of SIGMAR1 proteins. Pridopidine decreased the oligomerization of SIGMAR1 proteins at effective concentration of 1 µM. (F) Summary data from (E) indicting the apparent biphasic effect of pridopidine. Data are means ± SEM; N = 3 independent experiments; one-way ANOVA followed by Dunnett<apos;>s multiple comparisons test, *p < 0.05.
Figure 10.
Figure 10.
Pridopidine enhanced the SIGMAR1/Sigma-1 receptor chaperone activity in the citrate synthase (CS) aggregation assay, which was inhibited by the SIGMAR1/Sigma-1 receptor antagonist BD-1063. (A) Pridopidine by itself did not affect the aggregation of CS. CS (1.1 mM) were incubated at 45°C in the 50 mM HEPES-KOH buffer containing vehicle or pridopidine (200 µM) as shown. The samples were monitored for absorbance at 320 nm, which is indicative of light scattering due to CS aggregation. Relative scattering was expressed in arbitrary units. Data are means ± SEM; N = 3; non-liner regression with best fit, p = 0.1008 for CS+PBS vs CS+Pridopidine. (B) Pridopidine significantly enhanced the SIGMAR1 chaperoning activity against the aggregation of CS. Data are means ± SEM; N = 3; non-liner regression with best fit; p < 0.0001. (C) Pridopidine enhancement of SIGMAR1 chaperone activity was inhibited by the SIGMAR1 antagonist BD-1063. Conditions are the same as in (B). BD-1063 was added 10 min before pridopidine. BD1063 (0.2 mM), GST (1 mM), GST-SIGMAR1 (1 mM), pridopidine (200 µM) as shown. Data are means ± SEM; N = 3; non-liner regression with best fit; p < 0.001 (GST-SIGMAR1+ Pridopidine+BD1063 vs GST-SIGMAR1+ Pridopidine+vehicle). (D) SIGMAR1 by itself was a chaperone in this CS aggregation assay. Non-liner regression with best fit; p < 0.0001.
Figure 11.
Figure 11.
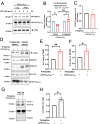
Pridopidine promoted the stability of POM121, increased TFEB and KPNB1/importinβ1 nuclear translocation, and facilitated autophagy in (G4C2)31-RNA-treated NSC-34 cells. (A) In the protein turnover experiment using cycloheximide (100 µg/ml) and testing the remaining protein level at the 0- and 6-h time points, pridopidine rescued the decrease of POM121 caused by (G4C2)31. Protein levels of POM121 at 0 and 6 h are shown. POM121 protein levels at various time points were then measured by western blot. Note: Cycloheximide was added into culture medium at time zero, i.e., 24 h after the (G4C2)31 transfection. (B) Quantitative data from (A) are presented. Data are mean ± SEM; N = 3; two-way ANOVA followed by Tukey<apos;>s multiple comparisons test, p = 0.0416 for vehicle 0 h vs vehicle 6 h, *p < 0.05; p = 0.0015 for vehicle 6 h vs pridopidine 6 h, **p < 0.01. (C) The overnight transfection of (G4C2)31 did not affect POM121 protein levels at time 0 of the cycloheximide experiment. Data are mean ± SEM; N = 3. (D) Pridopidine rescued the N:C ratios of TFEB and KPNB1 as well the level of the autophagy marker LC3-II in NSC34 cells transfected with (G4C2)31. A sample western blot is shown. HDAC2 served as nuclear fraction marker and TUBA/α-tubulin as cytoplasmic fraction marker. Three repetitions of the assay from Figure 10D are shown in Figure S8. (E) Summary data from (D) are presented where the N:C ratio of TFEB was rescued by pridopidine. Band intensities in cytosol and nuclear extract lanes were normalized to ACTB/β-actin and HDAC2 respectively. (F) Summary data from (D) are presented where the N:C ratio of KPNB1 was rescued by pridopidine. Band intensities in cytosol lanes and nucleus lanes were normalized to ACTB/β-actin and HDAC2 respectively. Notes to (E) and (F): The band intensities of the nuclear proteins and cytoplasmic proteins were normalized to different control proteins; Band intensities in cytoplasmic extract were normalized to ACTB/β-actin, while those in the nuclear extract were normalized to HDAC2; The N:C ratio is calculated based on the normalized intensities. Thus, simply looking at the western blot may not reflect the exact N:C ratio. Furthermore, we have used the LiCor 5.2 machine to quantify the bands, which provided high detection sensitivity and accurate quantification of the obtained bands. Data in (E) and (F) are means ± SEM; N = 3; two-tailed unpaired Student<apos;>s t test, p = 0.0033 (TFEB), **p < 0.01, and p = 0.0255 (KPNB1), *p < 0.05. (G) Pridopidine rescued LC3-II levels in (G4C2)31-transfected NSC34 cells. A sample western blot is shown. Note: Western blots were washed 3 times for 10 min with TBST and developed by using the Azure Biosystem c600. The band intensity was analyzed by Image Studio Lite (LiCor 5.2) according to the manufacturer<apos;>s manual. Band intensities were normalized to that of TUBA/α-tubulin. The N:C ratios were calculated based on the normalized intensities. The three repetitions of the assay from Figure 10G are shown in Figure S9. (H) Summary data from (G) are presented as means ± SEM; N = 3; two-tailed unpaired Student<apos;>s t test, p = 0.0272 for vehicle+EGFP-(G4C2)31 vs Pridopidine+EGFP-(G4C2)31, *p < 0.05.
Figure 12.
Figure 12.
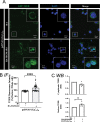
Pridopidine treatment rescued nuclear TFEB level in (G4C2)31-RNA repeats-treated NSC34 cells. (A) Nuclear GFP-TFEB level was increased by pridopidine in (G4C2)31-RNA repeated-NSC34 cells. Confocal images demonstrate the GFP-TFEB colocalization with DAPI in NSC34 cells. (B) The quantification data from (A) showed an increased intensity of GFP-TFEB in the nucleus. Intensity analysis was performed by using NIH ImageJ. (version 1.51b). Note: Data shown are percentages of “Average nuclear fluorescence intensity/Average whole cell fluorescence intensity” for each group. Control groups, N = 28; pridopidine treatment groups, N = 21; two-tailed unpaired Student<apos;>s t test, p = 0.0012, ****p < 0.0001. (C) Analyses of Figure 11D shows that pridopidine treatment increased the nuclear TFEB protein expression and decreased the cytoplasmic TFEB caused by the GFP-(G4C2)31. Quantitative data are means ± SEM; N = 3; two-tailed unpaired Student<apos;>s t test, p = 0.0050 (cytoplasmic TFEB), p = 0.0011 (nuclear TFEB), ** p < 0.01.
Figure 13.
Figure 13.
(G4C2)31-RNA repeats reduced Lamp1 level; (G4C2)106- and (G4C2)288-RNA repeats attenuate POM121 expression and exacerbated lethality in H2O2-treated NSC34 cells. (A) and (B) Overexpression of (G4C2)31-RNA repeat reduced the lysosomal marker LAMP1/Lamp1 at the protein expression level and the mRNA level in NSC34 cells. Data represent means ± SEM; N = 3; two-tailed unpaired Student<apos;>s t test, p = 0.0281 *p < 0.05 (for LAMP1 protein expression) and p = 0.0011 (for Lamp1 mRNA level), **p < 0.01. (C) Longer RNA repeats (G4C2)106 and (G4C2)288 both significantly decreased POM121 protein expression. (D) Quantification of data from (C) showed statistically significant difference. Data are/ presented as means ± SEM; N = 3; One-way ANOVA with Dunnett<apos;>s multiple comparison test, F(2,6) = 18.40, p = 0.0028; p = 0.0372, *p < 0.05 (for control and (G4C2)106-RNA repeat); p = 0.0016, **p < 0.01 (for control and (G4C2)288-RNA repeat). (E) (G4C2)288-RNA repeat promoted H2O2-induced NSC34 cell death. Data are presented as means ± SEM; N = 3; Two-way ANOVA with Tukey<apos;>s multiple comparison test, Interaction: F(2,12) = 17.55, p = 0.0003; H2O2: F(1,12) = 1457, p < 0.0001; G4C2: F(2,12) = 5.512, p = 0.0200, p < 0.05; ####p < 0.0001 (for control and H2O2); p = 0.0429, *p < 0.05 (for control+H2O2 and (G4C2)288-RNA repeat+ H2O2). (F) Pridopidine treatment reverses the H2O2 toxicity in (G4C2)288-RNA repeats-treated NSC34 cells. Data are presented as means ± SEM; N = 3; two-tailed unpaired Student<apos;>s t test, p = 0.0003, ***p < 0.001.
Figure 14.
Figure 14.
Schematic illustration of the model of the signaling mechanism. SIGMAR1/Sigma-1 receptor translocates from the endoplasmic reticulum (ER) to nuclear membrane when cells are under stressful conditions [83]. (A) When motor neurons are under the insult of toxic (G4C2)RNA repeats upon their nuclear pore proteins [13], POM121 cannot recruit KPNB1/importinβ1 for the nuclear import of transcription factor TFEB. (B) Sensing such an insult by (G4C2)RNA repeats through an as yet unknown mechanism, SIGMAR1/Sigma-1 receptor proteins move to the nuclear pore to chaperone POM121 to restore its recruitment of KPNB1/importinβ1 for a proper nucleus-inbound cargo transport of TFEB to initiate autophagy for survival of neuron. The SIGMAR1/Sigma-1 receptor agonist pridopidine facilitates this action of SIGMAR1/Sigma-1 receptor.

References

    1. DeJesus-Hernandez M, Mackenzie IR, Boeve BF, et al. Expanded GGGGCC hexanucleotide repeat in noncoding region of C9ORF72 causes chromosome 9p-linked FTD and ALS. Neuron. 2011;72(2):245–256. DOI:10.1016/j.neuron.2011.09.011. - DOI - PMC - PubMed
    1. Renton AE, Majounie E, Waite A, et al. A hexanucleotide repeat expansion in C9ORF72 is the cause of chromosome 9p21-linked ALS-FTD. Neuron. 2011;72(2):257–268. DOI:10.1016/j.neuron.2011.09.010. - DOI - PMC - PubMed
    1. Haeusler AR, Donnelly CJ, Periz G, et al. C9orf72 nucleotide repeat structures initiate molecular cascades of disease. Nature. 2014;507(7491):195–200. DOI:10.1038/nature13124. - DOI - PMC - PubMed
    1. Rossi S, Serrano A, Gerbino V, et al. Nuclear accumulation of mRNAs underlies G4C2-repeat-induced translational repression in a cellular model of C9orf72 ALS. J Cell Sci. 2015;128(9):1787–1799. DOI:10.1242/jcs.165332. - DOI - PubMed
    1. Freibaum BD, Lu Y, Lopez-Gonzalez R, et al. GGGGCC repeat expansion in C9orf72 compromises nucleocytoplasmic transport. Nature. 2015;525(7567):129–133. DOI:10.1038/nature14974. - DOI - PMC - PubMed

Publication types