. 2022 Jun 1;127(6):1547-1563.
doi: 10.1152/jn.00164.2021. Epub 2022 May 4.

Visual cortex responds to sound onset and offset during passive listening

Affiliations

Visual cortex responds to sound onset and offset during passive listening

David Brang et al. J Neurophysiol. .

Abstract

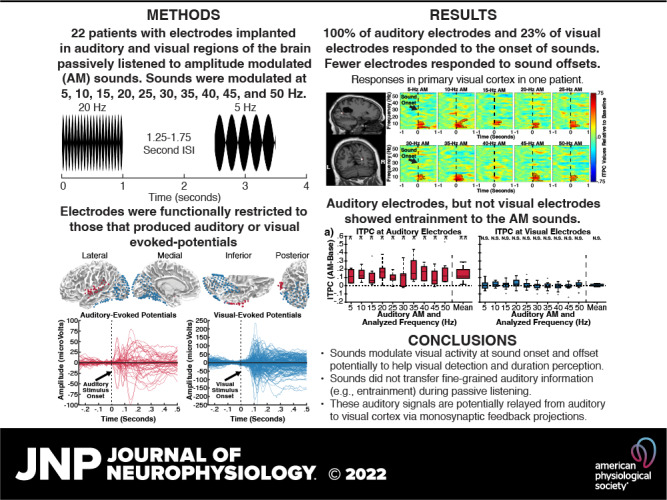
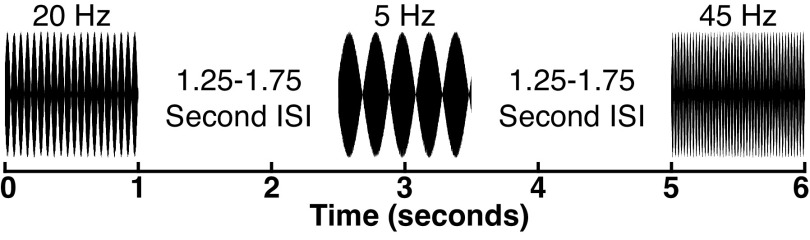
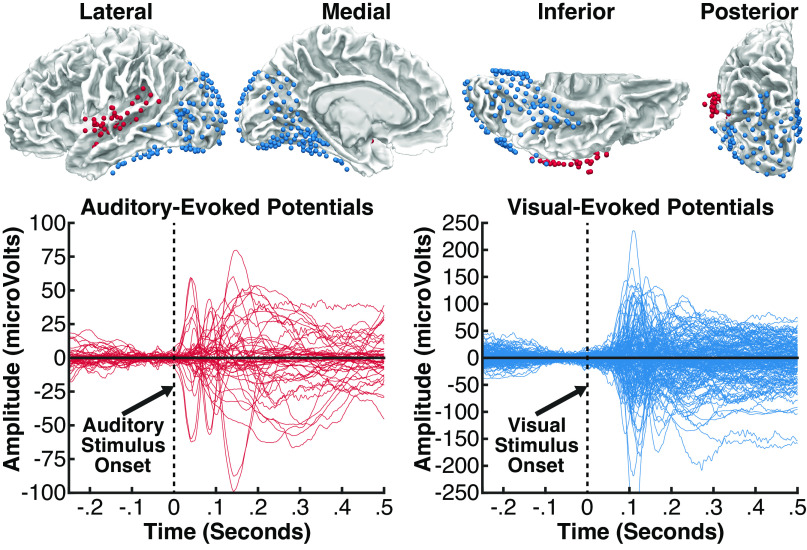
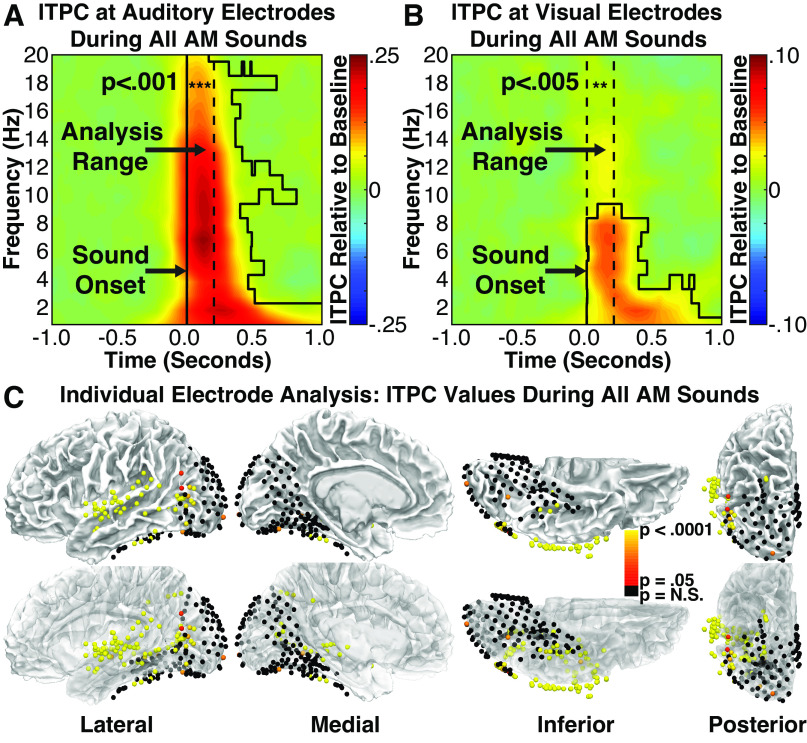
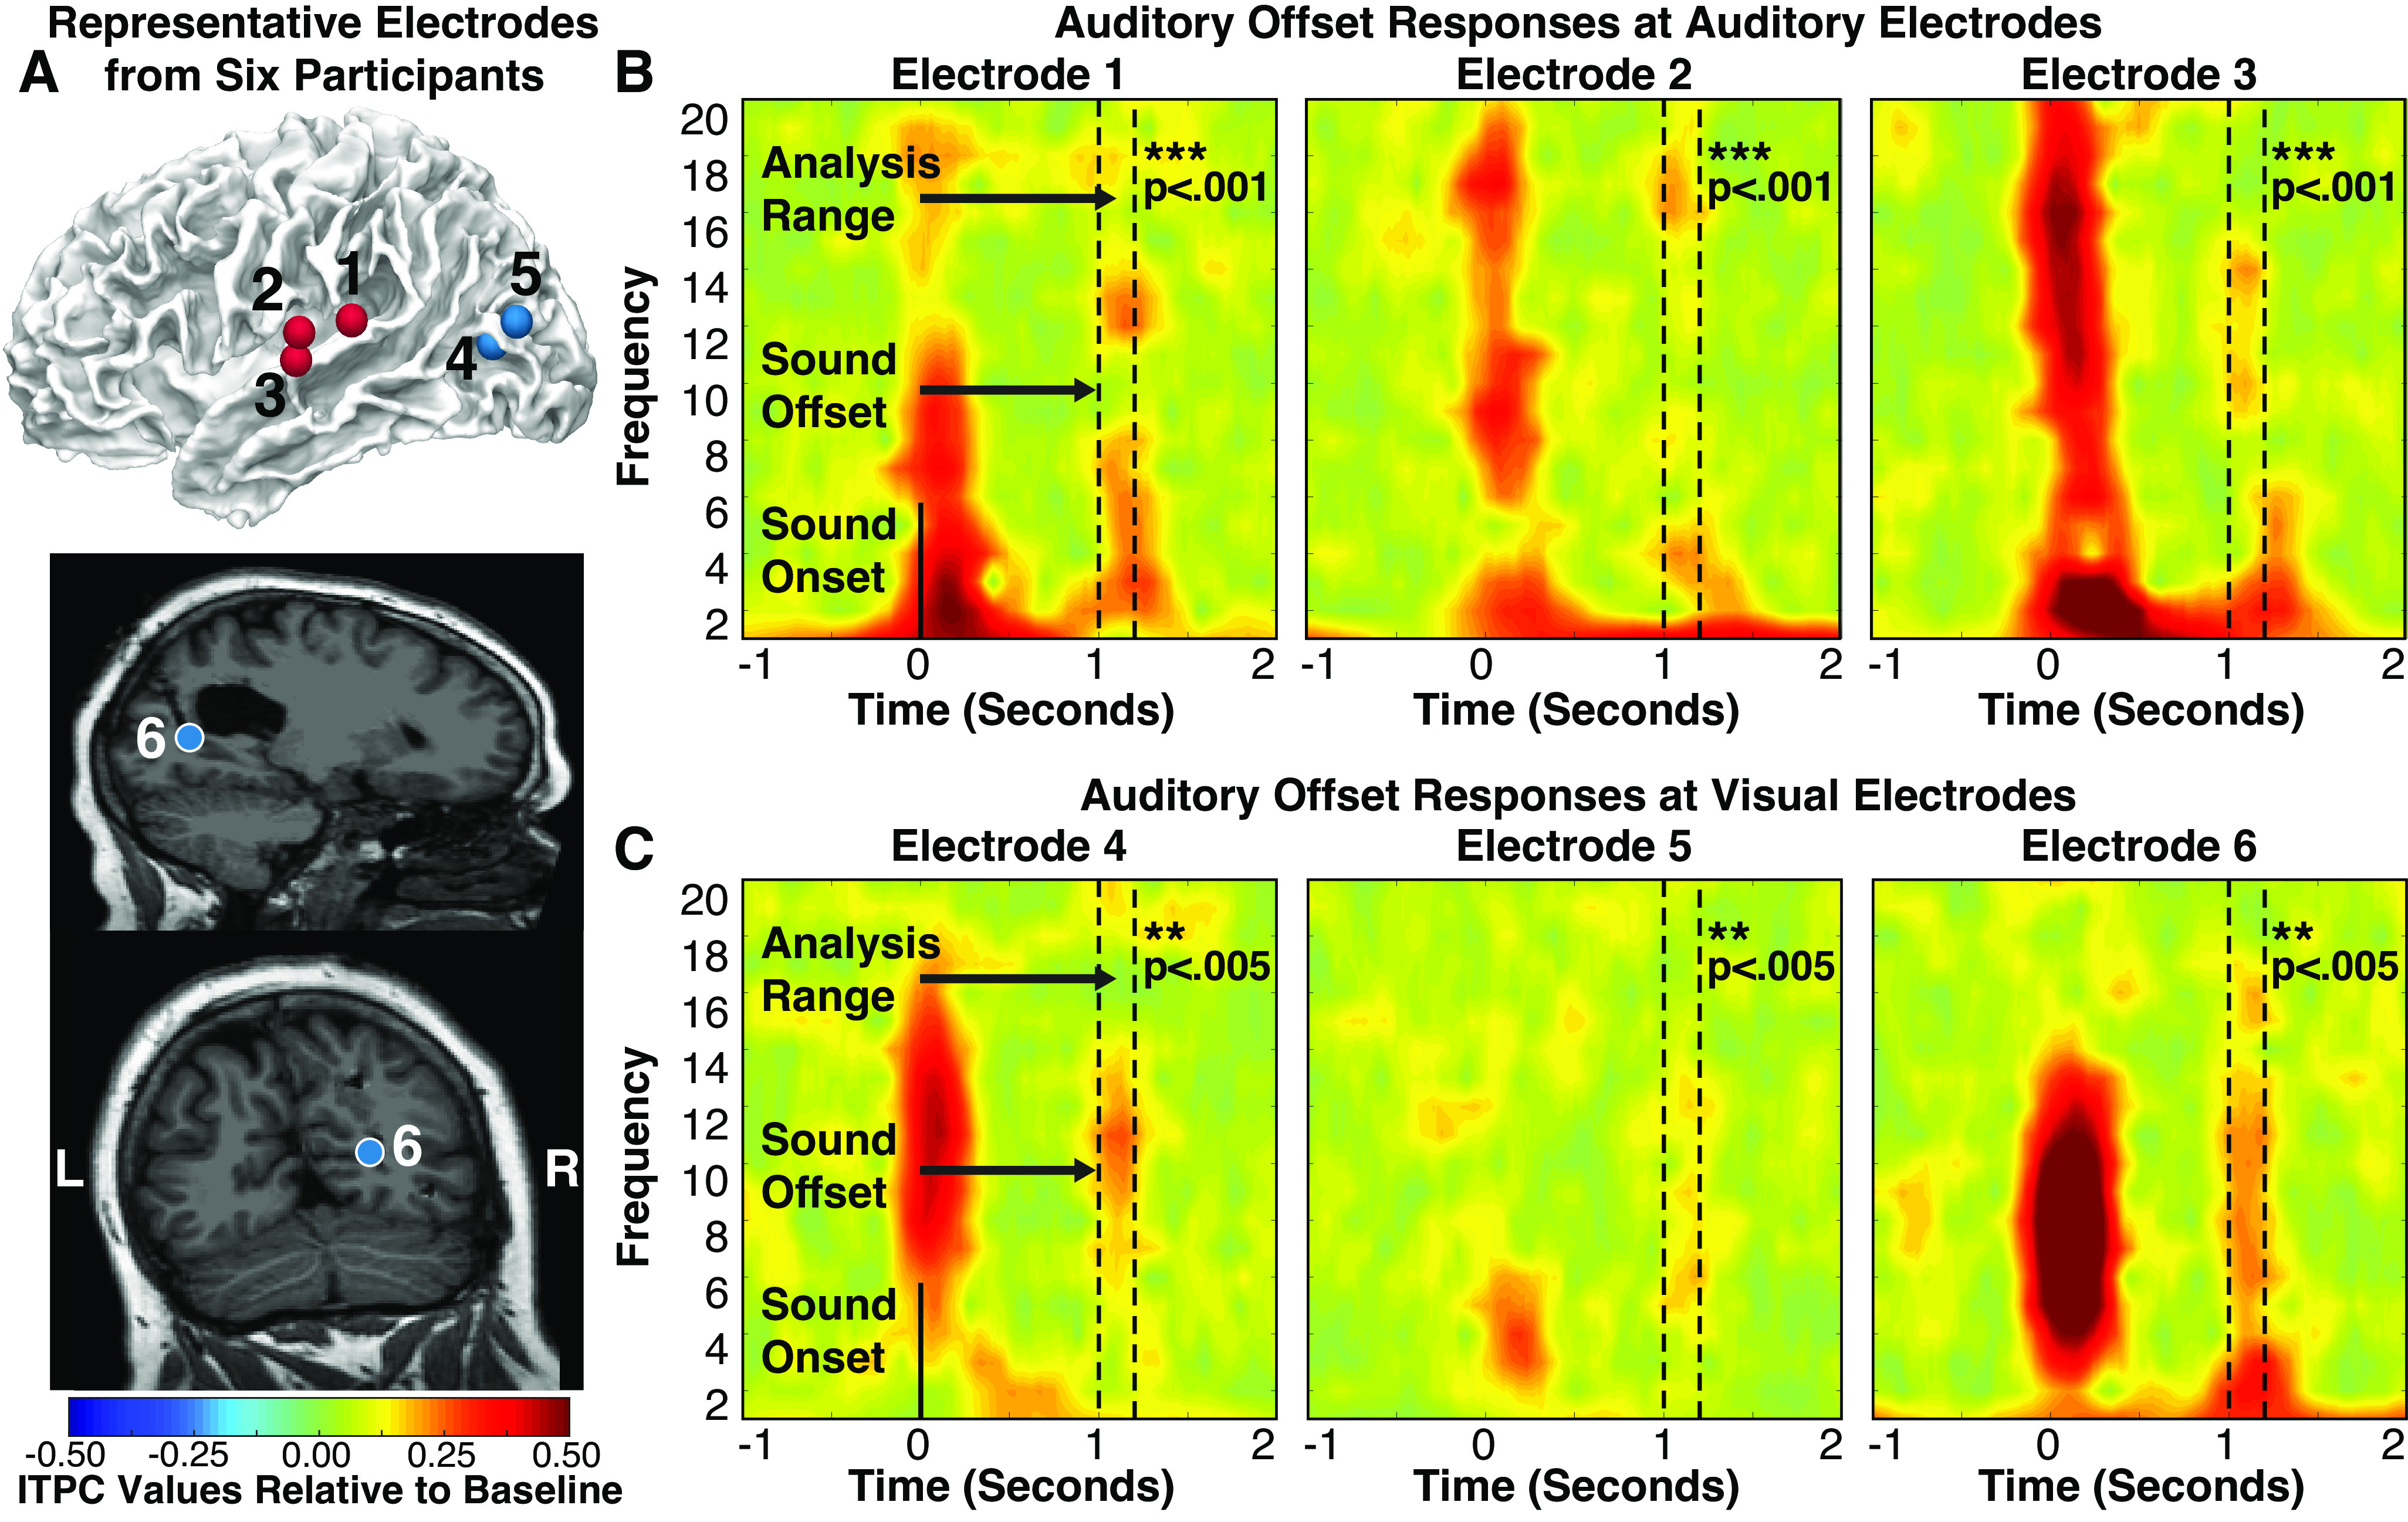
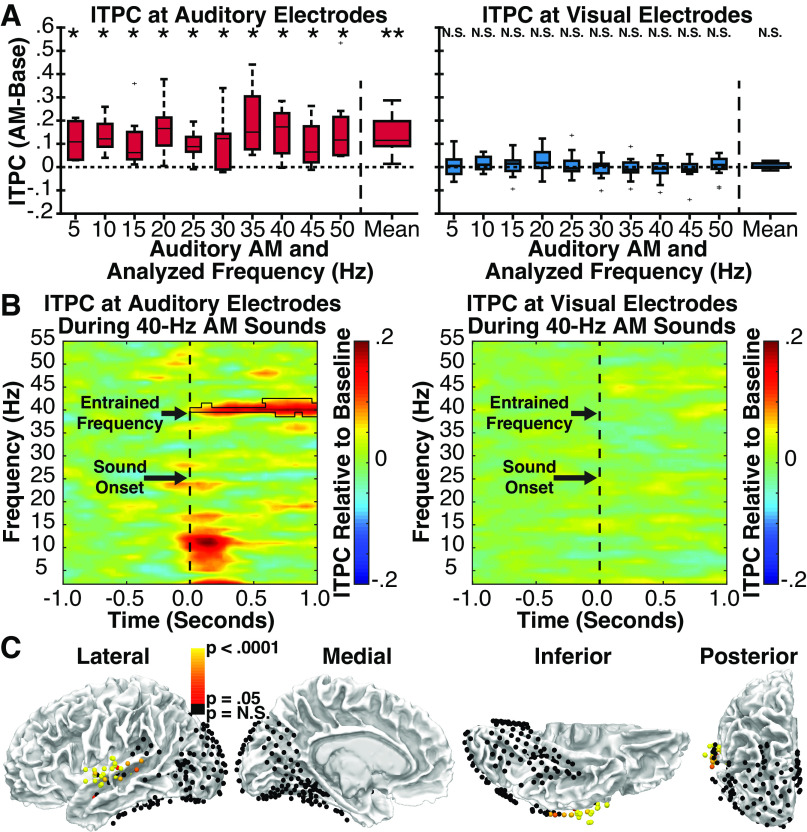
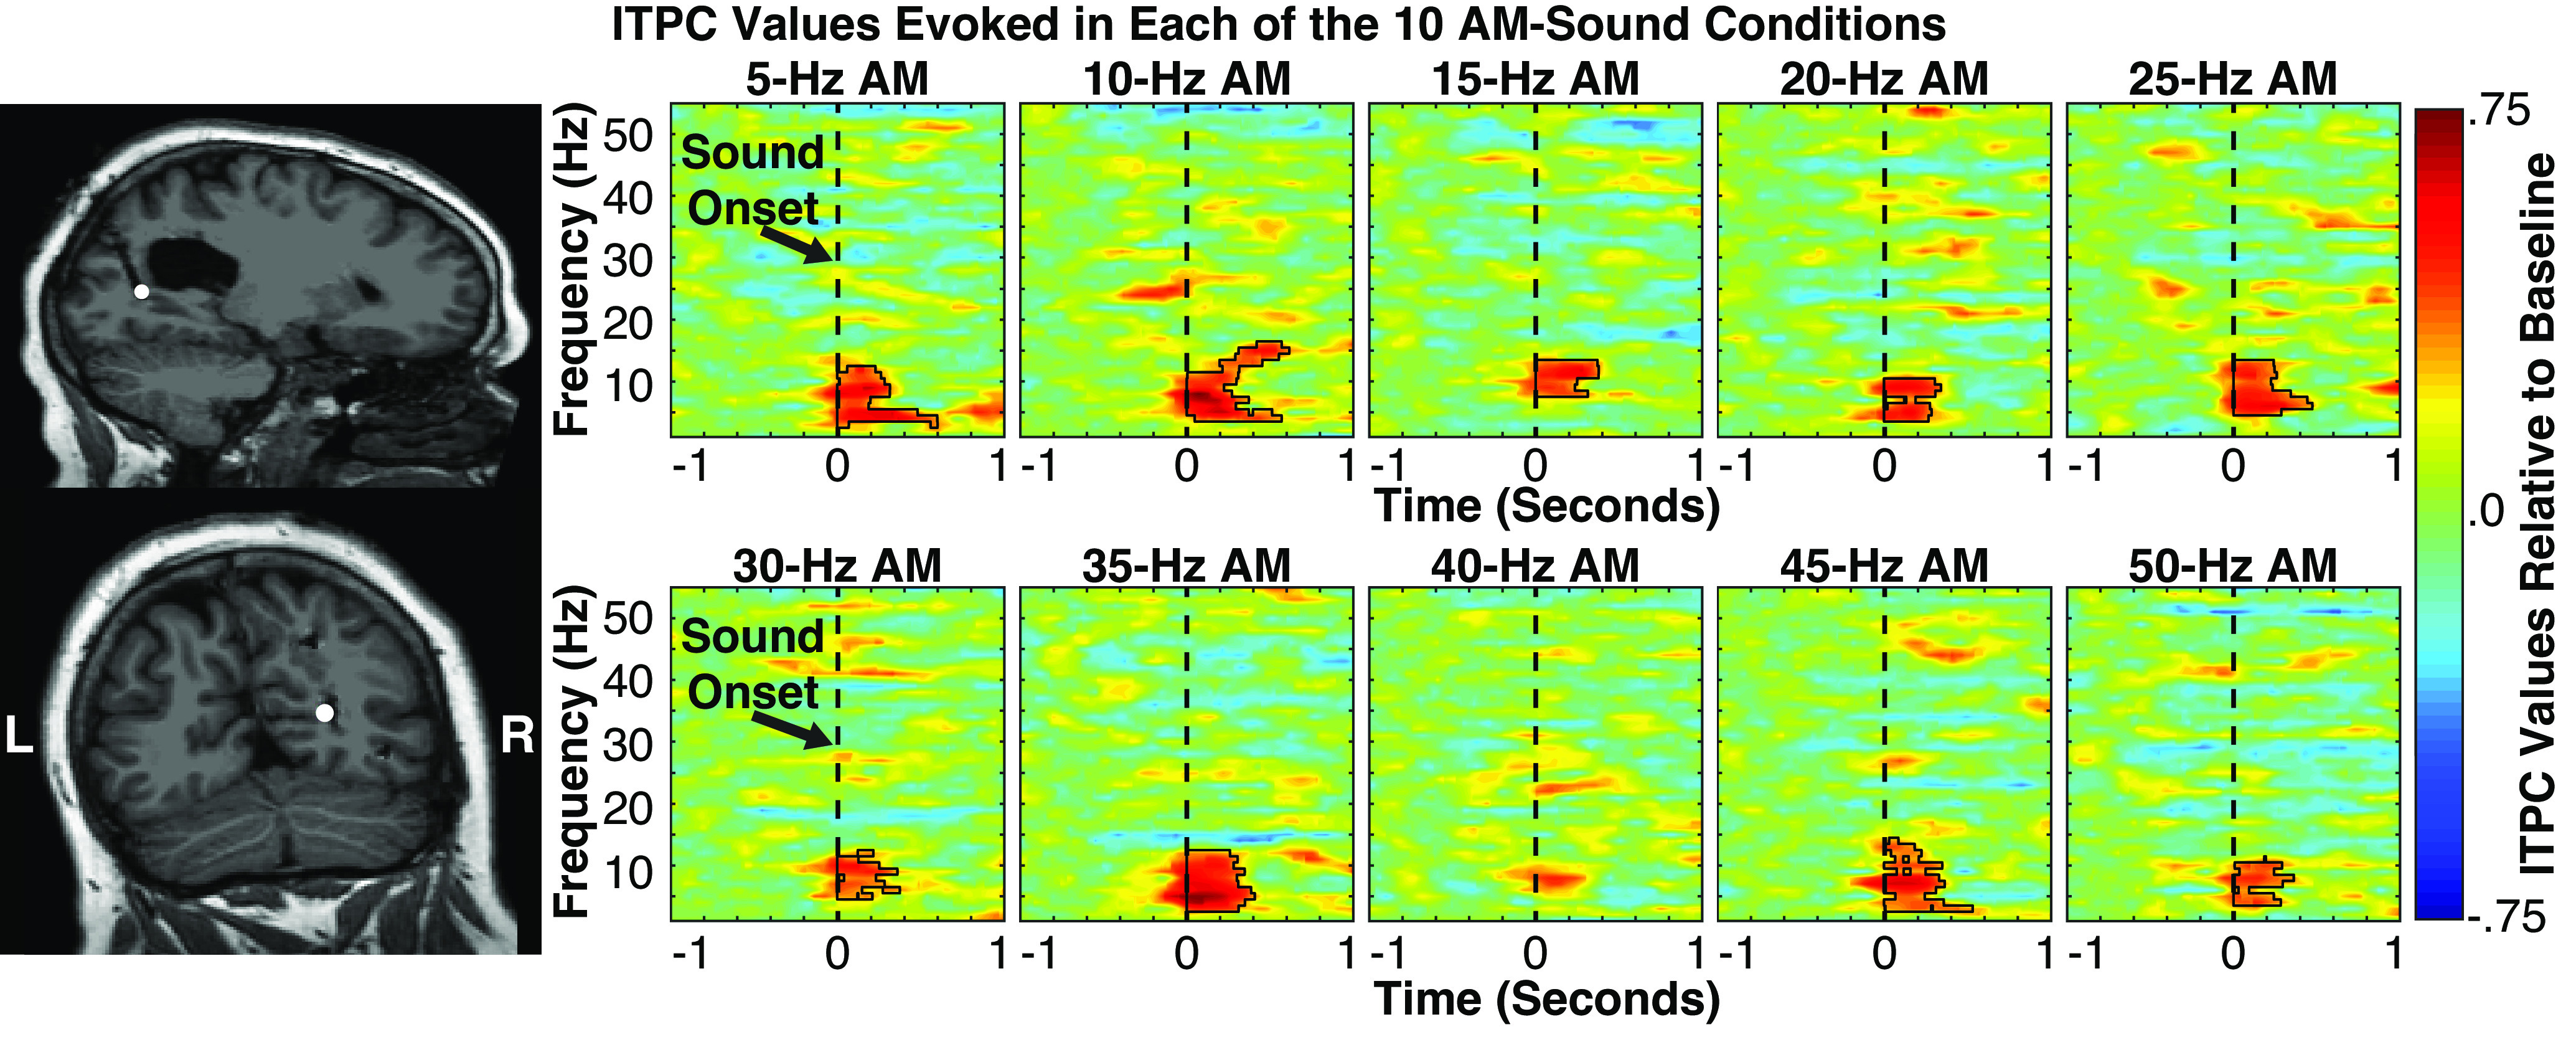
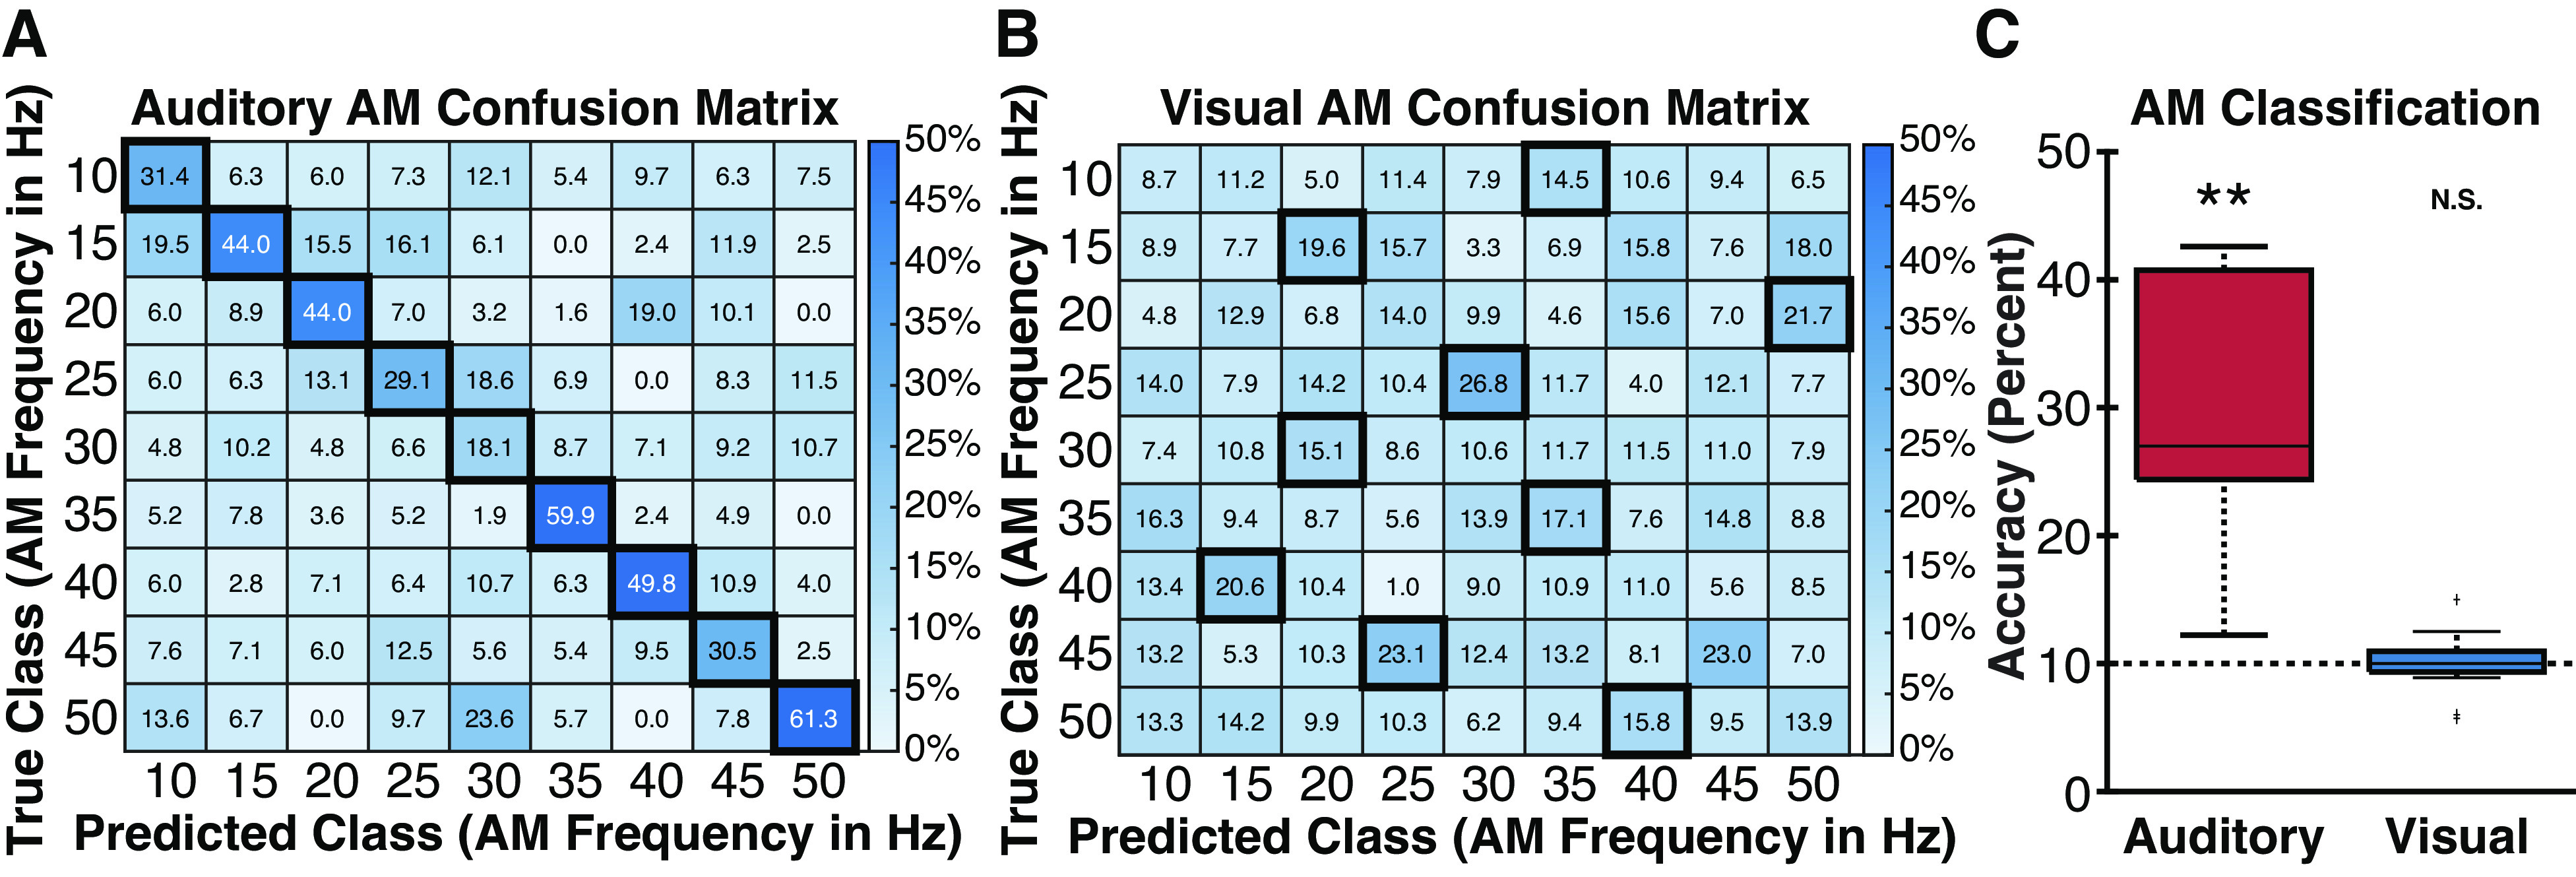
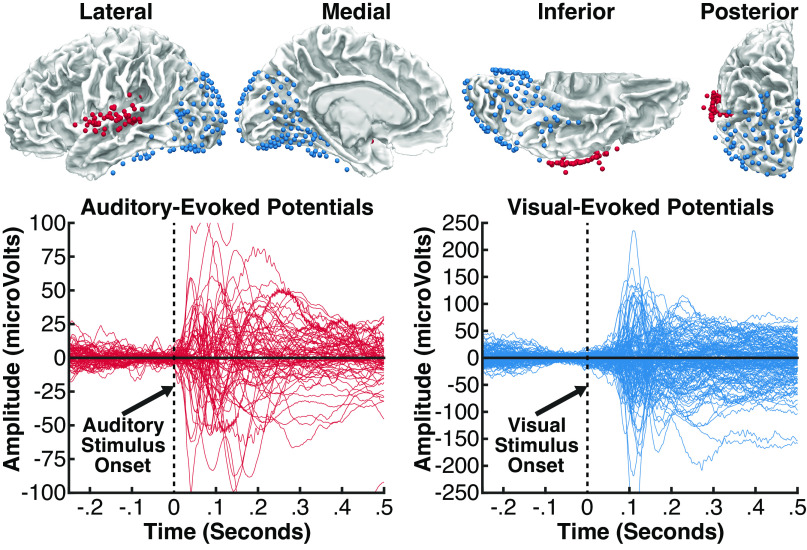
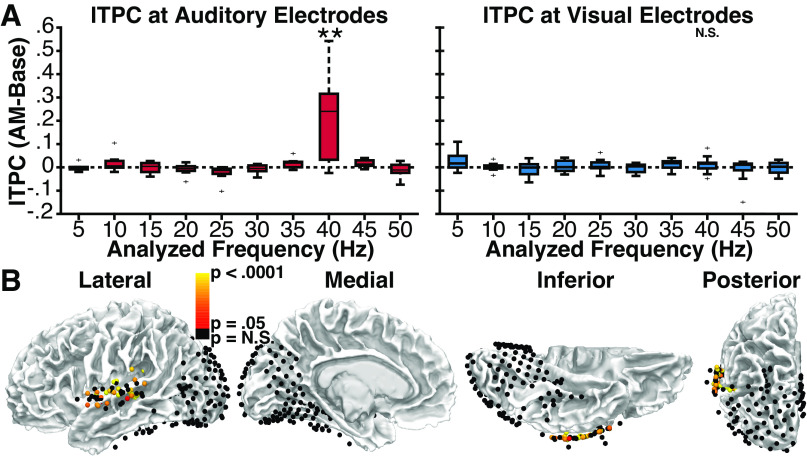
Sounds enhance our ability to detect, localize, and respond to co-occurring visual targets. Research suggests that sounds improve visual processing by resetting the phase of ongoing oscillations in visual cortex. However, it remains unclear what information is relayed from the auditory system to visual areas and if sounds modulate visual activity even in the absence of visual stimuli (e.g., during passive listening). Using intracranial electroencephalography (iEEG) in humans, we examined the sensitivity of visual cortex to three forms of auditory information during a passive listening task: auditory onset responses, auditory offset responses, and rhythmic entrainment to sounds. Because some auditory neurons respond to both sound onsets and offsets, visual timing and duration processing may benefit from each. In addition, if auditory entrainment information is relayed to visual cortex, it could support the processing of complex stimulus dynamics that are aligned between auditory and visual stimuli. Results demonstrate that in visual cortex, amplitude-modulated sounds elicited transient onset and offset responses in multiple areas, but no entrainment to sound modulation frequencies. These findings suggest that activity in visual cortex (as measured with iEEG in response to auditory stimuli) may not be affected by temporally fine-grained auditory stimulus dynamics during passive listening (though it remains possible that this signal may be observable with simultaneous auditory-visual stimuli). Moreover, auditory responses were maximal in low-level visual cortex, potentially implicating a direct pathway for rapid interactions between auditory and visual cortices. This mechanism may facilitate perception by time-locking visual computations to environmental events marked by auditory discontinuities.NEW & NOTEWORTHY Using intracranial electroencephalography (iEEG) in humans during a passive listening task, we demonstrate that sounds modulate activity in visual cortex at both the onset and offset of sounds, which likely supports visual timing and duration processing. However, more complex auditory rate information did not affect visual activity. These findings are based on one of the largest multisensory iEEG studies to date and reveal the type of information transmitted between auditory and visual regions.

Keywords: ECoG; amplitude modulation; audiovisual; multisensory; phase reset.


Conflict of interest statement

No conflicts of interest, financial or otherwise, are declared by the authors.

Figures

None
Graphical abstract
Figure 1.
Figure 1.
Schematic of experiment 1 passive listening task, showing three example amplitude-modulated (AM) sounds at different AM frequencies. ISI, intersound interval.
Figure 2.
Figure 2.
Top: intracranial electrodes from 16 patients, displayed on an average brain (all electrodes projected into the left hemisphere). Each colored sphere reflects a single electrode contact included in analyses, localized in auditory areas (red, 55 electrodes) or visual areas (blue, 178 electrodes). Auditory electrodes were limited to those located proximal to the superior temporal gyrus or neighboring white matter and showing a significant event-related potential (ERP) to sounds beginning at less than 120 ms. Visual electrodes were limited to those located in occipital, parietal, or inferior temporal areas and showing a significant ERP to visual stimuli beginning at less than 120 ms. Bottom: ERP responses at all auditory electrodes (red) evoked during an auditory task, and at all visual electrodes (blue) evoked during a visual task; the time zero indicates stimulus onset in each task.
Figure 3.
Figure 3.
Group intertrial phase coherence (ITPC) time-spectral plots for auditory (A) and visual (B) electrodes during the average of all amplitude-modulated (AM) sound conditions. Dotted lines denote analyzed time-frequency range. Relative to the prestimulus baseline period, significantly greater ITPC values were present at low frequencies for both auditory and visual electrodes, highlighting the presence of an auditory-driven transient phase reset to the onset of AM sounds at auditory and visual areas. Black polygon shapes highlight significant times and frequencies using cluster-corrected statistics (P < 0.05). C: auditory and visual electrodes from all patients showing either significant (red to yellow) or nonsignificant (black) ITPC values during the average of all AM sound conditions. Significant electrodes cluster around the central superior temporal gyrus, proximal to auditory cortex, and are additionally broadly distributed throughout visual areas, most strongly at pericalcarine and occipitotemporal areas (potentially V5/hMT+). The bottom row of images reflects the same data on partially transparent brains to show statistics from electrodes not visible at the surface.
Figure 4.
Figure 4.
A: representative electrodes (auditory electrodes are red, visual electrodes are blue) from six participants that showed significant intertrial phase coherence (ITPC) responses (after correcting for multiple comparisons) at the offset of sounds. Auditory electrodes (left) and visual (right) electrodes during the average of all amplitude-modulated (AM) sound conditions. Dotted lines denote analyzed time-frequency range. Individual participant ITPC plots at selected auditory (B) and visual (C) electrodes. AM sound onset occurred at 0 s and offset at 1 s. Each electrode shows both onset and offset responses.
Figure 5.
Figure 5.
Experiment 1. A: group-level analysis of intertrial phase coherence (ITPC) at auditory (left) and visual (right) electrodes in response to amplitude-modulated (AM) sounds relative to ITPC values in the prestimulus baseline period. Individual bars reflect auditory AM rate and matched analysis frequency. Center line indicates median; box limits, upper and lower quartiles; whiskers, 1.5 times interquartile range; points, outliers.*P < 0.05, **P < 0.005 (corrected for multiple comparisons). Error bars reflect SEM. B: group ITPC time-spectral plots for auditory (left) and visual (right) electrodes during a representative AM sound condition (40 Hz). Black polygon denotes p < 0.05 significance (corrected for multiple comparisons). Significant entrainment is present at 40 Hz only for auditory electrodes. C: auditory and visual electrodes from all patients showing either significant (red to white) or nonsignificant (black) ITPC values during the presentation of AM sounds relative to phase-shuffled data, reflecting neural entrainment to the auditory stimulus. Significant electrodes cluster around the central superior temporal gyrus, proximal to auditory cortex, and are noticeably absent from visual areas.
Figure 6.
Figure 6.
Left: sole visually selective intracranial electrode (represented by white disk on patients’ postoperative MRI) showing significant intertrial phase coherence (ITPC) values (following correction for multiple comparisons) in neural entrainment analyses. Electrode was localized to the anterior portion of the calcarine sulcus in the right hemisphere, probabilistically mapped to either V1 or V2. Right: spectral-temporal plots showing ITPC values evoked at this electrode in each of the 10 amplitude-modulated (AM) sound conditions. Black polygons denote p < 0.005 significance (corrected for multiple comparisons using cluster statistics). Significant ITPC values were evoked transiently in the α frequency range regardless of AM sound, highlighting the presence of a transient phase reset, and absence of AM sound entrainment of visual areas.
Figure 7.
Figure 7.
Group-level intertrial phase coherence (ITPC) classification data. A and B: confusion matrices at auditory and visual electrodes for amplitude-modulated (AM) sounds (10–50 Hz). Colors denote percentage of predicted class labels. Dark boxes reflect the most frequently predicted AM frequency for each true AM frequency. Auditory electrodes show reliable classification of the true AM sound (diagonal of the confusion matrix) whereas visual electrodes fail to reliably classify the diagonal. C: boxplots showing group-level AM classification rates for auditory and visual electrodes for AM sounds (5–50 Hz). Horizontal dotted line reflects chance-level accuracy. **P < 0.01.
Figure 8.
Figure 8.
Experiment 2. Top: intracranial electrodes from 13 patients, displayed on an average brain (all electrodes projected into the left hemisphere). Each colored sphere reflects a single electrode contact included in analyses, localized in auditory areas (red, 73 electrodes) or visual areas (blue, 151 electrodes). Auditory electrodes were limited to those located proximal to the superior temporal gyrus or neighboring white matter and showing a significant event-related potential (ERP) to sounds beginning at less than 120 ms. Visual electrodes were limited to those located in occipital, parietal, or inferior temporal areas and showing a significant ERP to visual stimuli beginning at less than 120 ms. Bottom: ERP responses at all auditory electrodes (red) in evoked during a passive listening task, and at all visual electrodes (blue) evoked during a visual task; the time zero indicates stimulus onset in each task.
Figure 9.
Figure 9.
Experiment 2. A: group-level analysis of intertrial phase coherence (ITPC) at auditory (left) and visual (right) electrodes in response to 40-Hz amplitude-modulated (AM) sounds relative to ITPC values in the prestimulus baseline period. Individual bars reflect ITPC values at various frequencies, highlighting the specificity of auditory entrainment at 40 Hz. Center line indicates median; box limits, upper and lower quartiles; whiskers, 1.5 times interquartile range; points, outliers. **P < 0.01 (non-40-Hz frequencies corrected for multiple comparisons), Error bars reflect SEM. B: auditory and visual electrodes from all patients showing either significant (red to yellow) or nonsignificant (black) ITPC values during the presentation of AM sounds relative to phase-shuffled data, reflecting neural entrainment to the auditory stimulus. Significant electrodes cluster around the central superior temporal gyrus, proximal to auditory cortex, and are noticeably absent from visual areas.

References

    1. Lippert M, Logothetis NK, Kayser C. Improvement of visual contrast detection by a simultaneous sound. Brain Res 1173: 102–109, 2007. doi:10.1016/j.brainres.2007.07.050. - DOI - PubMed
    1. Jaekl PM, Soto-Faraco S. Audiovisual contrast enhancement is articulated primarily via the M-pathway. Brain Res 1366: 85–92, 2010. doi:10.1016/j.brainres.2010.10.012. - DOI - PubMed
    1. Chen Y-C, Huang P-C, Yeh S-L, Spence C. Synchronous sounds enhance visual sensitivity without reducing target uncertainty. Seeing Perceiving 24: 623–638, 2011. doi:10.1163/187847611X603765. - DOI - PubMed
    1. Stein BE, Meredith MA. The Merging of the Senses (1st ed.). Cambridge, MA: The MIT Press, 1993.
    1. Ghazanfar AA, Schroeder CE. Is neocortex essentially multisensory? Trends Cogn Sci 10: 278–285, 2006. doi:10.1016/j.tics.2006.04.008. - DOI - PubMed

Publication types

LinkOut - more resources