. 2022 May 6;8(18):eabm6860.
doi: 10.1126/sciadv.abm6860. Epub 2022 May 4.

The 2021 western North America heat wave among the most extreme events ever recorded globally

Affiliations

The 2021 western North America heat wave among the most extreme events ever recorded globally

Vikki Thompson et al. Sci Adv. .

Abstract

In June 2021, western North America experienced a record-breaking heat wave outside the distribution of previously observed temperatures. While it is clear that the event was extreme, it is not obvious whether other areas in the world have also experienced events so far outside their natural variability. Using a novel assessment of heat extremes, we investigate how extreme this event was in the global context. Characterizing the relative intensity of an event as the number of standard deviations from the mean, the western North America heat wave is remarkable, coming in at over four standard deviations. Throughout the globe, where we have reliable data, only five other heat waves were found to be more extreme since 1960. We find that in both reanalyses and climate projections, the statistical distribution of extremes increases through time, in line with the distribution mean shift due to climate change. Regions that, by chance, have not had a recent extreme heat wave may be less prepared for potentially imminent events.


Figures

Fig. 1.
Fig. 1.. The meteorology of the western North America 2021 heat extreme.
The synoptic pattern and statistics of the heat wave in the western North America for the last week of June and first week of July. (A) Time series plot of observed daily maximum temperatures for the last week of June and first week of July in the region 45°N to 52°N, 119°W to 123°W, from 1950 to present. The time series for individual years in 1950–2020 are shown in black, whereas that for 2021 is shown in red. (B) Distribution of the 1950–2020 temperatures shown in (A). The red line shows the highest maximum temperature in 2021, which happened on 29 June. (C) Scatter plot of geopotential height at 500 hPa (Z500) over the 2-week period 24 June to 7 July versus precipitation minus evaporation (P-E) over June, with both axes showing values averaged over the area of interest. Each dot represents 1 year between 1950 and 2021. The color of the dots indicates the maximum area–averaged daily maximum temperature over the corresponding 2-week period. Triangles indicate the five hottest events, with the triangle in the darkest red color indicating the 2021 event. (D) Northward component of wind at 500 hPa in the Northern Hemisphere, averaged over the same 2-week period in 2021; gray box over western North America indicates the region assessed: 45°N to 52°N, 119°W to 123°W.
Fig. 2.
Fig. 2.. Projected change in the return period of the western North America heat extreme.
The chance of exceeding the current record in any given summer day of a year in each decade. The current record used is 40.1°C, an event with the same magnitude as the June 2021 observed event for the model climatology, for the western North America region of 45°N to 52°N, 119°W to 123°W. Each decade is centered on the value on the x axis, (e.g., 2015–2024). Simulations are from the CanESM5, using three different future scenarios (as labeled) and 50 ensemble members for each scenario. Values are the chance of an event on any given day (JJA) per year. The vertical lines represent the uncertainty, calculated as the range from individual ensemble members.
Fig. 3.
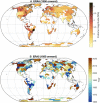
Fig. 3.. Global map of the most extreme observed heat extremes relative to the climate of that period.
Data are taken from ERA5, January 1950 to August 2021. The values are expressed in terms of how many SDs away from the mean temperature the most extreme heat day was, assessed against a moving climatology so that the climate change signal is excluded (see Materials and Methods). The regions are taken from Stone, 2019 (35). (A) SD away from the mean of the greatest historic extreme in each region. (B) Year in which the greatest historic extreme occurred. Regions where there is poor agreement between ERA5 and JRA55 reanalyses are excluded.
Fig. 4.
Fig. 4.. Historical and projected changes to temperature extremes.
(A) Percentage of regions around the globe experiencing events each year above the specified thresholds of 1 to 5 SDs above the mean, calculated against the 1981–2010 historical baseline climatology for ERA5 (bold lines) and 50 ensemble members of the CanESM5, SSP585 (multiple thinner lines). (B) Same as (A), but calculated against a moving climatology of the decade before the year assessed to account for the climate change signal. As with Fig. 3, regions with poor agreement between ERA5 and JRA55 have been excluded in both ERA5 and CanESM5.

References

    1. IPCC, Summary for policymakers, in Climate Change 2021: The Physical Science Basis. Contribution of Working Group I to the Sixth Assessment Report of the Intergovernmental Panel on Climate Change, V. Masson-Delmotte, P. Zhai, A. Pirani, S. L. Connors, C. Péan, S. Berger, N. Caud, Y. Chen, L. Goldfarb, M. I. Gomis, M. Huang, K. Leitzell, E. Lonnoy, J. B. R. Matthews, T. K. Maycock, T. Waterfield, O. Yelekçi, R. Yu, B. Zhou, Eds. (Cambridge Univ. Press, 2021).
    1. Ebi K. L., Capon A., Berry P., Broderick C., de Dear R., Havenith G., Honda Y., Kovats R. S., Ma W., Malik A., Morris N. B., Nybo L., Seneviratne S. I., Vanos J., Jay O., Hot weather and heat extremes: Health risks. Lancet 398, 698–708 (2021). - PubMed
    1. Vicedo-Cabrera A. M., Guo Y., Sera F., Huber V., Schleussner C. F., Mitchell D., Tong S., de Sousa Zanotti Stagliorio Coelho M., Saldiva P. H. N., Lavigne E., Correa P. M., Ortega N. V., Kan H., Osorio S., Kyselý J., Urban A., Jaakkola J. J. K., Ryti N. R. I., Pascal M., Goodman P. G., Zeka A., Michelozzi P., Scortichini M., Hashizume M., Honda Y., Hurtado-Diaz M., Cruz J., Seposo X., Kim H., Tobias A., Íñiguez C., Forsberg B., Åström D. O., Ragettli M. S., Röösli M., Guo Y. L., Wu C. F., Zanobetti A., Schwartz J., Bell M. L., Dang T. N., van D., Heaviside C., Vardoulakis S., Hajat S., Haines A., Armstrong B., Ebi K. L., Gasparrini A., Temperature-related mortality impacts under and beyond Paris agreement climate change scenarios. Clim. Change 150, 391–402 (2018). - PMC - PubMed
    1. Christidis N., Jones G. S., Stott P. A., Dramatically increasing chance of extremely hot summers since the 2003 European heatwave. Nat. Clim. Chang. 5, 46–50 (2015).
    1. Perkins-Kirkpatrick S. E., Lewis S. C., Increasing trends in regional heatwaves. Nat. Commun. 11, 1–8 (2020). - PMC - PubMed