. 2022 Jul;67(1):61-75.
doi: 10.1165/rcmb.2021-0415OC.

Mesenchymal Stem Cell-derived Nanovesicles as a Credible Agent for Therapy of Pulmonary Hypertension

Affiliations

Mesenchymal Stem Cell-derived Nanovesicles as a Credible Agent for Therapy of Pulmonary Hypertension

Li Hu et al. Am J Respir Cell Mol Biol. 2022 Jul.

Abstract

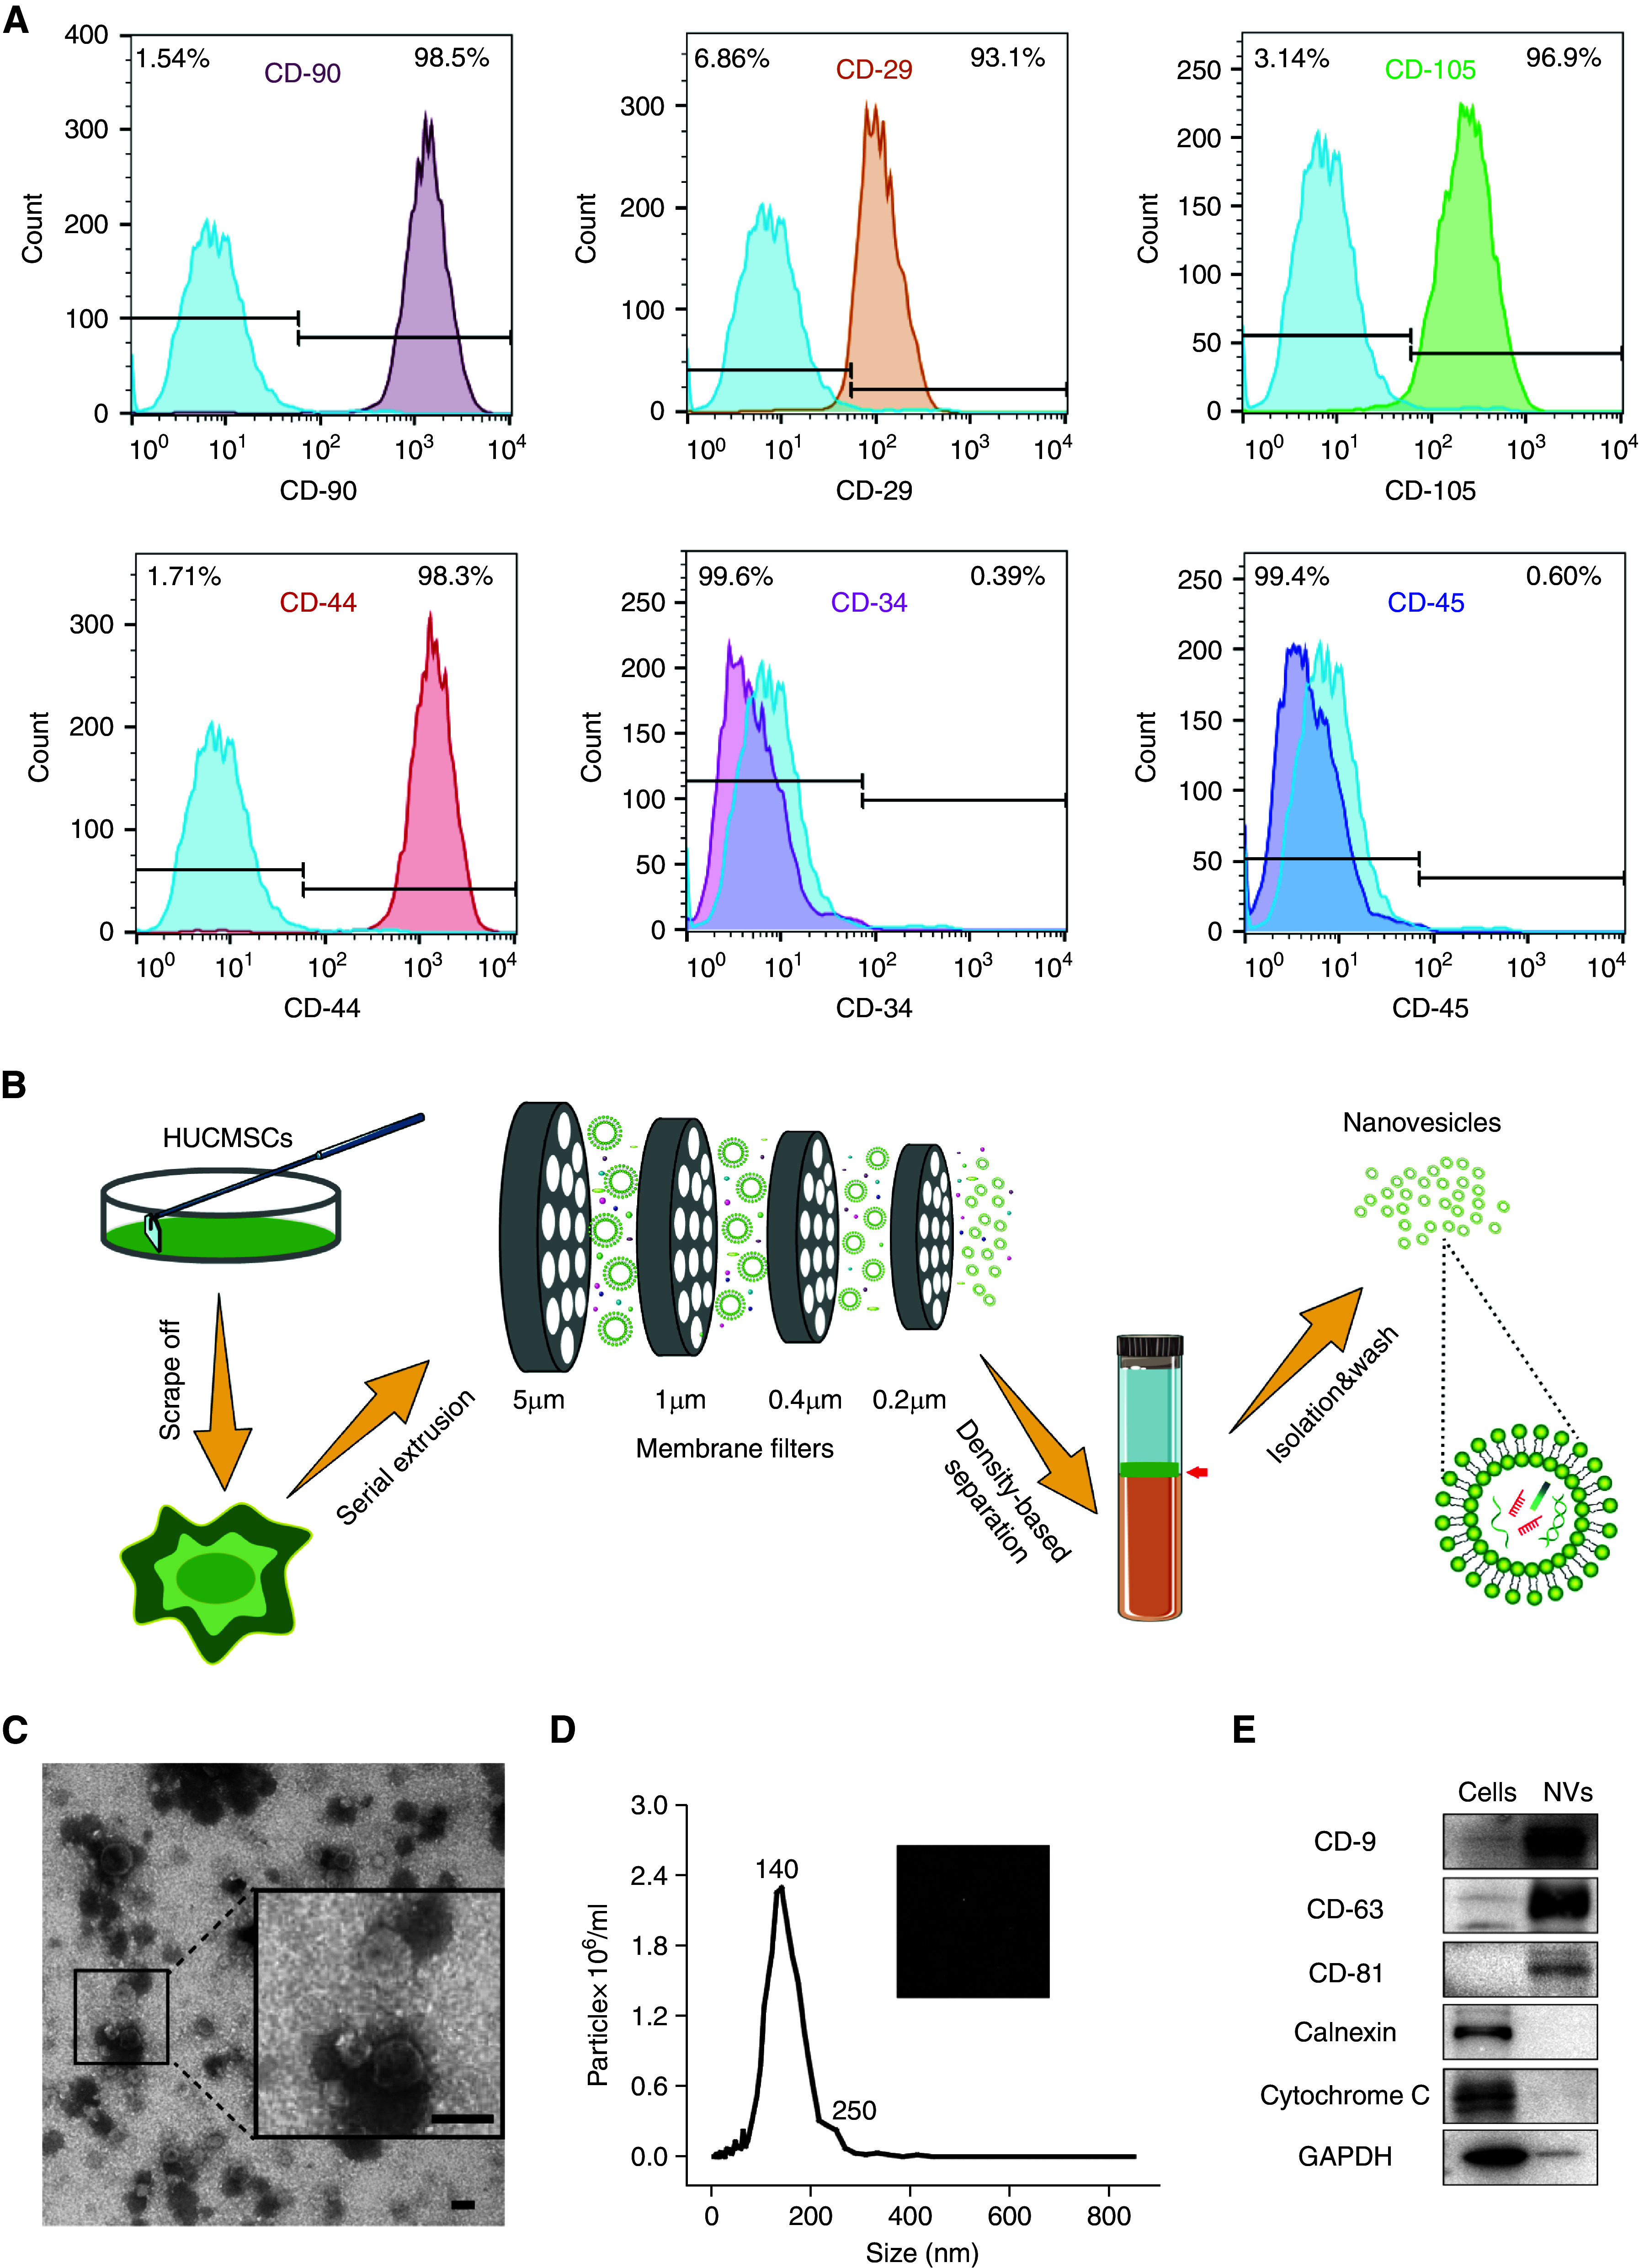
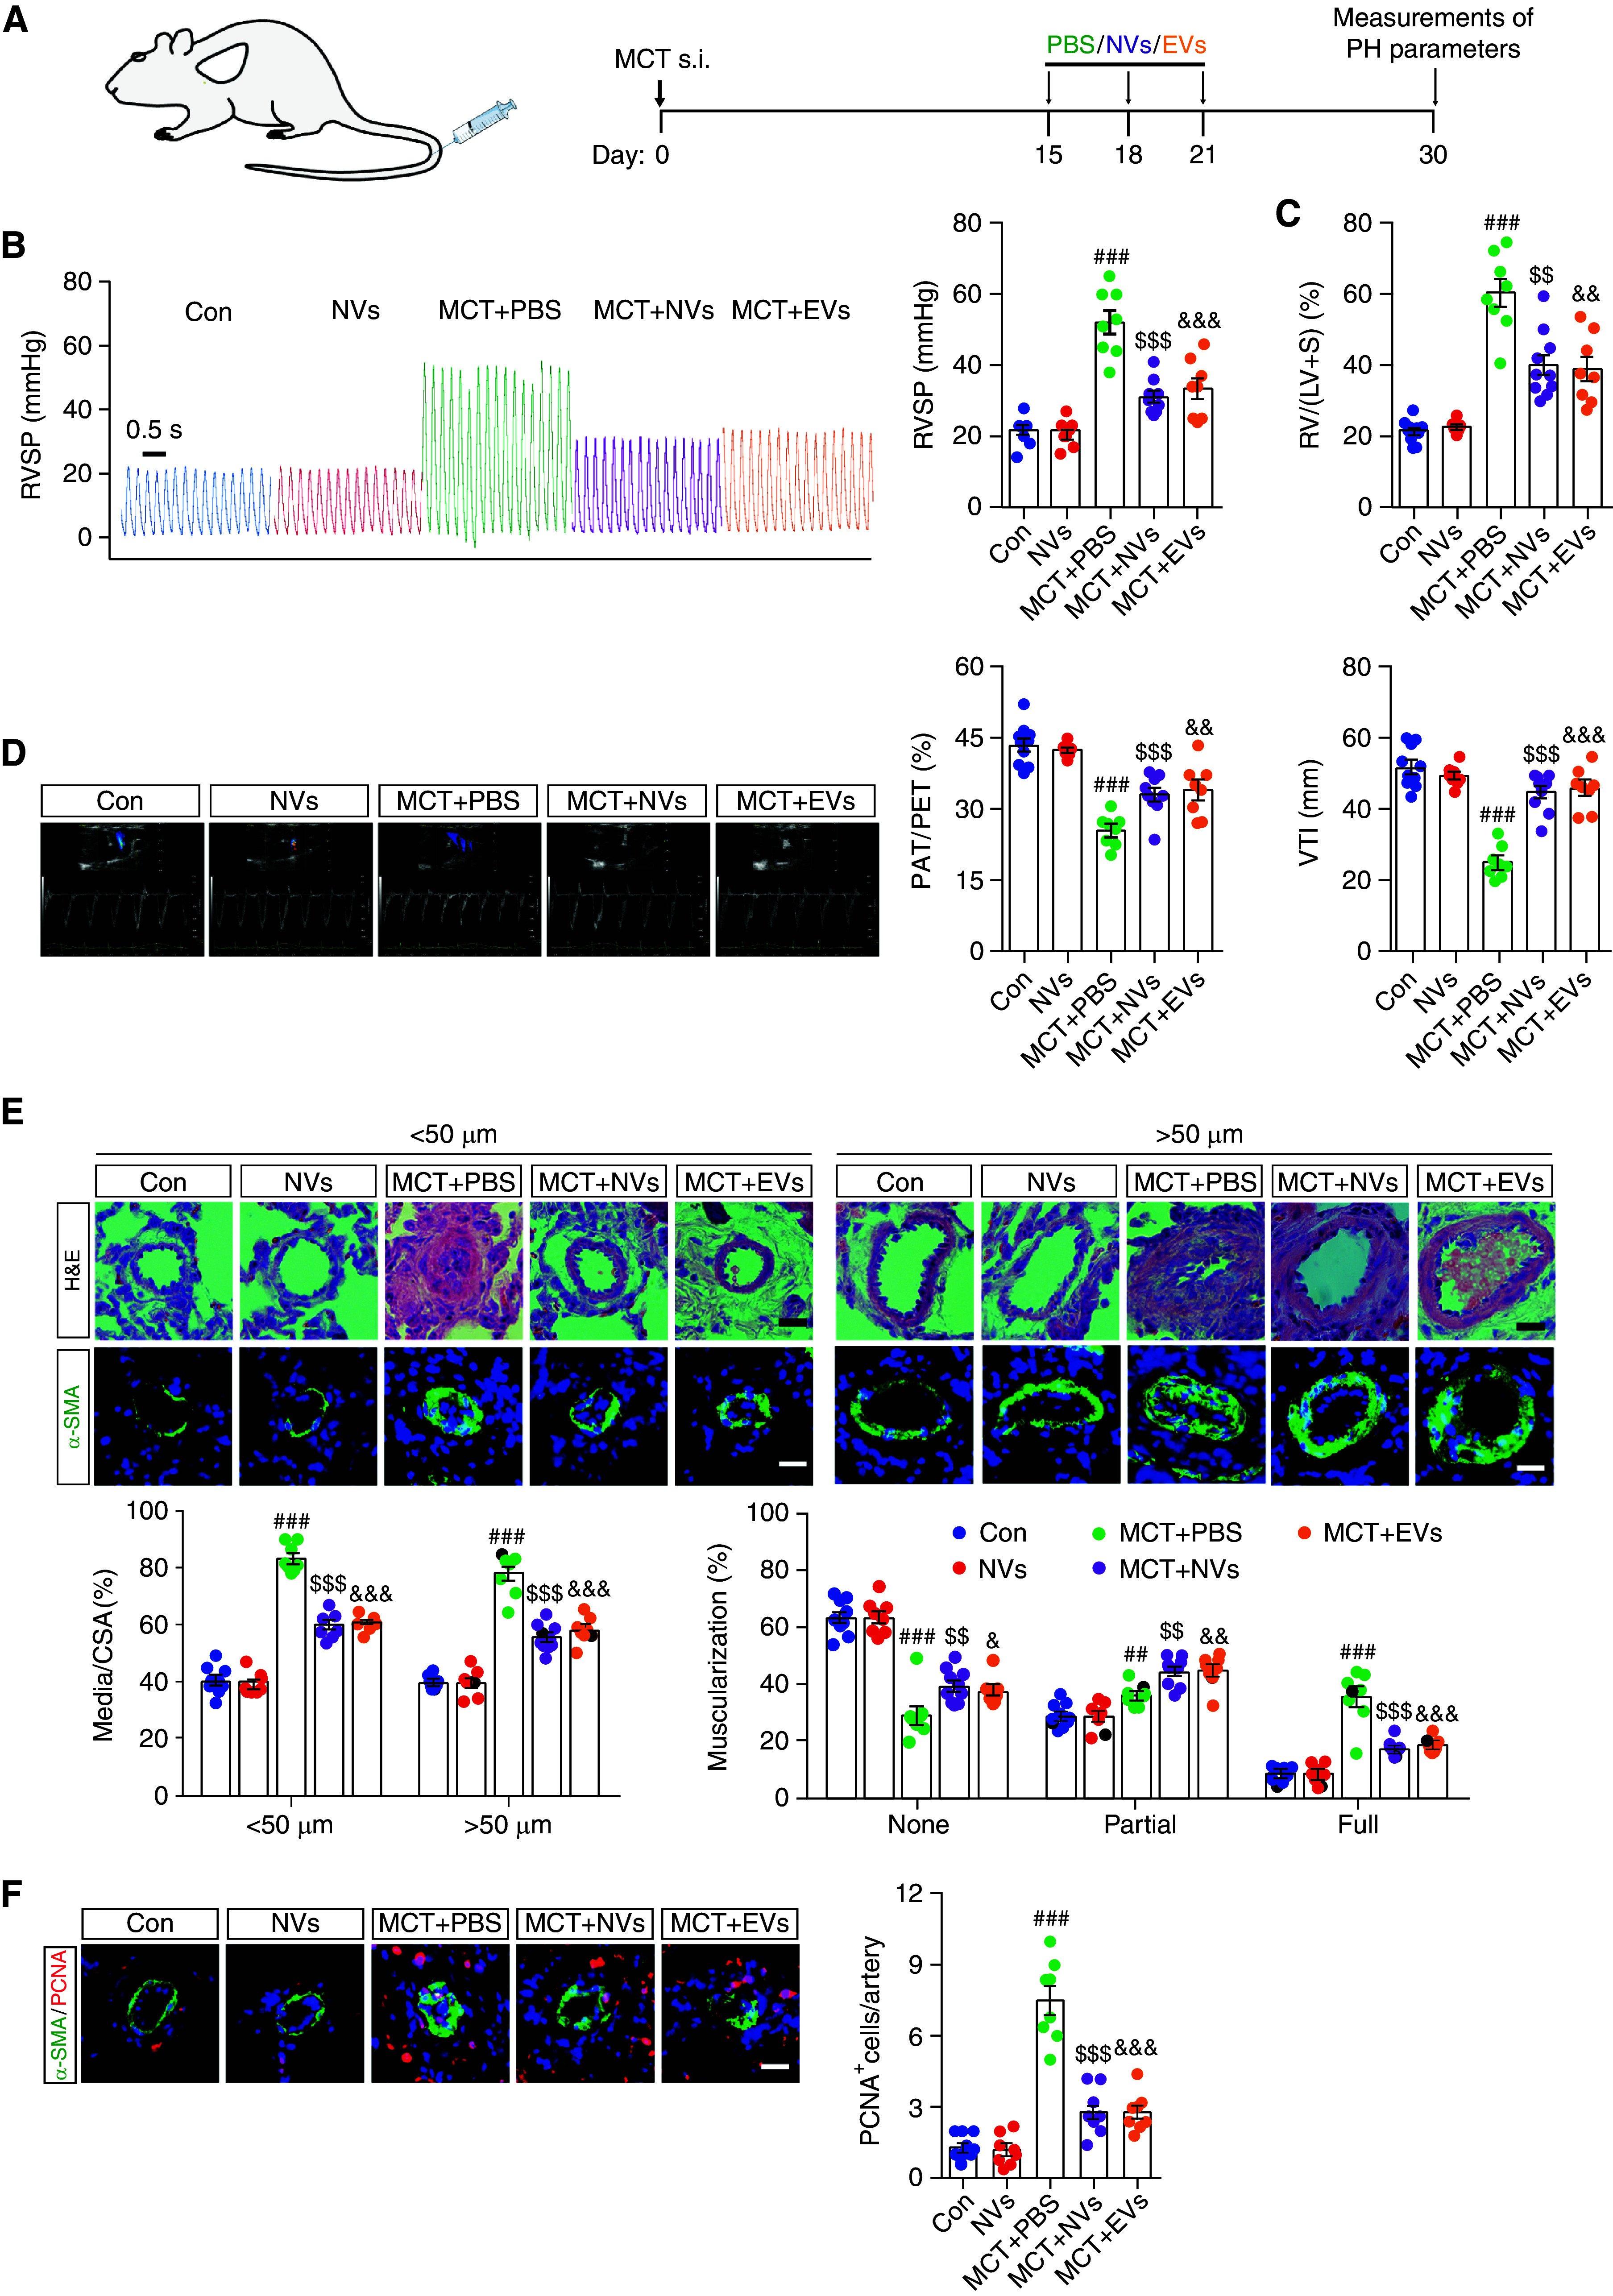
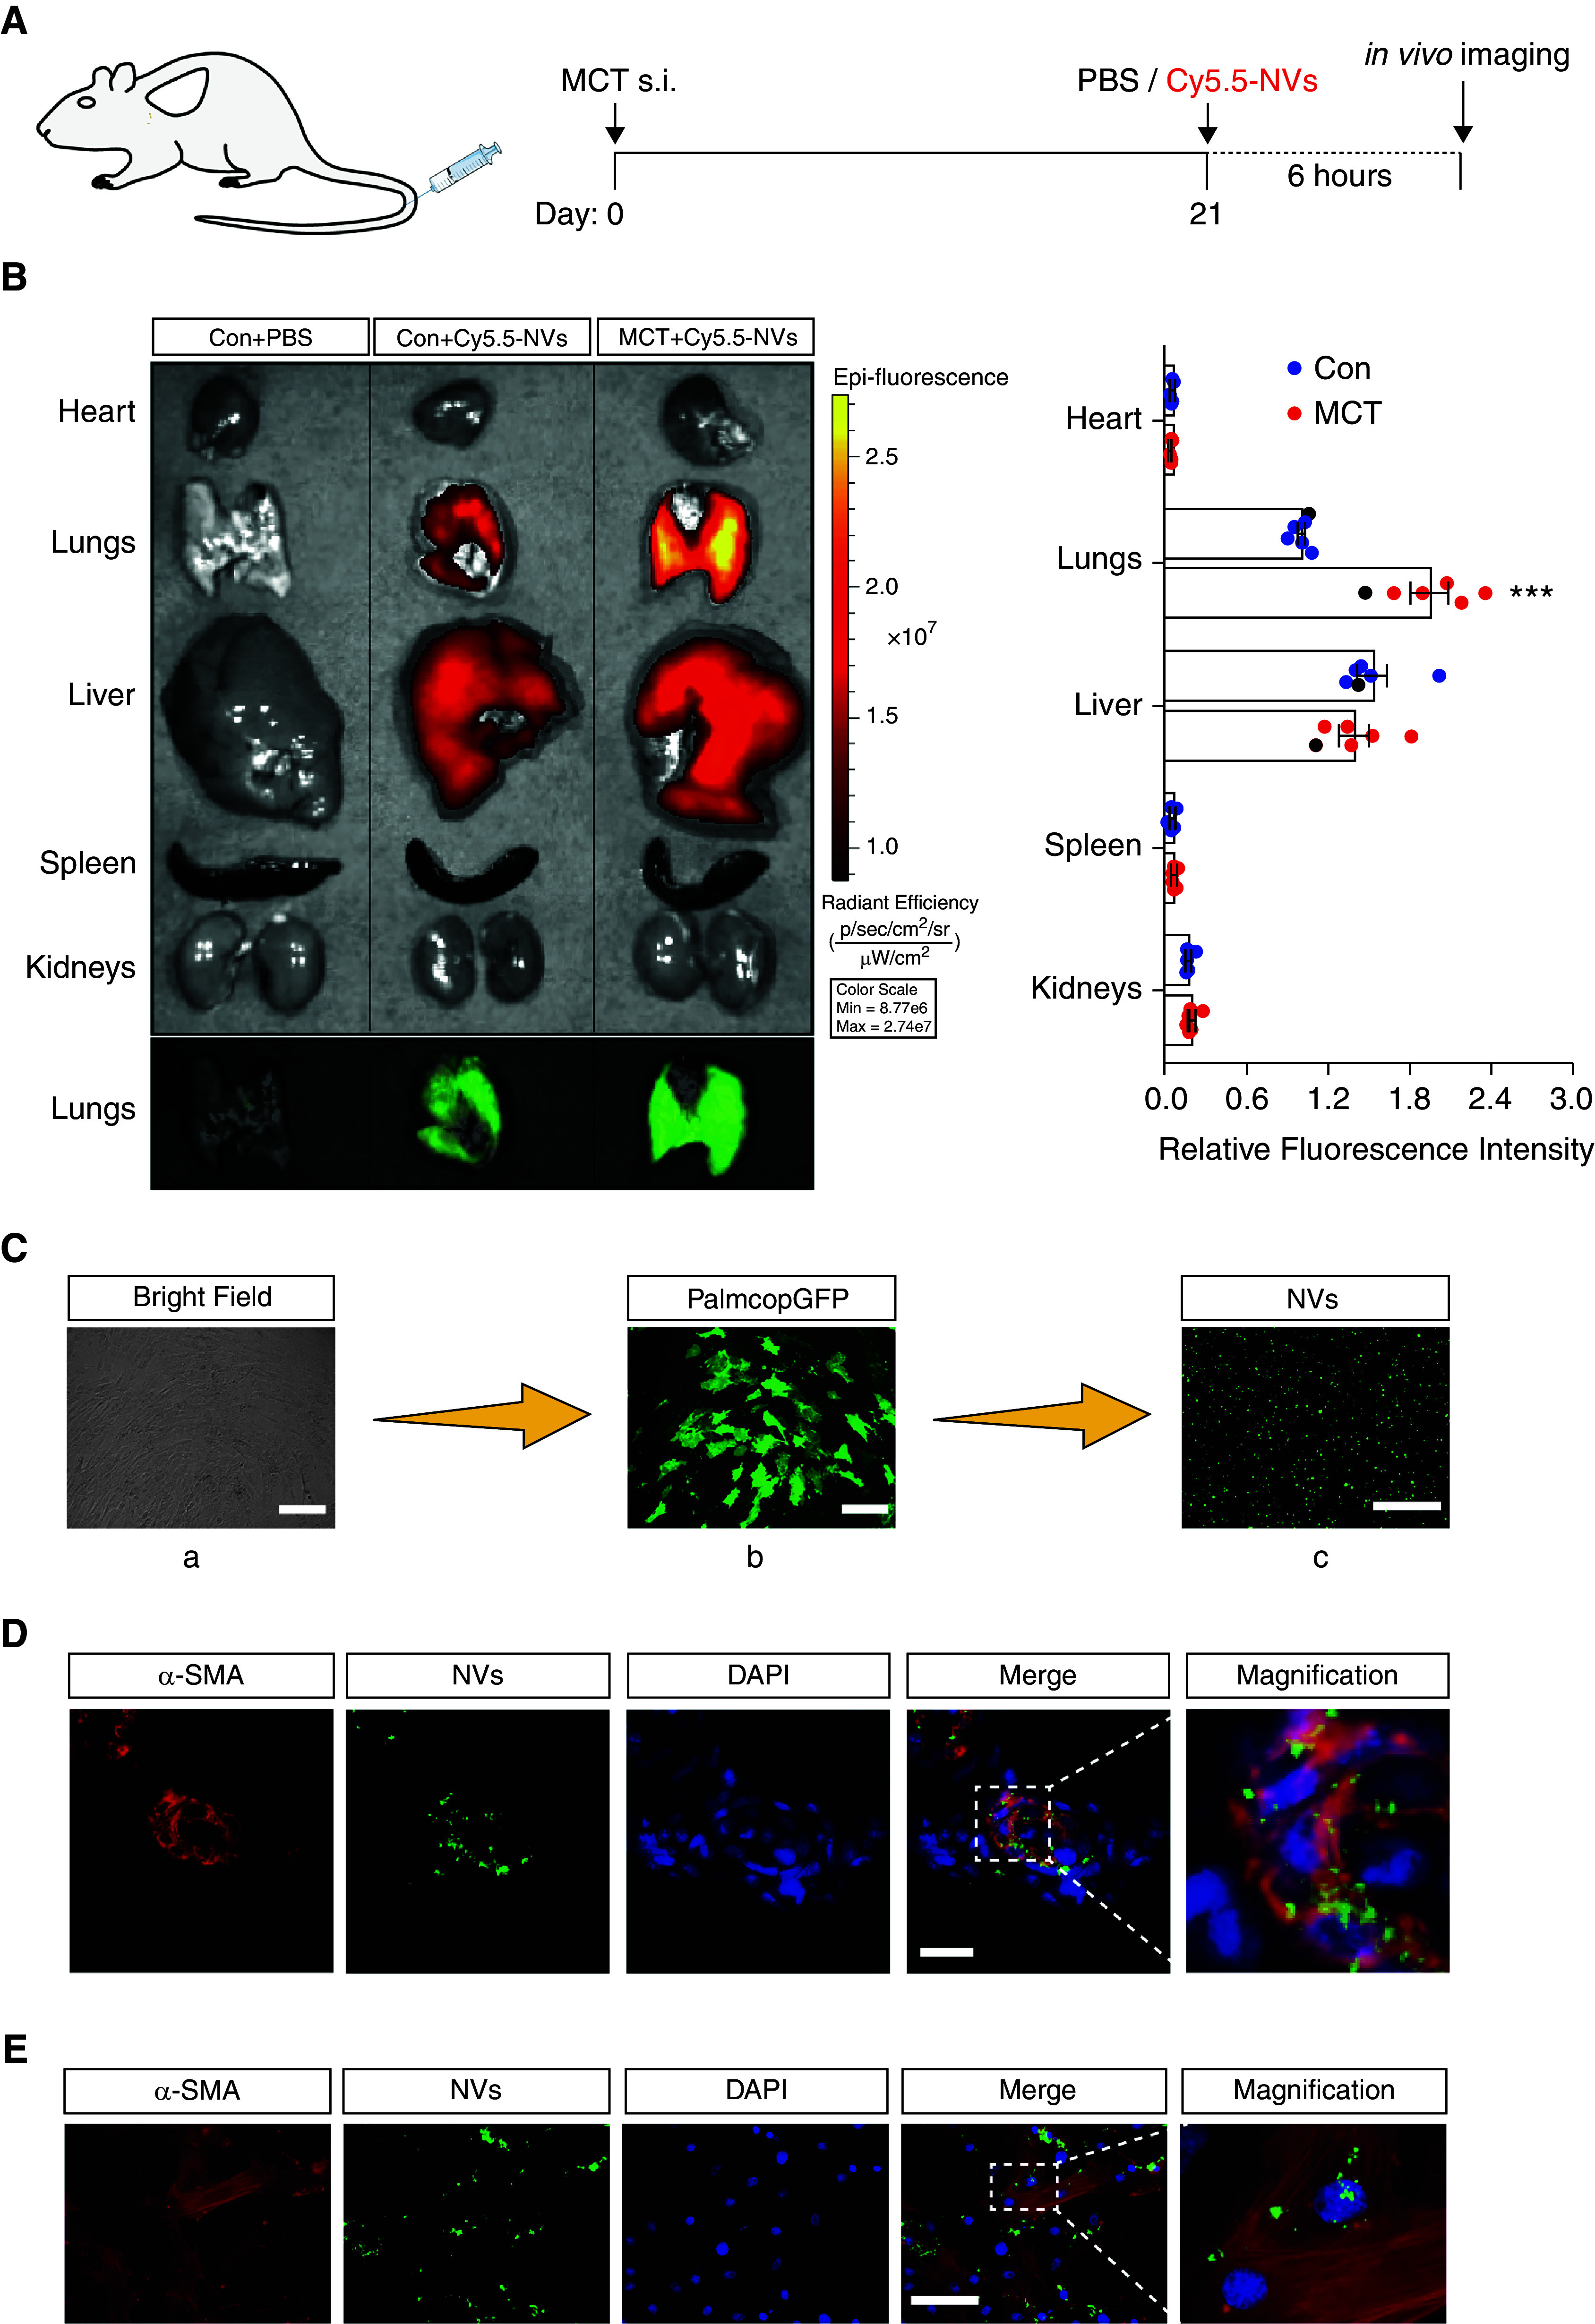
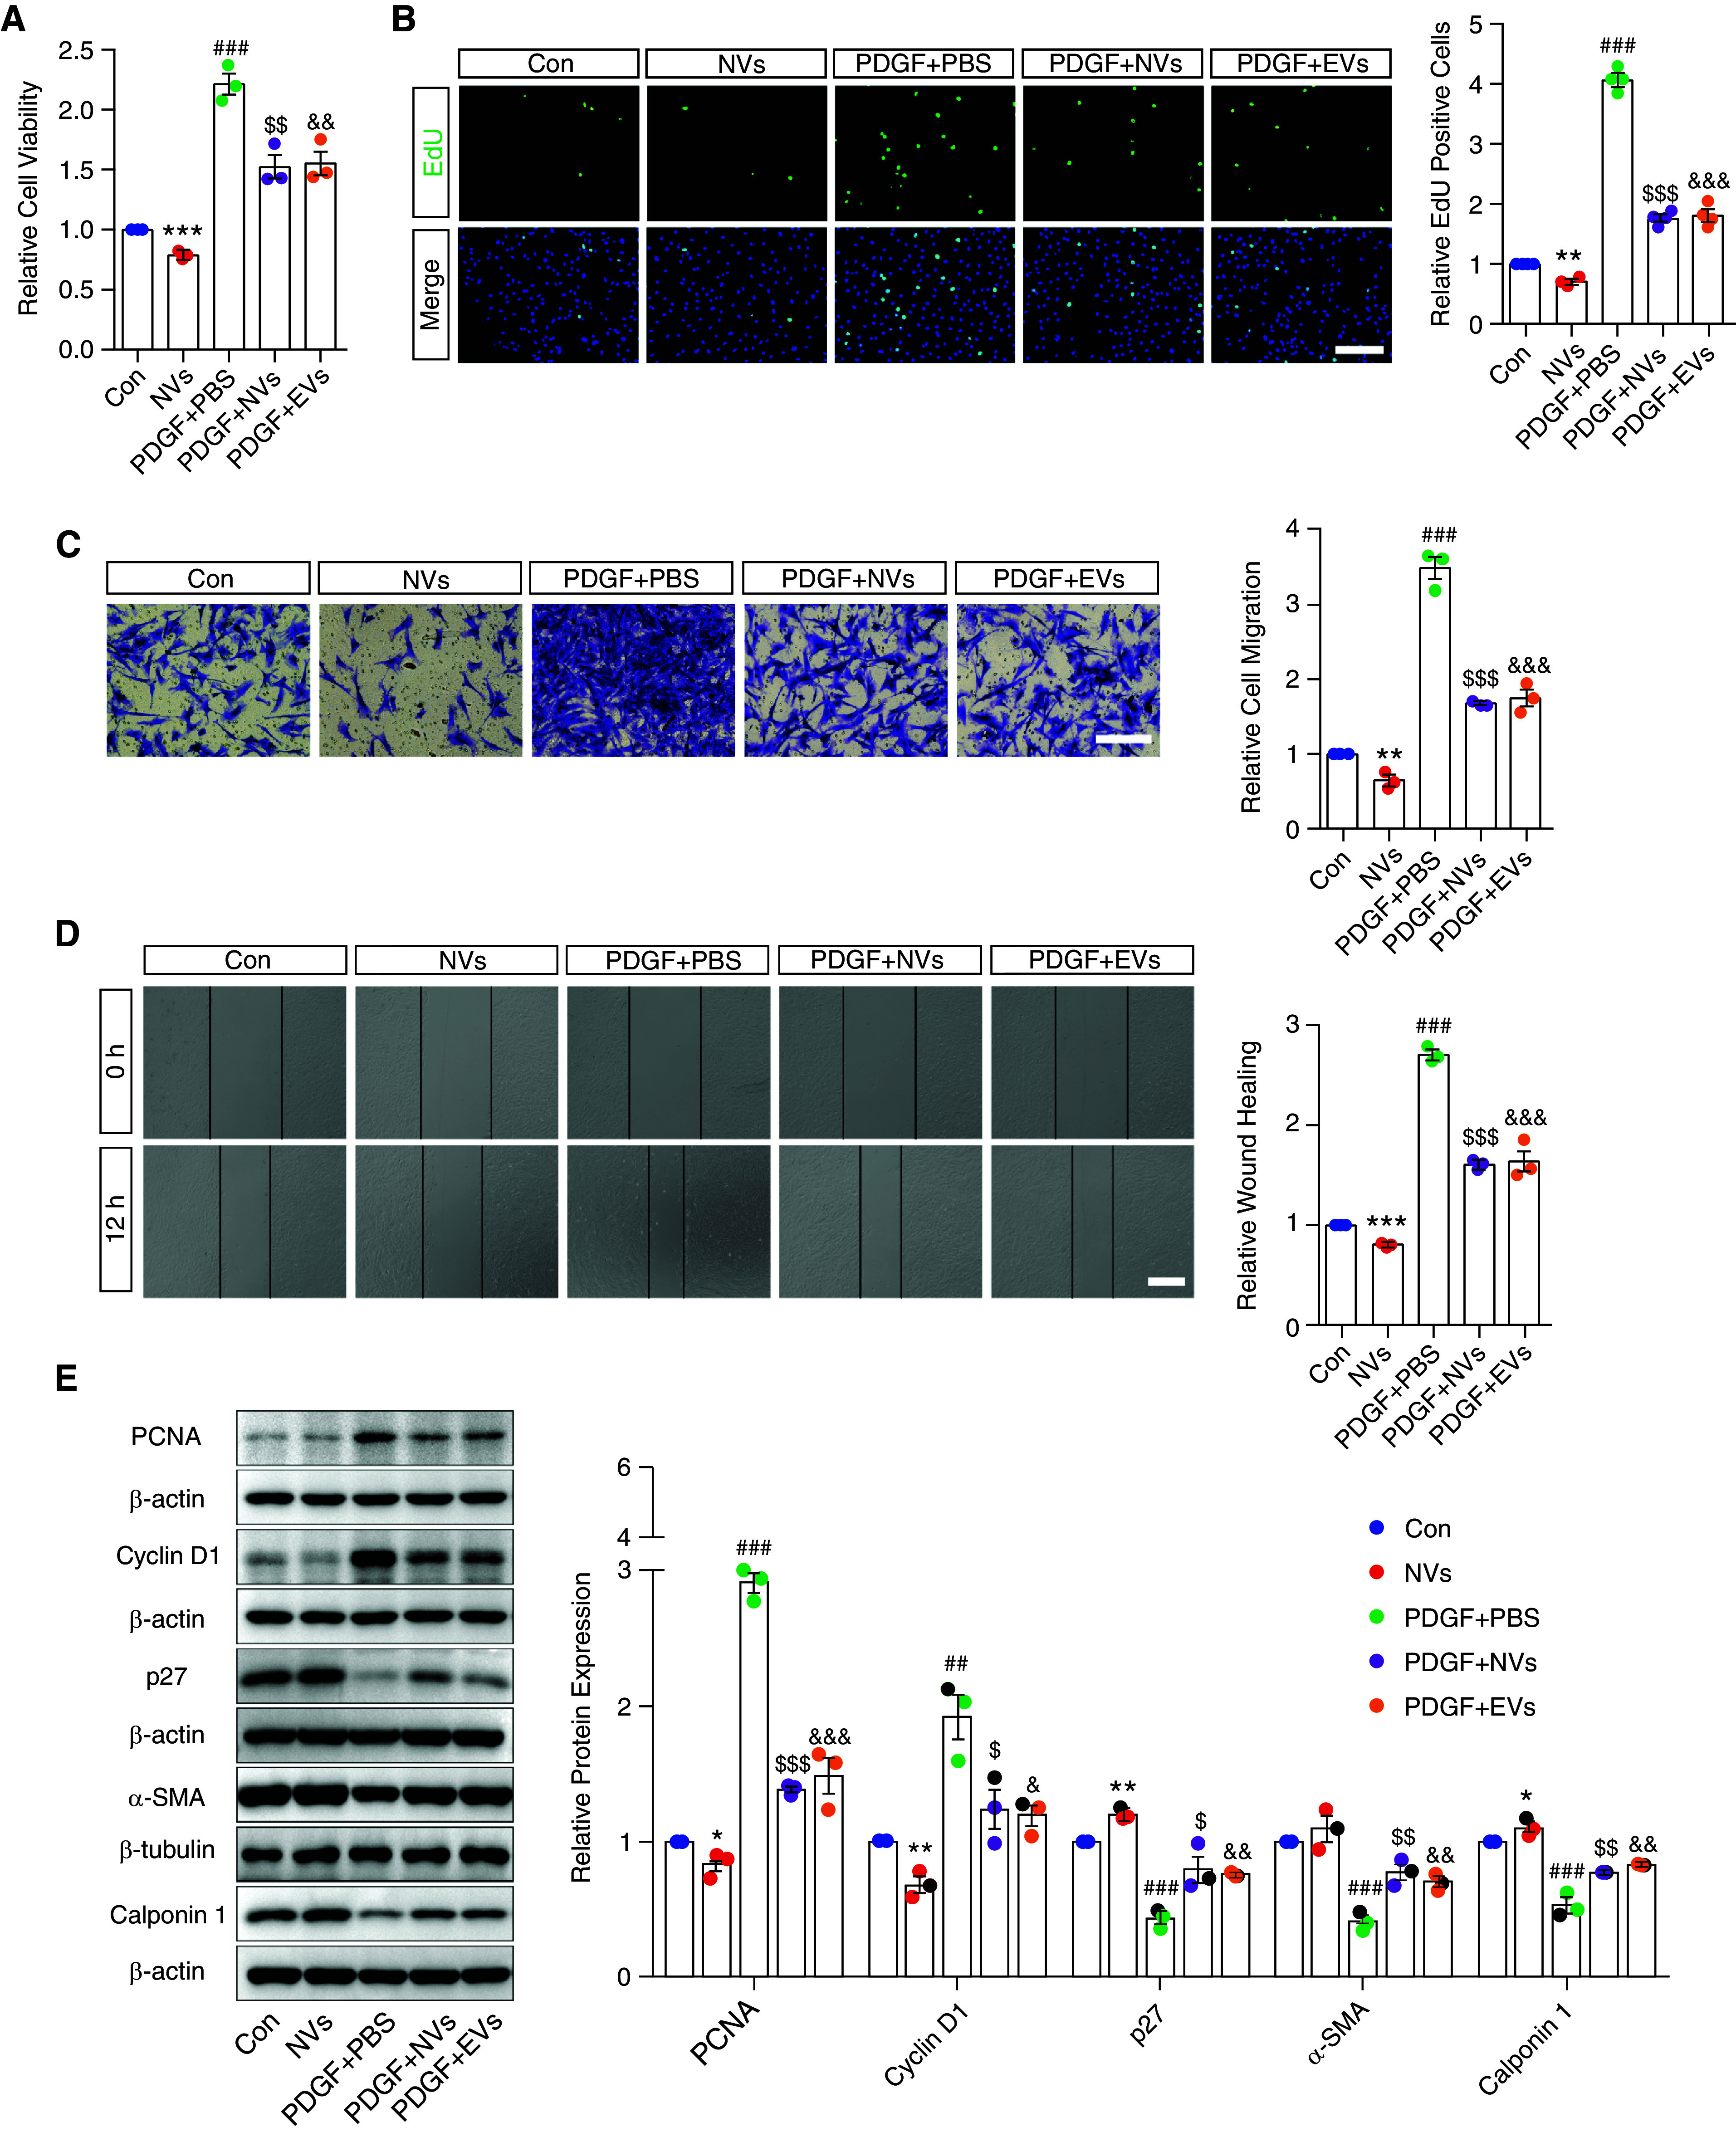
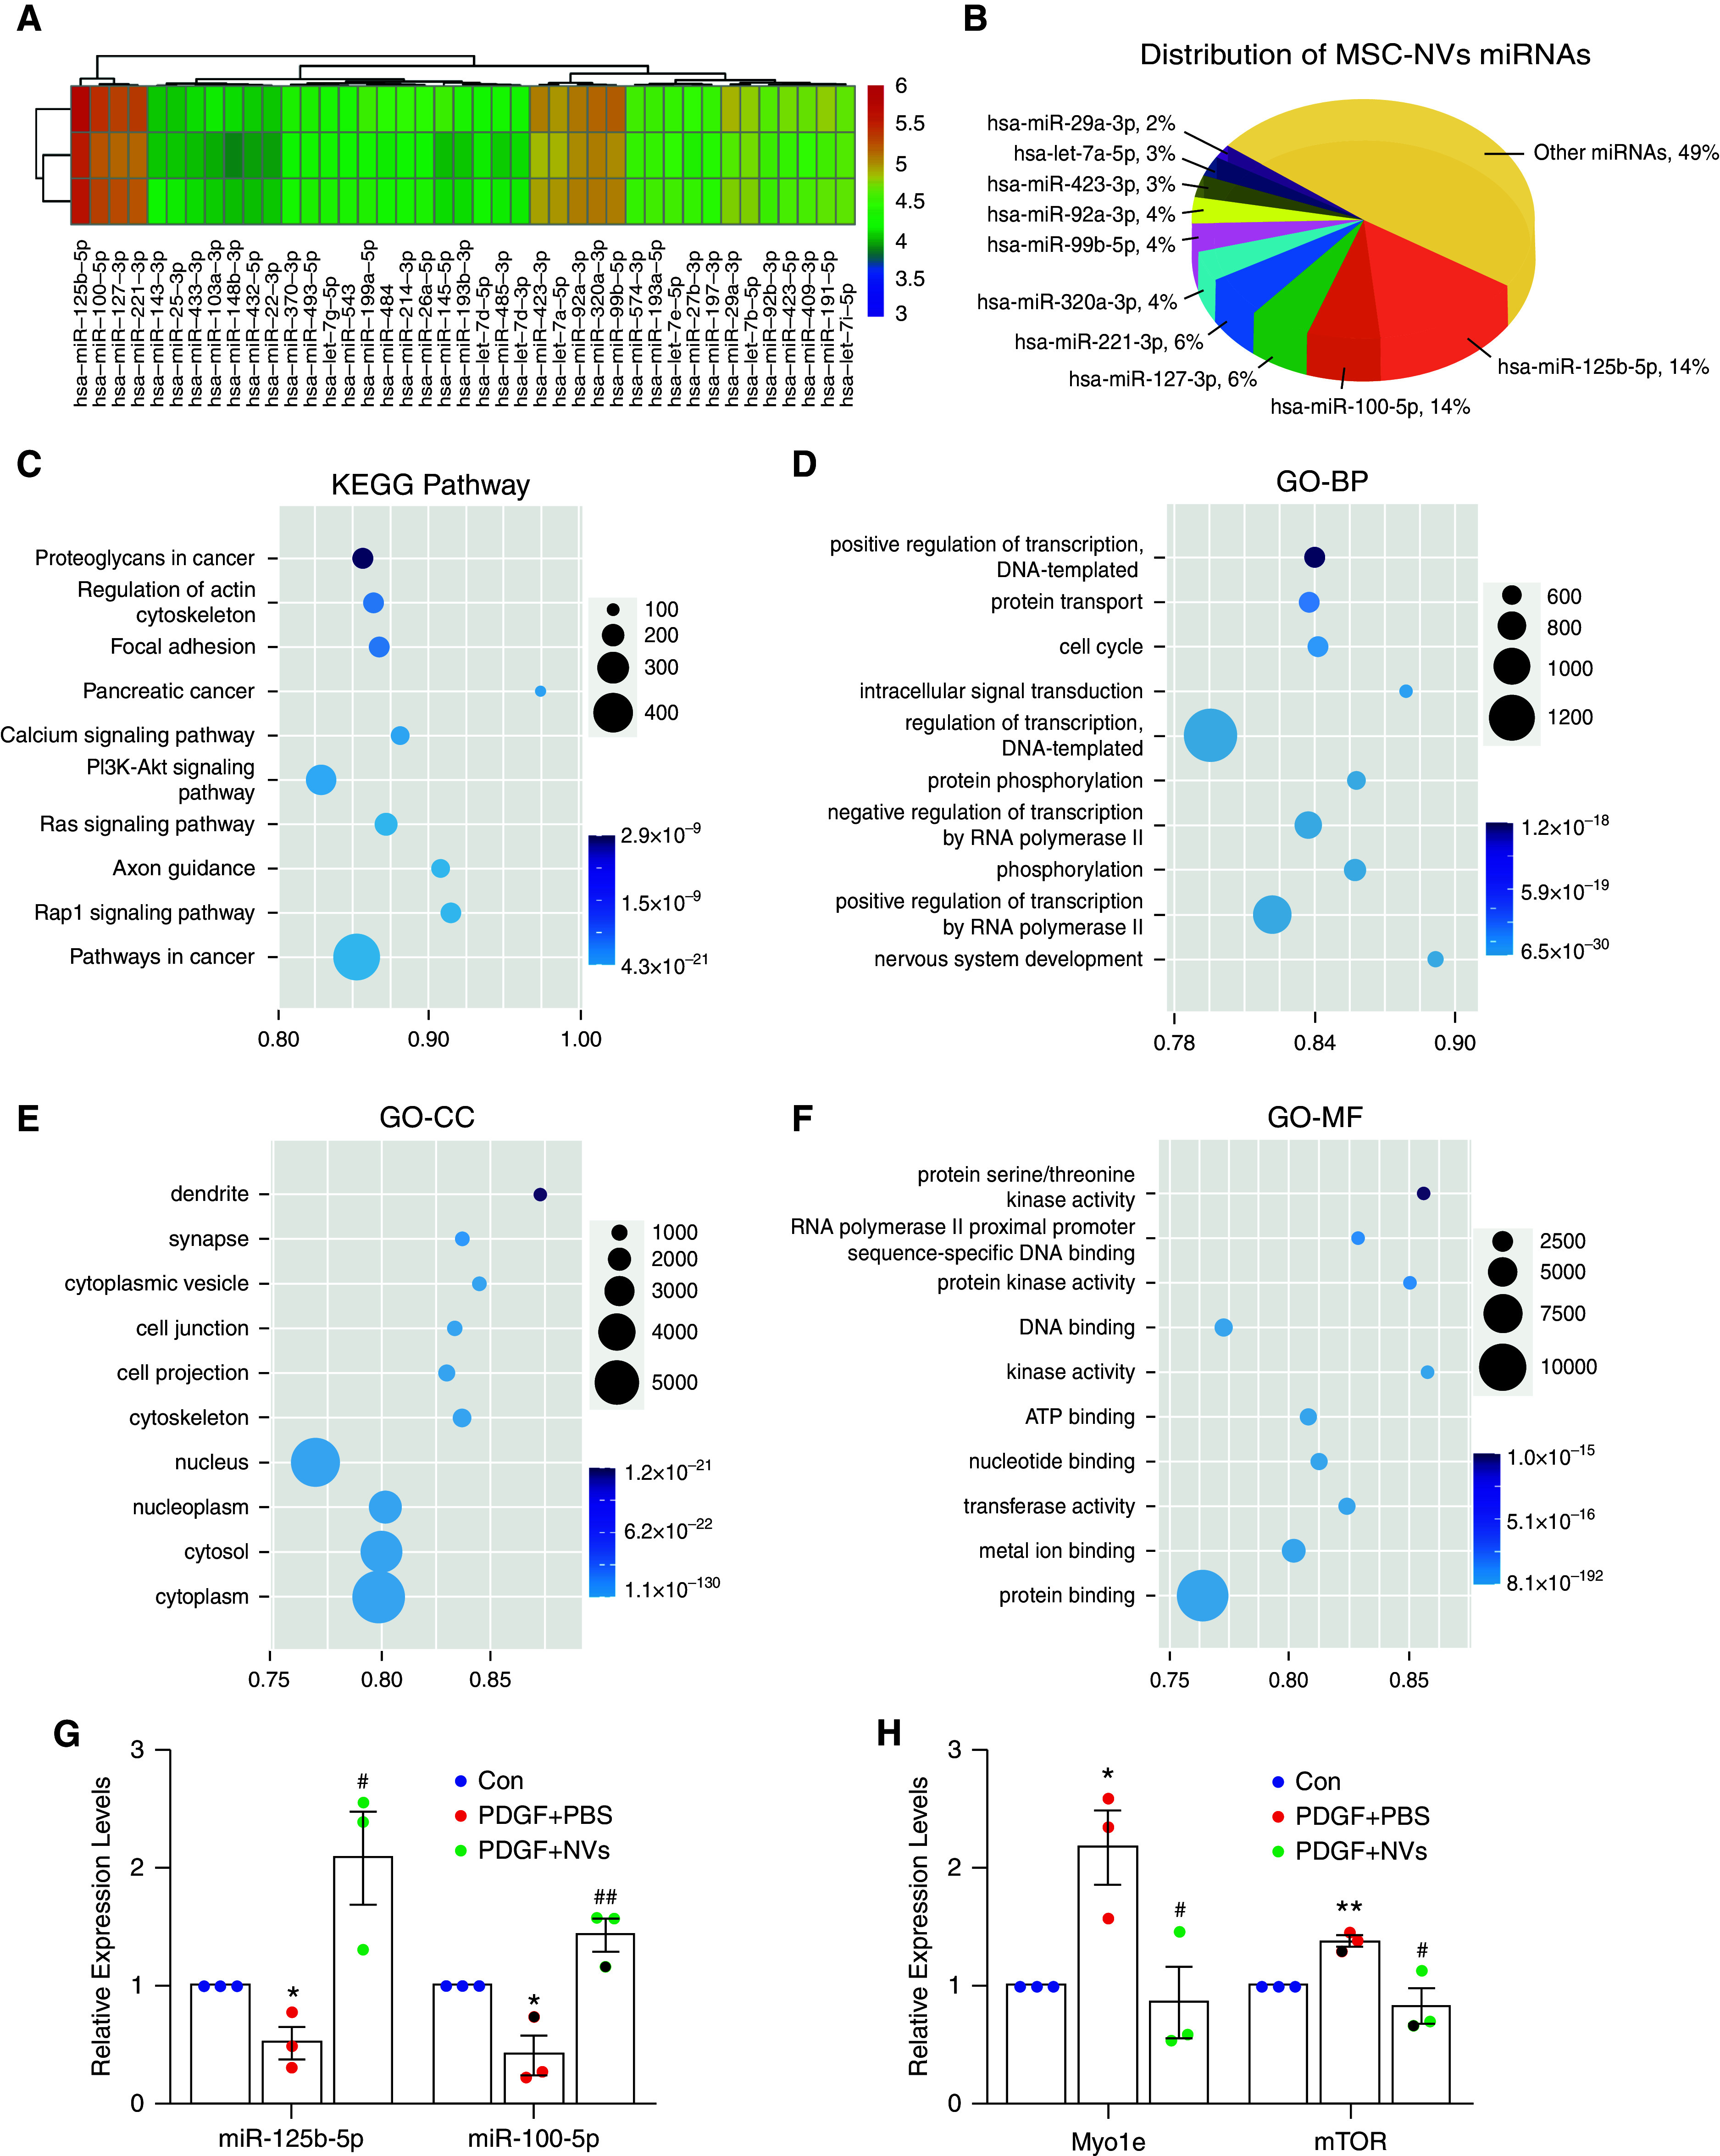
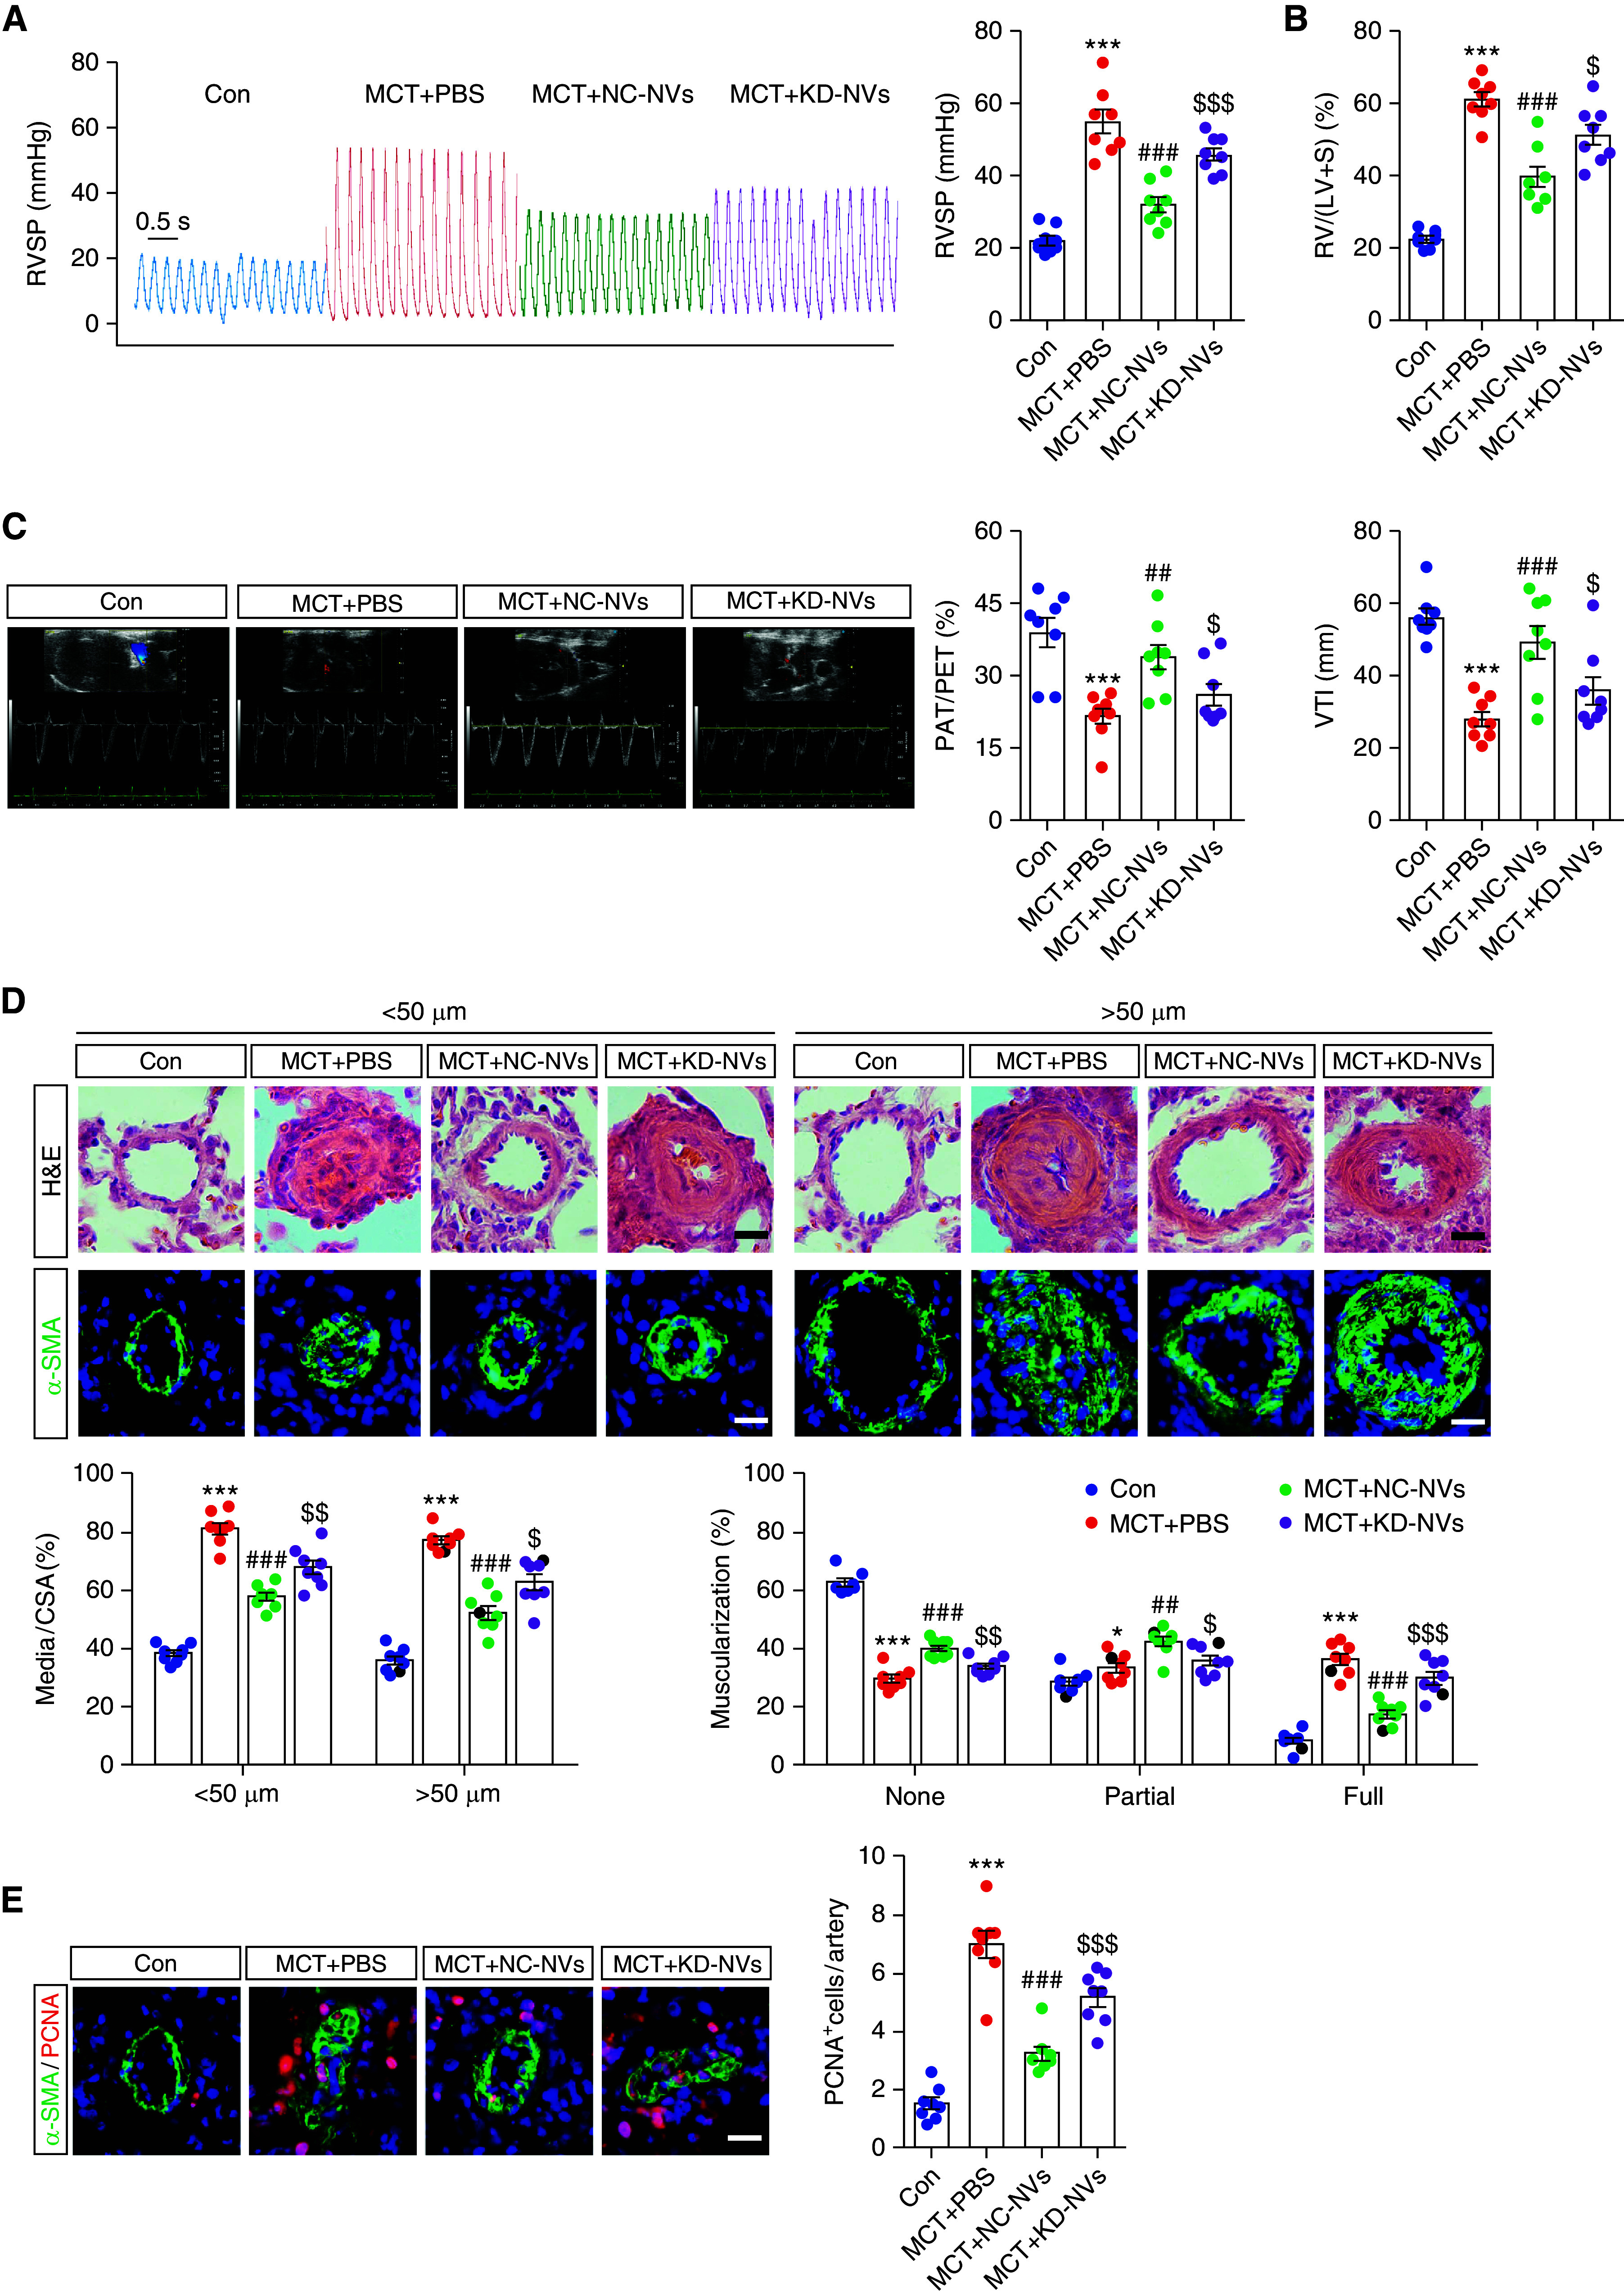
Extracellular vesicles (EVs) derived from mesenchymal stem cells (MSCs) have been evaluated in many studies as promising therapeutic agents for pulmonary hypertension (PH). However, low yields and heterogeneity are major barriers in the translational utility of EVs for clinical studies. To address these limitations, we fabricated MSC-derived nanovesicles (MSC-NVs) by serial extrusion through filters, resulting in MSC-NVs with characteristics similar to conventional EVs but with much higher production yields. Herein, we examined the therapeutic efficacy of MSC-NVs in preclinical models of PH in vitro and in vivo. Intervention with MSC-NVs improved the core pathologies of monocrotaline-induced PH in rats. Intravenous administration of MSC-NVs resulted in significant uptake within hypertensive lungs, pulmonary artery lesions, and especially pulmonary artery smooth muscle cells (PASMCs). In vitro, MSC-NVs inhibited PDGF-induced proliferation, migration, and phenotype switching of PASMCs. miRNA-sequencing analysis of the genetic cargo of MSC-NVs revealed that miR-125b-5p and miR-100-5p are highly abundant, suggesting that they might account for the therapeutic effects of MSC-NVs in PH. Depletion of miR-125b-5p and miR-100-5p in MSCs almost completely abolished the beneficial effects of MSC-NVs in protecting PASMCs from PDGF-stimulated changes in vitro and also diminished the protective effects of MSC-NVs in monocrotaline-induced PH in vivo. These data highlight the efficacy and advantages of MSC-NVs over MSC-EVs as a promising therapeutic strategy against PH.

Keywords: mesenchymal stem cells; miRNAs; nanovesicles; pulmonary artery smooth muscle cells; pulmonary hypertension.


Figures

Figure 1.
Figure 1.
Characterization of mesenchymal stem cells (MSCs) and MSC-derived nanovesicles (MSC-NVs). (A) Surface markers of MSCs detected by flow cytometry: positive for CD90, CD29, CD105, and CD44 and negative for CD34 and CD45. (B) Schematic illustration of MSC-NV preparation. (C) Transmission electron micrograph of MSC-NVs. Scale bars, 100 nm. (D) Size distribution of MSC-NVs determined by nanoparticle tracking analysis. (E) Representative Western blot showing the protein concentration of CD9, CD63, CD81, calnexin, cytochrome C, and GAPDH in MSCs and MSC-NVs. HUCMSCs = human umbilical cord mesenchymal stem cells.
Figure 2.
Figure 2.
Intravenous injection of MSC-NVs markedly attenuates monocrotaline (MCT)-induced pulmonary hypertension (PH) in rats. (A) Workflow of the relevant treatments in MCT-induced PH rats. Briefly, the rat PH model was established through a single subcutaneous injection (s.i.) of MCT (60 mg/kg). On day 15, when the MCT-injected rats had developed middling PH, PBS, MSC-NVs, or extracellular vesicles derived from MSCs (MSC-EVs) were administered via tail vein injection every 4 days until Day 21. Finally, on Day 30 after MCT injection, PH parameters were assessed. (B) Representative images and quantification of the right ventricular (RV) systolic pressure (RVSP) waves in the control (Con), NV, MCT + PBS, MCT + NV, and MCT + EV groups. (C) The Fulton index was measured in each group. (D) Representative echocardiographic images of the parasternal short-axis views of rats and pulsed-wave Doppler traces from the RV outflow tract of rats. Pulmonary artery acceleration time (PAT)/pulmonary artery ejection time (PET) and velocity time integral (VTI) were quantified. (E) Representative images of hematoxylin and eosin (H&E)- and ACTA2 (α-SMA; green)-stained sections of distal pulmonary arteries (PAs) and quantification of vascular medial thickness and proportion of nonmuscularized, partially muscularized, or fully muscularized PAs. (F) Representative images of proliferating cell nuclear antigen (PCNA; red) and ACTA2 (green) immunostaining of lung tissues with DAPI nuclear staining (blue) and quantification of PCNA-expressing cells in PAs. Scale bars, 20 μm. The data are shown as mean ± SE; n = 8–10 per group. ##P < 0.01 and ###P < 0.001 versus Con group; $$P < 0.01 and $$$P < 0.001 versus MCT + PBS group; &P < 0.05, &&P < 0.01, and &&&P < 0.001 versus MCT + PBS group. One-way ANOVA was performed followed by the Tukey post hoc test. RV/(LV + S), RV/(left ventricular + septum) ratio. CSA = cross sectional area.
Figure 3.
Figure 3.
Biodistribution of MSC-NVs in MCT-injected rats. (A) Schematic representation of the protocol for detecting the biodistribution of MSC-NVs in MCT-injected rats. (B) Fluorescence images showing the presence of cyanine 5.5 (Cy5.5)-labeled MSC-NVs (Cy5.5-NVs) in major organs collected from rats after 6-hour intravenous injections of PBS or Cy5.5-NVs and quantification of fluorescence intensity in these organs. (C) Bright field of cultured MSCs (a), GFP cloned from copepod Pontellina plumata (CopGFP)-labeled MSCs (b), and NVs derived from CopGFP-labeled MSCs (c). Scale bars, 100 μm. (D) Immunofluorescence analysis of the colocalization of MSC-NVs (green) and smooth muscle cells (ACTA2; red) of PAs from rats subjected to MCT after 12-hour intravenous injections of MSC-NVs. The nucleus was stained with DAPI (blue). Scale bar, 20 μm. (E) Representative fluorescence images of rat pulmonary artery smooth muscle cells (RPASMCs) after treatment with CopGFP-labeled MSC-NVs. The nucleus was stained with DAPI (blue). Scale bar, 100 μm. The data are shown as mean ± SE; n = 6 per group. ***P < 0.001 versus Con group. An unpaired Student’s t test was used for the statistical analysis.
Figure 4.
Figure 4.
Effect of MSC-NVs on proliferation, migration, and phenotype switching of RPASMCs. (A) Cell viability in RPASMCs was measured via Cell Counting Kit-8 (CCK8) assay. (B) RPASMCs proliferation analysis was conducted by 5-ethynyl-2′-deoxyuridine (EdU) assay. Scale bar, 50 μm. (C) Transwell assays to observe migratory ability of RPASMCs. Scale bar, 200 μm. (D) A wound-healing assay was performed to evaluate the migration of RPASMCs. Scale bar, 250 μm. (E) Western blot analysis was used to detect the protein concentrations of PCNA, cyclin D1, p27, ACTA2, and calponin 1. β-Tubulin or β-actin was used as a loading control. The data are shown as mean ± SE. Results are representative of three separate experiments. *P < 0.05, **P < 0.01, and ***P < 0.001 versus Con group; ##P < 0.01 and ###P < 0.001 versus Con group; $P < 0.05, $$P < 0.01, and $$$P < 0.001 versus platelet-derived growth factor (PDGF) + PBS group; &P < 0.05, &&P < 0.01, and &&&P < 0.001 versus PDGF + PBS group. One-way ANOVA was performed followed by the Tukey post hoc test.
Figure 5.
Figure 5.
miRNA-sequencing signatures of MSC-NVs and the expression levels of miR-125b-5p, miR-100-5p, and their respective downstream targets in RPASMCs. (A) Heat map of the most abundant miRNAs in MSC-NVs by miRNA sequencing (mean reads, >10,000). (B) Relative percentage of the top 10 miRNAs in total miRNA reads. (C) Kyoto Encyclopedia of Genes and Genomes (KEGG) pathway analysis was performed on target genes of miRNAs enriched in MSC-NVs. (DF) Gene ontology (GO) analysis for the target genes of the enriched miRNAs in A, and biological processes (BPs), cellular components (CCs), and molecular functions (MFs) were presented. Only the 10 most relevant GO terms are shown. (G) RT-PCR analysis of the miRNAs in RPASMCs was performed after the treatment of PBS (Con), PDGF + PBS or PDGF + MSC-NVs. U6 was used as the internal reference. (H) RT-PCR analysis of Myo1e and mTOR in RPASMCs was performed. β-Actin was used as the internal reference. The data are shown as mean ± SE. For G and H, results are representative of three separate experiments. *P < 0.05 and **P < 0.01 versus Con group; #P < 0.05 and ##P < 0.01 versus PDGF + PBS group. One-way ANOVA was performed followed by the Tukey post hoc test.
Figure 6.
Figure 6.
Effect of MSC-NV miR-125b-5p and miR-100-5p inhibition on the proliferation, migration, and phenotype switching of RPASMCs. (A and B) Cell viability was assessed with CCK8 (A), and cell proliferation was measured by EdU incorporation assay (B). Scale bar, 50 μm. (C) A Transwell migration assay was performed to measure RPASMCs’ migratory ability. Scale bar, 500 μm. (D) A wound-healing assay was used to evaluate RPASMC migration. Scale bar, 250 μm. (E) Protein concentrations of PCNA, cyclin D1, p27, ACTA2, and calponin 1 were determined by Western blot analysis. β-Tubulin or β-actin was used as a loading control. The data are shown as mean ± SE. Results are representative of three separate experiments. **P < 0.01 and ***P < 0.001 versus Con group; ##P < 0.01 and ###P < 0.001 versus PDGF + PBS group; $P < 0.05, $$P < 0.01, and $$$P < 0.001 versus PDGF + NC-NV group. One-way ANOVA was performed followed by the Tukey post hoc test. KD = knockdown.
Figure 7.
Figure 7.
miR-125b-5p and miR-100-5p inhibitors reduced the protective effects of MSC-NVs on MCT-induced PH in the rat. (A and B) PH was evaluated in rats by measuring RVSP (A) and RV hypertrophy (B). (C) PAT/PET and VTI were measured via echocardiography. (D) Representative images of distal PAs stained with H&E, and vascular smooth muscle cells were labeled using ACTA2 (green). The degree of medial wall thickness and the percentage of nonmuscularized, partially muscularized, or fully muscularized PAs were analyzed. Scale bars, 20 μm. (E) Immunofluorescence staining of lung samples for ACTA2 (green) and PCNA (red), and PCNA+ cells were quantified in each PA. Scale bar, 20 μm. The data are shown as mean ± SE; n = 8 per group. *P < 0.05 and ***P < 0.001 versus Con group; ##P < 0.01 and ###P < 0.001 versus MCT + PBS group; $P < 0.05, $$P < 0.01, and $$$P < 0.001 versus MCT + NC-NV group. One-way ANOVA was performed followed by the Tukey post hoc test.

Comment in

Similar articles

Cited by

References

    1. Simonneau G, Montani D, Celermajer DS, Denton CP, Gatzoulis MA, Krowka M, et al. Haemodynamic definitions and updated clinical classification of pulmonary hypertension. Eur Respir J . 2019;53:1801913. - PMC - PubMed
    1. Nickel NP, Yuan K, Dorfmuller P, Provencher S, Lai YC, Bonnet S, et al. Beyond the lungs: systemic manifestations of pulmonary arterial hypertension. Am J Respir Crit Care Med . 2020;201:148–157. - PMC - PubMed
    1. Rabinovitch M. Molecular pathogenesis of pulmonary arterial hypertension. J Clin Invest . 2012;122:4306–4313. - PMC - PubMed
    1. Muhammad SA, Abbas AY, Saidu Y, Fakurazi S, Bilbis LS. Therapeutic efficacy of mesenchymal stromal cells and secretome in pulmonary arterial hypertension: a systematic review and meta-analysis. Biochimie . 2020;168:156–168. - PubMed
    1. Kanki-Horimoto S, Horimoto H, Mieno S, Kishida K, Watanabe F, Furuya E, et al. Implantation of mesenchymal stem cells overexpressing endothelial nitric oxide synthase improves right ventricular impairments caused by pulmonary hypertension. Circulation . 2006;114(1 Suppl):I181–I185. - PubMed

Publication types