. 2022 May 10;119(19):e2201288119.
doi: 10.1073/pnas.2201288119. Epub 2022 May 4.

Transcriptome profiling in swine macrophages infected with African swine fever virus at single-cell resolution

Affiliations

Transcriptome profiling in swine macrophages infected with African swine fever virus at single-cell resolution

Yuxuan Zheng et al. Proc Natl Acad Sci U S A. .

Abstract

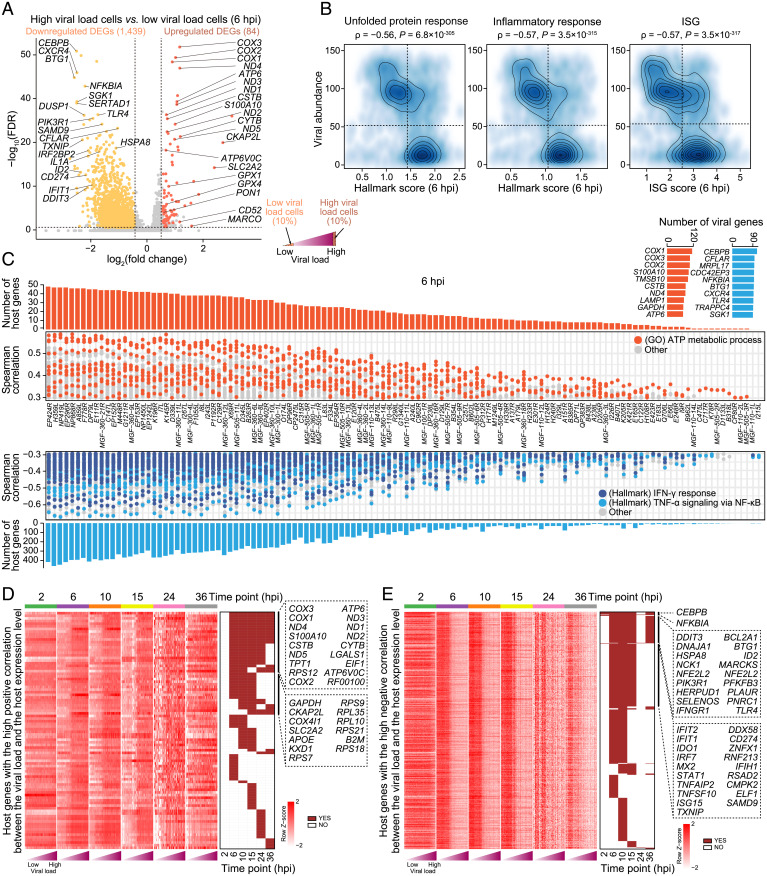
African swine fever virus (ASFV) is the causative agent of African swine fever, a highly contagious and usually fatal disease in pigs. The pathogenesis of ASFV infection has not been clearly elucidated. Here, we used single-cell RNA-sequencing technology to survey the transcriptomic landscape of ASFV-infected primary porcine alveolar macrophages. The temporal dynamic analysis of viral genes revealed increased expression of viral transmembrane genes. Molecular characteristics in the ASFV-exposed cells exhibited the activation of antiviral signaling pathways with increased expression levels of interferon-stimulated genes and inflammatory- and cytokine-related genes. By comparing infected cells with unexposed cells, we showed that the unfolded protein response (UPR) pathway was activated in low viral load cells, while the expression level of UPR-related genes in high viral load cells was less than that in unexposed cells. Cells infected with various viral loads showed signature transcriptomic changes at the median progression of infection. Within the infected cells, differential expression analysis and coregulated virus–host analysis both demonstrated that ASFV promoted metabolic pathways but inhibited interferon and UPR signaling, implying the regulation pathway of viral replication in host cells. Furthermore, our results revealed that the cell apoptosis pathway was activated upon ASFV infection. Mechanistically, the production of tumor necrosis factor alpha (TNF-α) induced by ASFV infection is necessary for cell apoptosis, highlighting the importance of TNF-α in ASFV pathogenesis. Collectively, the data provide insights into the comprehensive host responses and complex virus–host interactions during ASFV infection, which may instruct future research on antiviral strategies.

Keywords: African swine fever virus; macrophage; single-cell RNA sequencing; tumor necrosis factor alpha; virus–host interaction.


Conflict of interest statement

The authors declare no competing interest.

Figures

Fig. 1.
Fig. 1.
Distinct cell types revealed by scRNA-seq in alveolar lavage fluid. (A and B) Identification of ASFV infection. Immunofluorescence analysis of ASFV viral protein p72 in cells infected with ASFV (A), and viral titers in the supernatants examined by hemadsorption assay HAD50 (B). Data are shown as mean value ± SD. (Scale bars, 200 μm.) (C) Schema of this study design. (D) UMAP plot showing cell types in unexposed and exposed cells. (E) UMAP plots showing the group information of cells. (F) Dot plot showing scaled expression levels of cell type–specific genes in unexposed and exposed cells. Expression levels in each gene are scaled, ranging from 0 to 1. The dot color and size indicate expression levels and the percentage of expressed cells, respectively. DC, dendritic cell; Mac., macrophage; Mast, mast cell; Pro., proliferative cell; T, T cell.
Fig. 2.
Fig. 2.
Temporal dynamics of viral gene expression during ASFV infection. (A) UMAP plot showing the percentage of viral transcripts in each cell collected from all time points. (B) Bar plot showing the average percentage of the viral transcripts in macrophages. Data are shown as mean value ± SEM. (C) Bar plot showing the percentage of infected macrophages among living cells identified by scRNA-seq data. (D) Bar plots showing the percentage of transcripts for each viral gene in infected and bystander macrophages. (E) Line plots showing the expression levels of representative viral genes. Gene expression levels are quantified with counts per million mapped reads (CPM). Data are shown as mean value ± SEM. (F) Bar plots showing viral gene transcription by qRT-PCR. Data are shown as mean value ± SD. (G) Heatmap showing the rank of the top-ranked 50 viral genes in infected macrophages, ranked by the expressed frequency. (H) Line plots showing expression levels of viral genes in four gene clusters. The number of viral genes in each gene cluster is indicated in parentheses. Pink lines correspond to the expression levels of each gene, and red lines correspond to the average expression levels of genes. Transmembrane- and secretion-associated genes are indicated.
Fig. 3.
Fig. 3.
Transcriptomic characteristics between unexposed and exposed cells. (A) Heatmaps showing the distribution of up-regulated and down-regulated DEGs between unexposed and exposed cells. The side bar indicates the DEG group (pink: DEGs shared by at least two time points; others: specifically expressed DEGs at one time point). (B) Dot plots showing enriched GO terms of up-regulated and down-regulated DEGs between unexposed and exposed cells. The dot color and size both indicate the statistical significance of the GO terms. (C) Bar plots showing the relative transcription level of TNF-α in exposed cells compared with unexposed. PAMs are examined by a relative qRT-PCR. ns, not significant; **P < 0.01 and ***P < 0.001 (two-tailed t test). Data are shown as mean value ± SD. (D) Bar plots showing the kinetics of TNF-α in the supernatants of unexposed and exposed cells. Supernatants are tested by ELISA. *P < 0.05, **P < 0.01, and ***P < 0.001 (two-tailed t test). Data are shown as mean value ± SD. (E) Violin and boxplots showing gene expression levels. Two-tailed t test P values are indicated. The dashed lines indicate the median trend of gene scores in exposed cells. (F) Dot plots showing potential key regulators in up-regulated and down-regulated DEGs during infection. The dot color and size indicate the time point and number of connections, respectively. ISGs are indicated in bold red. (G) Bar plot showing the number of overlapping genes between potential key transcription factors (TFs)/regulators/targets and given gene sets. (H) Gene regulation network showing potential key regulators and targets in up-regulated DEGs after infection at 10 hpi. The dot size indicates the number of connections, and the line thickness indicates the weight between a given gene pair.
Fig. 4.
Fig. 4.
Transcriptomic characteristics between unexposed cells and infected cells. (A, Top) Scatter density plots showing the relationship between viral loads and UPR hallmark scores in infected cells. Spearman correlation coefficients (ρ) and correlation test P values (P) are indicated. (A, Bottom) Schema showing the selection method of low and high viral load cells. (B) Violin and boxplots showing expression levels of UPR hallmark scores. Two-tailed t test P values are indicated. (C) Schema showing three UPR subpathways. (D) Violin and boxplots showing expression levels of UPR subpathway scores. Two-tailed t test P values are indicated.
Fig. 5.
Fig. 5.
Differences of host cells with distinct viral loads and coregulated analysis between host and virus. (A) Volcano plot showing DEGs between cells with high and low viral loads at 6 hpi. The numbers of up-regulated and down-regulated DEGs are indicated in parentheses. (B) Scatter density plots showing the relationship between viral abundance and hallmark/ISG scores in infected cells. Spearman correlation coefficients and correlation test P values are indicated. (C) Scatterplots showing the corresponding relationship between viral and host genes at 6 hpi. Each dot is a host gene, and host genes in given gene sets are colored. Bar plots (Top and Bottom) showing the number of host genes corresponding to a given viral gene and bar plots (Top Right) showing the number of viral genes corresponding to a given host gene and top-ranked 10 host genes are shown. (D and E, Left) Heatmap showing expression levels of host genes with a highly positive (D)/negative (E) correlation between viral loads and host expression levels, and cells are arranged into 100 bins and ordered with viral loads at each time point. (D and E, Right) Identification of genes corresponding to the heatmap (Left); red indicates that a given gene is the identified host gene with the high correlation at a given time point. Representative genes are listed.
Fig. 6.
Fig. 6.
Gene expression patterns of macrophage subtypes in the infection process. (A, Left) UMAP plot showing macrophage subtypes among unexposed cells at 2 hpi. (A, Right) UMAP plot showing expression levels of representative subtype-specific genes, and corresponding subtypes are indicated with shadows. (B) Heatmap showing scaled expression levels of macrophage subtype–specific genes. Each column corresponds to the average expression level of a given subtype at a given time point. Representative subtype-specific genes are listed (Right). (C) UMAP plot showing macrophage subtypes among exposed cells at 2 hpi. (D) UMAP plot showing viral loads and viral load levels of exposed cells at 2 hpi. Viral load levels are defined based on unsupervised clustering results. (E) Boxplots showing viral loads in cells with different viral load levels at each time point. Two-tailed t test P values are indicated. (F) Bar plots showing gene score increase in exposed cells, compared with unexposed cells. (G, Left) Stacked bar plot showing the percentage of macrophage subtypes among unexposed and exposed cells. (G, Right) Line plot showing the relative change of cell composition between unexposed and exposed cells.
Fig. 7.
Fig. 7.
TNF-α engages in cell apoptosis induced by ASFV infection. (A and B) FACS result showing cell apoptosis among unexposed or exposed cells. The apoptosis rate is shown in the scatter diagram (A) and quantified in the histogram (B). ***P < 0.001 (two-tailed t test). Data are shown as mean value ± SD. (C and D) FACS result showing cell apoptosis inhibited by an anti–TNF-α MAb. PAMs are exposed to ASFV at an MOI of 1 for 36 h in the presence of different concentrations (0, 10, 20, and 50 μg/mL) of anti–TNF-α MAb. The apoptosis rate in the cells is shown in the scatter diagram (C) and quantified in the histogram (D). **P < 0.01 (two-tailed t test). Data are shown as mean value ± SD.

References

    1. Netherton C. L., Connell S., Benfield C. T. O., Dixon L. K., The genetics of life and death: Virus-host interactions underpinning resistance to African swine fever, a viral hemorrhagic disease. Front. Genet. 10, 402 (2019). - PMC - PubMed
    1. Wang L., et al. , Comparative genomic analysis reveals an ‘open’ pan-genome of African swine fever virus. Transbound. Emerg. Dis. 67, 1553–1562 (2020). - PubMed
    1. Liu S., et al. , Cryo-EM structure of the African swine fever virus. Cell Host Microbe 26, 836–843.e3 (2019). - PubMed
    1. Malogolovkin A., Kolbasov D., Genetic and antigenic diversity of African swine fever virus. Virus Res. 271, 197673 (2019). - PubMed
    1. Andrés G., African swine fever virus gets undressed: New insights on the entry pathway. J. Virol. 91, e01906-16 (2017). - PMC - PubMed

Publication types

Substances