. 2022 Apr;118(4):797-857.
doi: 10.36660/abc.20220213.

Joint Guideline on Venous Thromboembolism - 2022

[Article in English, Portuguese]
Affiliations

Joint Guideline on Venous Thromboembolism - 2022

[Article in English, Portuguese]
Ana Cristina Lopes Albricker et al. Arq Bras Cardiol. 2022 Apr.

Erratum in

No abstract available


Figures

Quadro 2
Quadro 2. – Fluxograma diagnóstico para a pesquisa de trombose venosa profunda (TVP)
Quadro 5
Quadro 5. – Fluxograma diagnóstico na avaliação da suspeita de trombembolismo pulmonar (TEP) sem repercussão hemodinâmica
Quadro 6
Quadro 6. – Algoritmo diagnóstico para trombembolismo pulmonar (TEP) agudo em pacientes com instabilidade hemodinâmica
Figura 1
Figura 1. – A-C: visibilização direta de trombo em cavidades direitas e artéria pulmonar esquerda. Tr: trombo; Ao: aorta; PE: artéria pulmonar esquerda; PD: artéria pulmonar direita.
Figura 2
Figura 2. – Sobrecarga pressórica e/ou disfunção do ventrículo direito (VD) A: retificação do septo ventricular com dilatação do VD ao corte paraesternal transverso; B: dilatação do VD avaliada ao corte apical pela relação área diastólica final VD/VE (>0,6 leve; 1-2 importante; >2 severa); C: equivalente da relação VD/VE avaliada pela angio-TC. VD: ventrículo direito; VE: ventrículo esquerdo; AD: átrio direito; AE: átrio esquerdo.
Figura 3
Figura 3. – Sinal de McConell. Observam-se dilatação do ventrículo direito, hipocinesia de parede livre e preservação da contratilidade apical. A: diástole; B: sístole; C: strain longitudinal do ventrículo direito (VD); ventrículo esquerdo (VE); átrio direito (AD); e átrio esquerdo (AE).
Figura 4
Figura 4. – Perfil hemodinâmico do fluxo da via de saída do ventrículo direito (VSVD) causada pelo aumento do pós-carga do VD: redução do tempo de aceleração e presença de desaceleração mesossistólica (notch – seta branca).
Figura 5
Figura 5. – Análise evolutiva ao eco 3D do ventrículo direito (VD), com medida dos volumes diastólico final (VDFVD), sistólico final (VSFVD) e de fração de ejeção (FEVD). Paciente com trombembolismo pulmonar submaciço em 3 momentos: A: pré-trombólise (VDFVD = 165mL, VSFVD = 115mL, FEVD = 30%); B: segundo dia pós-trombólise (VDFVD = 137mL, VSFVD = 82mL, FEVD = 40%); C: quinto dia pós-trombólise (VDFVD = 113mL, VSFVD = 62mL, FEVD = 47,8%).
Figura 6
Figura 6. – Análise evolutiva do strain longitudinal da parede livre do ventrículo direito (VD) em valores absolutos e 3 momentos: A: pré-trombólise; B: segundo dia pós-trombólise; C: quinto dia pós-trombólise com valores de strain normalizados.
Figura 7
Figura 7. – A-E: Esquema de avaliação da compressibilidade venosa pelo transdutor do ultrassom utilizado na pesquisa de trombose venosa. A: artéria e veia sem compressão pelo transdutor. B: veia normal com compressão total. C: veia dilatada e incompressível, com trombo de aspecto agudo/recente. D: veia de calibre normal a reduzido, pouco compressível pela manobra com o transdutor e compatível com achados de trombose venosa antiga/crônica. E: recorrência de trombose.
Figura 8
Figura 8. – Corte ultrassonográfico transversal da artéria e veia femoral comum para teste de compressibilidade venosa.
Figura 9
Figura 9. – Doppler pulsado em veia femoral comum demonstrando fluxo normal, fásico com os movimentos respiratórios e compatível com ausência de trombose oclusiva.
Figura 10
Figura 10. – Trombose oclusiva e não oclusiva de aspecto agudo ao ultrassom. A: corte transversal da veia femoral comum; B: veias fibulares evidenciando dilatação e incompressibilidade sem evidências de fluxo ao mapeamento de fluxo em cores e ao Power Doppler; C: corte longitudinal da veia femoral comum com e sem mapeamento de fluxo em cores evidenciando trombo flutuante de aspecto recente e não oclusivo.
Figura 11
Figura 11. – Alterações crônicas pós-trombóticas. A: veia femoral ao modo B sem dilatação, com imagem ecogênica luminal correspondendo a alterações crônicas pós-trombóticas; B: fluxo luminal reduzido ao Power Doppler; C: veias tibiais posteriores com paredes espessadas ao modo B; D: preenchimento parcial da luz do vaso das veias tibiais posteriores pelo Power Doppler.
Figura 12
Figura 12. – Trombose venosa de veias plantares incompressíveis e sem fluxo no mapeamento de fluxo a cores.
Figura 13
Figura 13. – Trombose de veia ilíaca externa esquerda: comparação de fluxo nas veias femorais comuns esquerda e direita. A: veia ilíaca externa esquerda dilatada, com a luz preenchida por trombo de aspecto recente, sem fluxo ao mapeamento de fluxo a cores; B: fluxo contínuo ao Doppler espectral em veia femoral comum esquerda, secundário a trombose de veia ilíaca externa ipsolateral; C: fluxo fásico e normal na veia femoral comum contralateral.
Figura 14
Figura 14. – Protocolo de exame completo de ecografia vascular das veias do membro inferior para o diagnóstico de TVP. A: desenho esquemático dos pontos de compressão em todo sistema venoso suprapatelar, e avaliação pelo mapeamento de fluxo em cores e Doppler pulsado do segmento femoral; B: desenho esquemático da compressão e avaliação pelo mapeamento de fluxo em cores e Doppler pulsado do segmento poplíteo; C: desenho esquemático de compressão e avaliação pelo mapeamento de fluxo em cores do segmento distal.
Figura 15
Figura 15. – A: protocolo de exame de ultrassom de compressão completo das veias dos membros inferiores; B: protocolo de exame de ultrassom de compressão estendido (3 pontos); C: protocolo de exame de ultrassom de compressão (2 pontos)
Figura 16
Figura 16. – Imagem de cisto de Baker na região posteromedial do joelho (diagnóstico diferencial da trombose venosa profunda).
Figura 17
Figura 17. – Hemangioendotelioma venoso. A: aspecto clínico; B: imagem hipoecogênica circundando uma veia superficial à ultrassonografia com mapeamento de fluxo a cores; C: exame anatomopatológico.
Figura 18
Figura 18. – Imagem ultrassonográfica bidimensional, com medida do diâmetro da veia poplítea após manobra de compressão.
Figura 19
Figura 19. – A: imagem bidimensional em corte longitudinal de veia femoral comum com espessamento parietal e trabeculações/traves no interior do vaso. B: mapeamento de fluxo em cores, evidenciando fluxo ao redor da trabeculação. C: achados semelhantes em veia poplítea.
Figura 20
Figura 20. – Refluxo ao mapeamento de fluxo a cores (em vermelho) e ao Doppler pulsado em veia poplítea.
Figura 21
Figura 21. – Processo de neovascularização na recanalização da trombose. A: corte transverso de veia com imagens ecogênicas correspondentes ao trombo no interior do vaso. O mapeamento em cores demonstra fluxo no interior do trombo. B: Doppler pulsado, detectando fluxo no interior do trombo.
Figura 22
Figura 22. – Alterações ultrassonográficas que podem ser encontradas no seguimento do paciente com trombose venosa profunda. A: corte longitudinal da artéria femoral (em vermelho) e veia femoral (em azul). Presença de recanalização parcial do segmento venoso circundando traves residuais. B: corte longitudinal da veia femoral. Fluxo venoso ascendente normal é detectado em azul pelo mapeamento de fluxo em cores, e refluxo em vermelho, após a manobra de compressão distal. C: corte transversal de veia muscular em panturrilha, com diâmetros aumentados e compressibilidade reduzida. Em 1, observa-se imagem ecogênica referente a TVP prévia, e em 2 observa-se imagem hipoecoica referente ao processo de recorrência atual. Alguns fatores associados à persistência da alteração pós-trombótica, como presença de trombos residuais e/ou insuficiência valvular pós-flebítica, foram considerados preditores de SPT. No entanto, tais achados podem ser utilizados para alterar o planejamento terapêutico ainda são temas controversos na literatura. 148,149
Figura 23
Figura 23. – Angio-TC positiva para TEP agudo. Sinais de disfunção do ventrículo direito; notar aumento das dimensões do VD (relação VD/VE >1) e abaulamento à esquerda do septo interventricular.
Figura 24
Figura 24. – Angiotomografia computarizada de artérias pulmonares em dupla energia. A: mapa de iodo refletindo a distribuição homogênea do meio de contraste no parênquima pulmonar; B: reconstrução angiográfica MIP. A TCDE consegue aliar a informação funcional com a imagem anatômica angiográfica. C: mapa de iodo de TCDE em outro paciente, demonstrando defeitos de perfusão em cunha nos lobos superior e inferior esquerdos, compatíveis com infartos pulmonares. As imagens angiográficas (não demonstradas) confirmaram o diagnóstico de TEP agudo.
Figura 25
Figura 25. – A: falha de enchimento oclusiva determinando aumento do calibre do vaso; B: falha de enchimento, central, margeada por meio de contraste; C: falha de enchimento, aderida à parede do vaso e formando um ângulo agudo com ela.
Figura 26
Figura 26. – Infarto pulmonar. A e B: opacidade periférica, com focos hipertransparentes de permeio e sem aerobroncogramas. C: trombo agudo em ramo arterial pulmonar segmentar basal para o lobo inferior direito.
Figura 27
Figura 27. – Angio TC de artérias pulmonares. A: sinais típicos de TEP agudo; B: sinais de sobrecarga das cavidades cardíacas direitas. Notar relação VD/VE >1,0 e o aspecto retificado do septo interventricular.
Figura 28
Figura 28. – A: série de imagens exemplificando uma cintilografia pulmonar V/Q Planar, com uso de DTPA/MAA marcados com 99mTc, nas projeções anterior, posterior, laterais e oblíquas, mostrando inalação e perfusão normais. B: série de imagens de cintilografia pulmonar V/Q Spect-CT, com uso de DTPA/MAA marcados com 99mTc da esquerda para direita: primeira coluna, ventilação Spect; segunda coluna, perfusão Spect; e terceira coluna, TC tórax. A imagem de ventilação é normal, já a perfusão evidencia déficit perfusional no segmento inferior do lobo superior esquerdo (seta) e TC normal, configurando TEP.
Figura 29
Figura 29. – À esquerda, série de imagens exemplificando uma cintilografia pulmonar V/Q Spect-CT normal, com uso de technegas/MAA marcados com 99mTc, mostrando de cima para baixo: TC baixa dose; ventilação Spect; fusão da ventilação/TC; perfusão Spect; e fusão perfusão/TC. À direita, série de imagens exemplificando um V/Q PET-CT normal, com uso de Galligas/MAA marcados com 68Ga de cima para baixo, cortes sagitais de fusão da ventilação/TC (esquerda) e perfusão/TC (direita). Adaptado de Le Roux Pyet et al.279e Bailey DL et al. 280
Figura 30
Figura 30. – À esquerda, série de imagens exemplificando uma cintilografia pulmonar V/Q SPECT-CT normal, com uso de technegas/MAA marcados com 99m Tc, mostrando, de cima para baixo: TC baixa dose, ventilação Spect, fusão da ventilação/CT, perfusão Spect e fusão perfusão/CT. À direita, série de imagens exemplificando um V/Q PET-CT, com uso de Galligas/MAA marcados com 68 Ga, de cima para baixo: cortes sagitais de fusão da ventilação/TC (a esquerda) e perfusão/TC (a direita); déficit concordante, imagem de fusão perfusão PET/CT mostrando déficit de perfusão (seta); e imagem de CT apenas, demonstrando tumor obstruindo brônquio, correspondendo ao defeito de ventilação e perfusão no PET.
Chart 2
Chart 2. – Diagnostic flowChart for the study of deep vein thrombosis (DVT)
Chart 5
Chart 5. – Diagnostic flowChart for the assessment of suspected pulmonary embolism (PE) without hemodynamic repercussions
Chart 6
Chart 6. – Diagnostic algorithm for acute pulmonary embolism (PE) in hemodynamically unstable patients
Figure 1
Figure 1. – A-C: direct visualization of thrombus in the right cavities and left pulmonary artery. Thr: thrombus; Ao: aorta; LP: left pulmonary artery; RP: right pulmonary artery.
Figure 2
Figure 2. – Right ventricular (RV) pressure overload and/or dysfunction A: straightening of the interventricular septum with RV dilatation in the parasternal cross-sectional view; B: RV dilatation assessed in the apical view by the RV:LV ratio at end-diastole (>0.6 mild; 1-2 important; >2 severe); C: equivalent to RV:LV ratio assessed by CT angiography. RV: right ventricle; LV: left ventricle; RA: right atrium; LA: left atrium.
Figure 3
Figure 3. – McConnell sign. Presence of right ventricular dilatation, free-wall hypokinesia, and preserved apical contractility. A: diastole; B: systole; C: longitudinal strain of the right ventricle (RV); left ventricle (LV); right atrium (RA); and left atrium (LA).
Figure 4
Figure 4. – Hemodynamic profile of right ventricular outflow tract (RVOT) caused by increased RV afterload: reduction in acceleration time and presence of mid-systolic deceleration (notch – white arrow).
Figure 5
Figure 5. – Follow-up3D echocardiographic analysis of the right ventricle (RV), with measurement of RV end-diastolic volume (EDV), end-systolic volume (ESV), and ejection fraction (EF). Patient with submassive pulmonary embolism at 3 time points: A: pre-thrombolysis (RV EDV = 165 mL, RV ESV = 115 mL, RV EF = 30%); B: day 2 after thrombolysis (RV EDV = 137 mL, RV ESV = 82 mL, RV EF = 40%); C: day 5 after thrombolysis (RV EDV = 113 mL, RV ESV = 62 mL, RV EF = 47.8%).
Figure 6
Figure 6. – Figure 6 – Follow-up images analysis of the right ventricular (RV) free-wall longitudinal strain in absolute values and at 3 time points: A: pre-thrombolysis; B: day 2 after thrombolysis; C: day 5 after thrombolysis with normalized strain values.
Figure 7
Figure 7. – A-E: Venous compressibility evaluation by the ultrasound transducer in the investigation of venous thrombosis.
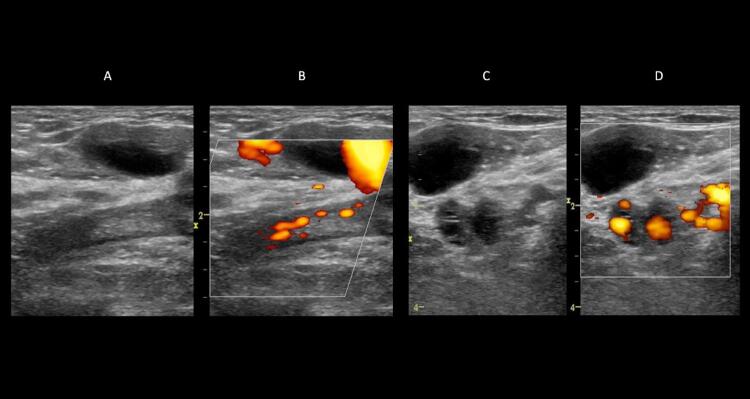
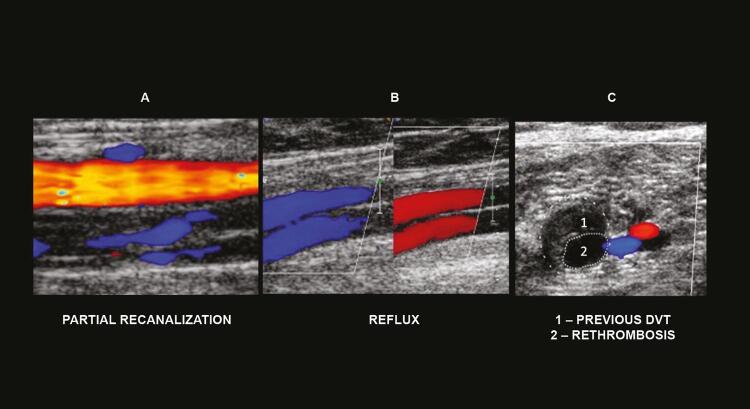
A: artery and vein without transducer compression. B: normal vein with maximum compression. C: dilated and noncompressible vein with acute/fresh thrombus. D: normal- to small-caliber vein, slightly compressible by transducer maneuvers and consistent with findings of chronic/old venous thrombosis. E: recurrent thrombosis.
Figure 8
Figure 8. – Cross-sectional view of the common femoral artery and vein for venous compressibility evaluation.
Figure 9
Figure 9. – Pulsed Doppler of the common femoral vein showing normal phasic flow in response to breathing movements, consistent with the absence of occlusive thrombosis.
Figura 10
Figura 10. – Trombose oclusiva e não oclusiva de aspecto agudo ao ultrassom. A: corte transversal da veia femoral comum; B: veias fibulares evidenciando dilatação e incompressibilidade sem evidências de fluxo ao mapeamento de fluxo em cores e ao Power Doppler; C: corte longitudinal da veia femoral comum com e sem mapeamento de fluxo em cores evidenciando trombo flutuante de aspecto recente e não oclusivo.
Figure 11
Figure 11. – Chronic post-thrombotic changes. A: B-mode image showing no dilation of the femoral vein. Echogenic luminal image consistent with chronic post-thrombotic changes; B: power Doppler image showing reduced luminal flow; C: B-mode image showing posterior tibial veins with thick walls; D: power Doppler image showing partial luminal narrowing of posterior tibial veins.
Figure 12
Figure 12. – Color flow Doppler image showing venous thrombosis of noncompressible plantar veins without flow.
Figure 13
Figure 13. – Left external iliac vein thrombosis: flow comparison between the left and right common femoral veins. A: color Doppler image showing no flow in the dilated left external iliac vein, with lumen filled with a thrombus of recent appearance; B: spectral Doppler image showing continuous flow in the common left femoral vein secondary to thrombosis of the ipsilateral external iliac vein; C: normal phasic flow in the contralateral common femoral vein.
Figure 14
Figure 14. – Whole-leg vascular ultrasound protocol for deep vein thrombosis diagnosis. A: schematic representation of compression points throughout the above-knee venous system and color flow Doppler and spectral Doppler of the femoral segment; B: schematic representation of compression and color flow Doppler and pulsed Doppler of the popliteal segment; C: schematic representation of compression and color flow Doppler of the distal segment.
Figure 15
Figure 15. – A: complete lower extremity venous compression ultrasound protocol; B: three-point extended compression ultrasound protocol; C: two-point extended compression ultrasound protocol.
Figure 16
Figure 16. – Baker’s cyst in the posteromedial region of the knee (differential diagnosis of deep vein thrombosis).
Figure 17
Figure 17. – Venous hemangioendothelioma. A: clinical appearance; B: hypoechoic image surrounding a superficial vein on color flow Doppler; C: histopathologic examination.
Figure 18
Figure 18. – Two-dimensional ultrasound image with measurement of popliteal vein diameter after a compression maneuver.
Figure 19
Figure 19. – A: two-dimensional longitudinal image of the common femoral vein with parietal thickening and trabeculations/fibrous tissue inside the vessel. B: color flow Doppler showing flow around the trabeculation. C: similar findings in the popliteal vein.
Figure 20
Figure 20. – Reflux in the popliteal vein on color flow Doppler (red) and pulsed Doppler.
Figure 21
Figure 21. – Process of neovascularization in recanalized thrombosis. A: cross-sectional view of a vein with echogenic images corresponding to the thrombus inside the vessel. Color Doppler demonstrates the presence of flow within the thrombus. B: Pulsed wave Doppler revealing the presence of flow within the thrombus.
Figure 22
Figure 22. – Ultrasound changes that may be found in the follow-up of patients with deep vein thrombosis. A: longitudinal view of the femoral artery (red) and femoral vein (blue). Presence of partial recanalization of the venous segment surrounding residual fibrosis. B: longitudinal view of the femoral vein. Normal ascending venous flow is detected in blue by color flow Doppler, and reflux is shown in red after distal compression maneuver. C: cross-sectional view of the calf muscle vein, with increased diameters and reduced compressibility. In 1, an echogenic image refers to a previous DVT, and in 2, a hypoechoic image refers to a current recurrence.
Figure 23
Figure 23. – Positive CT angiography for acute PE. Signs of RV dysfunction; note increased RV dimensions (RV/LV ratio >1) and ventricular septum bowing leftward.
Figure 24
Figure 24. – Dual-energy computed tomography pulmonary angiography. A: iodine-enhanced map reflecting the homogeneous distribution of contrast material within the lung parenchyma; B: MIP reconstruction in CT angiography. Dual-energy CT combines functional information with anatomical angiographic images. C: iodine-enhanced map of dual-energy CT in another patient, showing wedge-shaped perfusion defects in the left upper and lower lobes, compatible with pulmonary infarctions. Angiographic images (not shown) confirmed the diagnosis of acute PE.
Figure 25
Figure 25. – A: occlusive filling defect causing an increase in vessel caliber; B: contrast-edged, central filling defect; C: filling defect adhering to the vessel wall and forming an acute angle with it.
Figure 26
Figure 26. – Pulmonary infarction. A and B: peripheral opacity with central foci of attenuation and no air bronchograms. C: acute thrombus in the basal segmental pulmonary artery to the right lower lobe.
Figure 27
Figure 27. – CT pulmonary angiography. A: typical signs of acute PE; B: signs of overload of the right heart chambers. Note RV/LV ratio >1.0 and straightening of the interventricular septum.
Figure 28
Figure 28. – A: series of images of planar V/Q scintigraphy with 99mTc-labeled DTPA/MAA, with the anterior, posterior, lateral, and oblique views showing normal ventilation and perfusion. B: series of images of V/Q SPECT combined with low-dose CT with 99mTc-labeled DTPA/MAA, from left to right: first column, ventilation SPECT; second column, perfusion SPECT; and third column, chest CT. The ventilation image is normal, while the perfusion image shows a perfusion defect in the lower segment of the left upper lobe (arrow) and normal CT, which characterizes PE.
Figure 29
Figure 29. – On the left, a series of images showing a normal V/Q SPECT/CT scintigram with 99m Tc-labeled Technegas/MAA; from top to bottom: low-dose CT; ventilation SPECT; fused ventilation/CT; perfusion SPECT; and fused perfusion/CT. On the right, a series of images showing a normal V/Q PET/CT scan with 68 Ga-labeled Galligas/MAA; from top to bottom: sagittal views of fused ventilation/CT (left) and perfusion/CT (right). Adapted from Le Roux PY et al. 279 and Bailey DL et al. 280
Figure 30
Figure 30. – On the left, a series of images showing a normal V/Q SPECT/CT scintigram with 99m Tc-labeled Technegas/MAA; from top to bottom: low-dose CT; ventilation SPECT; fused ventilation/CT; perfusion SPECT; and fused perfusion/CT. On the right, a series of images showing a V/Q PET/CT scan with 68 Ga-labeled Galligas/MAA; from top to bottom: sagittal views of fused ventilation/CT (left) and perfusion/CT (right); matched defect, fused PET/CT perfusion image showing a perfusion defect (arrow); and a CT image showing a tumor obstructing the bronchus, corresponding to the ventilation/perfusion defect on PET imaging.

References

    1. Cushman M , Tsai AW , White RH et al . Deep vein thrombosis and pulmonary embolism in two cohorts: the longitudinal investigation of thromboembolism etiology . Am J Med . 2004 ; 117 ( 1 ): 19 - 25 . - PubMed
    2. Cushman M, Tsai AW, White RH, et al. Deep vein thrombosis and pulmonary embolism in two cohorts: the longitudinal investigation of thromboembolism etiology. Am J Med . 2004;117(1):19–25. - PubMed
    1. White RH . The epidemiology of venous thromboembolism . Circulation . 2003 ; 107 ( 23 Suppl 1 ): I4 - 8 . - PubMed
    2. White RH. The epidemiology of venous thromboembolism. Circulation . 2003;107(23) Suppl 1:I4–I8. - PubMed
    1. Brasil . Ministério da Saúde , 23 jun . 2021 . Datasus . Disponível em: http://tabnet.datasus.gov.br/cgi/tabcgi.exe?sim/cnv/obt10uf.def . Acesso em: 11 de setembro de 2021 .
    2. Brasil Ministério da Saúde. [Acesso em: 11 de setembro de 2021]; Datasus . 2021 Jun 23; http://tabnet.datasus.gov.br/cgi/tabcgi.exe?sim/cnv/obt10uf.def .
    1. Ohki AV , van Bellen B . A incidência regional do trombembolismo venoso no Brasil . J Vasc Bras . 2017 ; 16 ( 3 ): 227 - 31 . - PMC - PubMed
    2. Ohki AV, van Bellen B. A incidência regional do trombembolismo venoso no Brasil. J Vasc Bras . 2017;16(3):227–231. - PMC - PubMed
    1. Mazzolai L , Aboyans V , Ageno W et al . Diagnosis and management of acute deep vein thrombosis: a joint consensus document from the European Society of Cardiology working groups of aorta and peripheral vascular diseases and pulmonary circulation and right ventricular function . Eur Heart J . 2018 ; 39 ( 47 ): 4.208 - 18 . - PubMed
    2. Mazzolai L, Aboyans V, Ageno W, et al. Diagnosis and management of acute deep vein thrombosis: a joint consensus document from the European Society of Cardiology working groups of aorta and peripheral vascular diseases and pulmonary circulation and right ventricular function. Eur Heart J . 2018;39(47):4.208–4.218. - PubMed