Meta-Analysis
. 2022 Jun 2;109(6):1007-1015.
doi: 10.1016/j.ajhg.2022.04.002. Epub 2022 May 3.

Meta-imputation: An efficient method to combine genotype data after imputation with multiple reference panels

Affiliations
Meta-Analysis

Meta-imputation: An efficient method to combine genotype data after imputation with multiple reference panels

Ketian Yu et al. Am J Hum Genet. .

Abstract

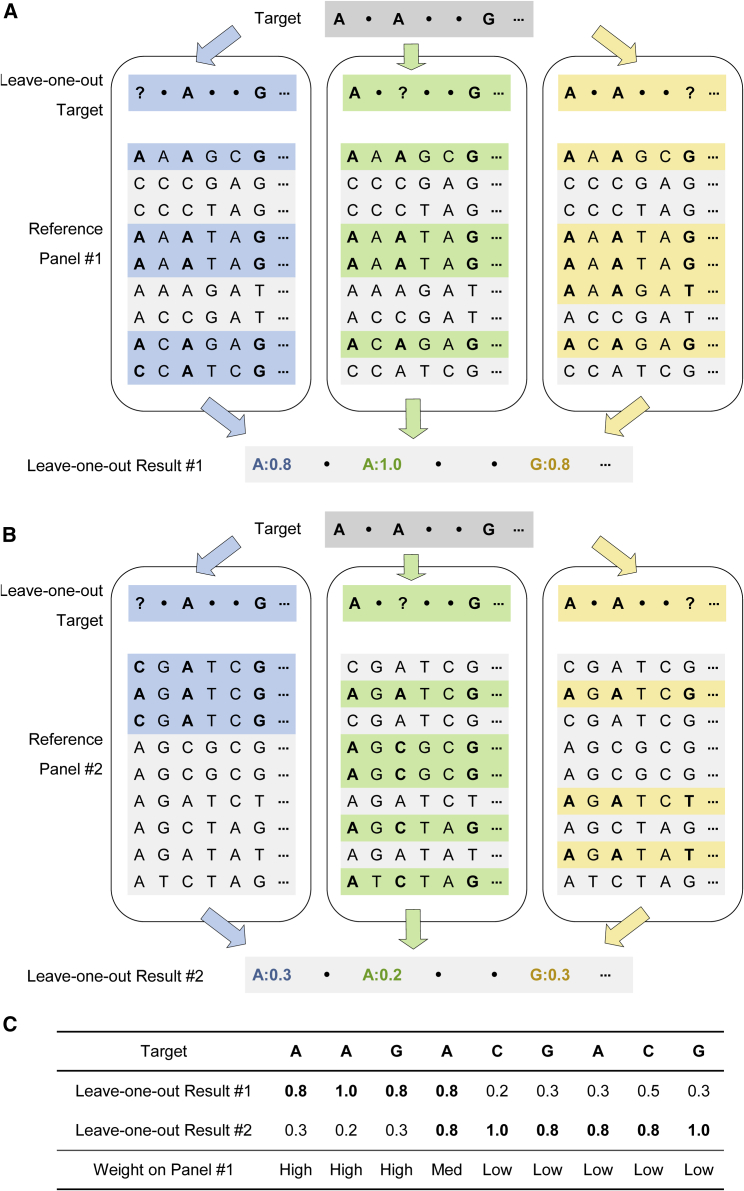
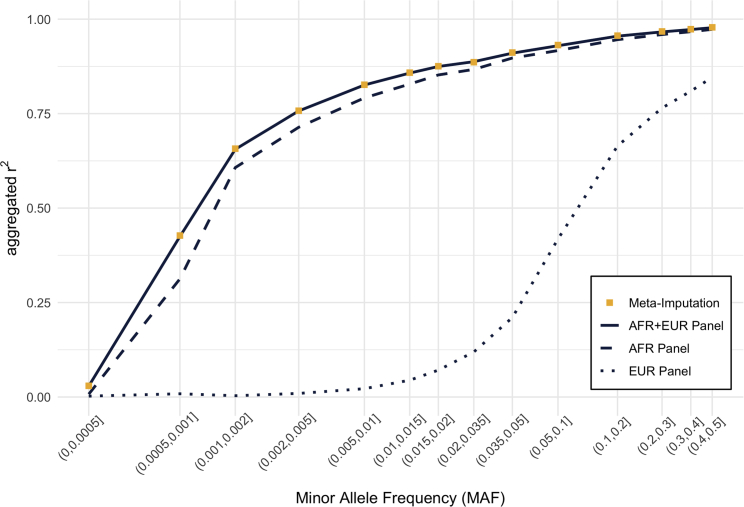
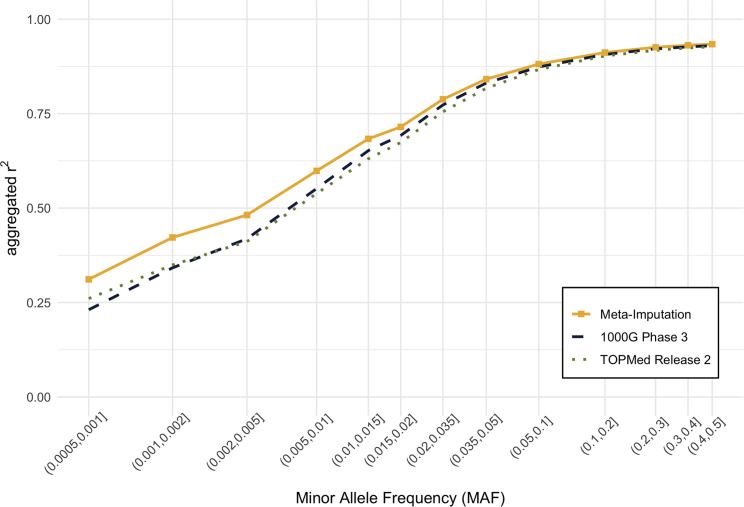
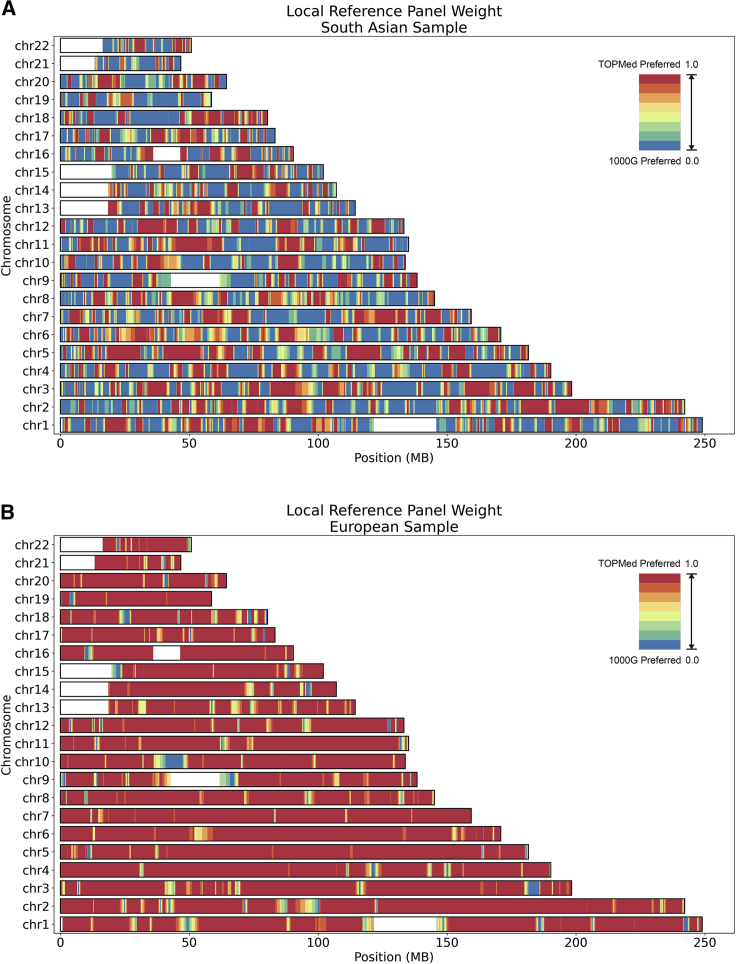
Genotype imputation is an integral tool in genome-wide association studies, in which it facilitates meta-analysis, increases power, and enables fine-mapping. With the increasing availability of whole-genome-sequence datasets, investigators have access to a multitude of reference-panel choices for genotype imputation. In principle, combining all sequenced whole genomes into a single large panel would provide the best imputation performance, but this is often cumbersome or impossible due to privacy restrictions. Here, we describe meta-imputation, a method that allows imputation results generated using different reference panels to be combined into a consensus imputed dataset. Our meta-imputation method requires small changes to the output of existing imputation tools to produce necessary inputs, which are then combined using dynamically estimated weights that are tailored to each individual and genome segment. In the scenarios we examined, the method consistently outperforms imputation using a single reference panel and achieves accuracy comparable to imputation using a combined reference panel.

Keywords: genome-wide association study; genotype imputation.


Conflict of interest statement

Declaration of interests G.R.A. is an employee of Regeneron Pharmaceuticals and owns stock and stock options in Regeneron Pharmaceuticals.

Figures

Figure 1
Figure 1
An illustration of leave-one-out imputation (A–C) LOO imputation on a small chunk of six genotype markers using reference panel #1 and reference panel #2 is illustrated in (A) and (B), respectively. The target haplotype is genotyped at three markers (1, 3, 6). During the LOO imputation procedure, one marker was masked at a time, denoted as “?” The figure simplifies the HMM procedure to estimating LOO results based on exact matching according to the unmasked markers (an HMM is used in the actual algorithm). For example, when performing LOO imputation using reference panel #1, we first masked the observed allele “A” at marker 1 and found five haplotype matches (shaded in blue) based on marker 3 and marker 6. The alleles from the five matches at marker 1 were AAAAC, which suggested a result of “A” with probability 0.8. Thus we determined that the probabilities of observing the true allele at markers 1, 3, and 6 were, respectively, 0.8, 1.0, and 0.8 from panel #1 and 0.3, 0.2, and 0.3 from panel #2. These were compared in (C) along with LOO results at other genotyped markers. Panel #1 was more accurate than panel #2 at the beginning but less accurate at the end, so ideally the weight on panel #1 should be high at the beginning and low at the end.
Figure 2
Figure 2
Comparison of imputation accuracy in African American samples Imputation accuracy for the pseudo-GWAS ASW dataset was compared among (1) meta-imputation, (2) imputation using the combined AFR + EUR panel including both African and European ancestry genomes, (3) imputation using the homogeneous African (AFR) panel, and (4) imputation using the homogeneous European (EUR) panel. Variants were grouped according to minor allele frequency, which was estimated from the genotype data of 2,504 samples in the 1000 Genomes Project. Aggregated r2 values were calculated for each variant group.
Figure 3
Figure 3
Comparison of imputation accuracy in South Asian samples Imputation accuracy for 762 South Asian samples in UK Biobank data was compared among (1) meta-imputation, (2) imputation using 1000G phase 3 (GRCh38) panel, and (3) imputation using the TOPMed release 2 panel. Aggregated r2 value was computed based on 918,144 variants shared by the 1000G panel, the TOPMed panel, and UK Biobank whole-exome-sequencing data. Variants were binned according to minor allele frequency, which was estimated from exome-sequencing data for the 762 samples.
Figure 4
Figure 4
Genome-wide summary of weights used in meta-imputation (A and B) UK Biobank samples were meta-imputed against the 1000G phase 3 panel and the TOPMed release 2 panel. The figures display the local weights on the TOPMed panel from the weight-estimation step, where red indicates a preference for TOPMed and blue indicates a preference for 1000G. (A) corresponds to the analysis of a sample haplotype with South Asian ancestry, where both the 1000G panel and the TOPMed panel were favored in substantial portions of the genome. (B) corresponds to the analysis of a sample haplotype with European ancestry, where the TOPMed panel was nearly always favored.

References

    1. Fritsche L.G., Igl W., Bailey J.N.C., Grassmann F., Sengupta S., Bragg-Gresham J.L., Burdon K.P., Hebbring S.J., Wen C., Gorski M., et al. A large genome-wide association study of age-related macular degeneration highlights contributions of rare and common variants. Nat. Genet. 2016;48:134–143. doi: 10.1038/ng.3448. - DOI - PMC - PubMed
    1. Lee J.J., Wedow R., Okbay A., Kong E., Maghzian O., Zacher M., Nguyen-Viet T.A., Bowers P., Sidorenko J., Karlsson Linner R., et al. Gene discovery and polygenic prediction from a genome-wide association study of educational attainment in 1.1 million individuals. Nat. Genet. 2018;50:1112–1121. doi: 10.1038/s41588-018-0147-3. - DOI - PMC - PubMed
    1. Stahl E.A., Breen G., Forstner A.J., McQuillin A., Ripke S., Trubetskoy V., Mattheisen M., Wang Y., Coleman J.R.I., Gaspar H.A., et al. Genome-wide association study identifies 30 loci associated with bipolar disorder. Nat. Genet. 2019;51:793–803. doi: 10.1038/s41588-019-0397-8. - DOI - PMC - PubMed
    1. Marchini J., Howie B. Genotype imputation for genome-wide association studies. Nat. Rev. Genet. 2010;11:499–511. doi: 10.1038/nrg2796. - DOI - PubMed
    1. Das S., Abecasis G.R., Browning B.L. Genotype imputation from large reference panels. Annu. Rev. Genomics. Hum. Genet. 2018;19:73–96. doi: 10.1146/annurev-genom-083117-021602. - DOI - PubMed

Publication types

LinkOut - more resources