Review
. 2022 May 4;13(1):2436.
doi: 10.1038/s41467-022-29960-8.

Integrative proteogenomic characterization of hepatocellular carcinoma across etiologies and stages

Affiliations
Review

Integrative proteogenomic characterization of hepatocellular carcinoma across etiologies and stages

Charlotte K Y Ng et al. Nat Commun. .

Abstract

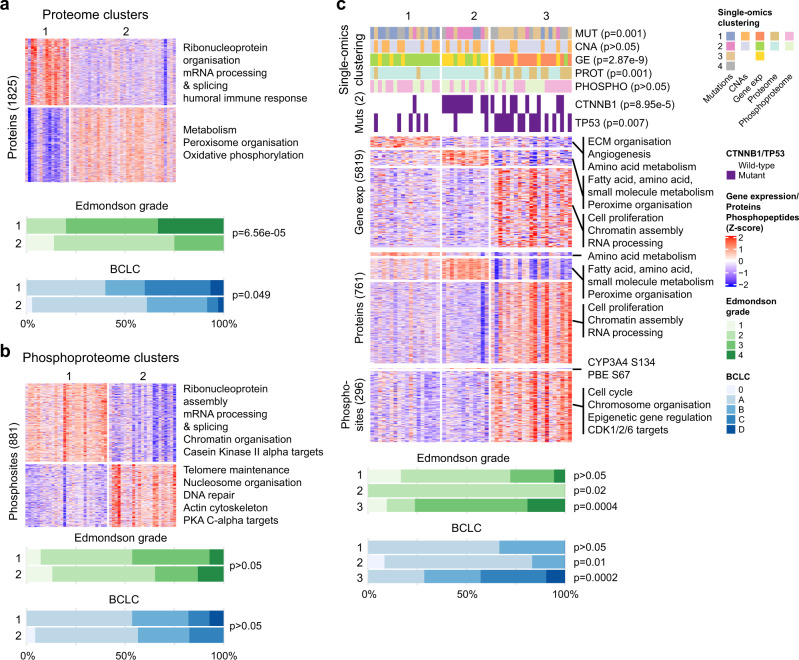
Proteogenomic analyses of hepatocellular carcinomas (HCC) have focused on early-stage, HBV-associated HCCs. Here we present an integrated proteogenomic analysis of HCCs across clinical stages and etiologies. Pathways related to cell cycle, transcriptional and translational control, signaling transduction, and metabolism are dysregulated and differentially regulated on the genomic, transcriptomic, proteomic and phosphoproteomic levels. We describe candidate copy number-driven driver genes involved in epithelial-to-mesenchymal transition, the Wnt-β-catenin, AKT/mTOR and Notch pathways, cell cycle and DNA damage regulation. The targetable aurora kinase A and CDKs are upregulated. CTNNB1 and TP53 mutations are associated with altered protein phosphorylation related to actin filament organization and lipid metabolism, respectively. Integrative proteogenomic clusters show that HCC constitutes heterogeneous subgroups with distinct regulation of biological processes, metabolic reprogramming and kinase activation. Our study provides a comprehensive overview of the proteomic and phophoproteomic landscapes of HCCs, revealing the major pathways altered in the (phospho)proteome.


Conflict of interest statement

The authors declare no competing interests.

Figures

Fig. 1
Fig. 1. Deregulated pathways in HCC.
ac Principal component analysis plots of (a) transcriptome (grade 1 n = 7, grade 2 n = 66, grade 3 n = 41, grade 4 n = 8), b proteome (grade 1 n = 5, grade 2 n = 25, grade 3 n = 16, grade 4 n = 5), c phosphoproteome (grade 1 n = 5, grade 2 n = 25, grade 3 n = 16, grade 4 n = 5) of HCC biopsies (colored by Edmondson grade) and normal liver biopsies. d Intra-group (within Edmondson grade) variability as measured by pairwise Euclidean distance between samples according to principal components (sample size as in (ac)). e Distance of each HCC to the median of normal livers as measured by Euclidean distance according to principal components. d, e Statistical comparisons were performed using Spearman’s correlation tests. Thick middle line in the boxplot denotes the median; box extends to the 1st and 3rd quartiles; whiskers extend to the ±1.5 IQR of the box; dots depict the outliers. f Scatter plot of (y-axis) the moderated t-statistics from the differential protein expression analysis of HCC vs normal liver against (x-axis) the F-statistics from the differential gene expression analysis of HCC vs normal liver. Points are colored according to the four quadrants. Enrichment maps show the top 10 enriched Reactome pathways from over-representation tests of the genes/proteins in each of the four quadrants. In each enrichment map, gene sets with overlapping gene sets are joined by edges. Nodes are colored according to p-value, where gray indicates a higher p value and dark blue/violet/purple/red indicates a lower p value. The size of the nodes is proportional to the number of genes in the quadrant within a given gene set. Source data are provided as a Source Data file.
Fig. 2
Fig. 2. CNA-mRNA-protein correlation.
Histograms of the distributions of the per-gene Spearman correlation coefficients (a) for CNA-mRNA and (b) mRNA-protein expression. sig.: significant. c Venn diagram of the number of enriched Reactome pathways for genes/proteins ranked by CNA-mRNA expression correlation (orange) and mRNA-protein expression correlation (blue). Enrichment and statistical significance were defined by gene set enrichment analysis. Multiple correction was performed using the Benjamini–Hochberg method. Barplot of selected Reactome pathways enriched among genes with high CNA-mRNA expression correlation (orange) and/or with high mRNA-protein expression correlation (blue). Statistically significant normalized enrichment scores (NES, p < 0.05) are shown in darker shades (dark orange/blue) while non-significant NESs are shown in lighter shades (light orange/blue). d Scatterplot of the per-gene Spearman correlation coefficients (y-axis) between mRNA and protein expression against (x-axis) between CNA and mRNA. Genes in five of the recurrently altered regions as defined by GISTIC2 are colored according to the color key. Inset shows the genes with >0.5 correlation coefficients in both comparisons. Dysregulated genes (compared to normal livers) on both the mRNA and protein levels are underlined. Source data are provided as a Source Data file.
Fig. 3
Fig. 3. The phosphoproteomic landscape of HCC.
a Volcano plot of the −log10(adjusted p value) against the log fold-change (logFC) of the differentially regulated phosphorylation sites in HCC compared to normal livers. Dots are colored by logFC. Vertical dotted lines indicate |logFC| = 2 and horizontal dotted line indicates adjusted p value = 0.05. b Dot plot illustrating selected enriched Reactome pathways according to gene set enrichment analysis (GSEA) from the differential expression analysis in (a). NES normalized enrichment score. c Top barplot showing the enrichment z-score of the kinases with significantly up- or downregulated kinase activity in a kinase-substrate enrichment analysis (KSEA) comparing HCC to normal livers. In the bubble plot below, the phosphorylation site substrates are shown in rows, where red and blue dots indicate that the phosphorylation site is up- and downregulated, respectively. The size of the dots is proportional to the log2fold-change of the phosphorylation site. Phosphorylation sites with at least a 5-fold difference between HCCs and normal livers are shown. For kinases with <3 substrates with at least a 5-fold difference, the top three substrates with the highest |logFC| are shown. Source data are provided as a Source Data file.
Fig. 4
Fig. 4. Proteogenomic analysis of SMGs.
a Heatmaps showing the expression (z-score-transformed) of (left) 23 proteins differentially expressed between CTNNB1-mutant and -WT HCCs (FDR < 0.05) and (right) the corresponding gene expression on the mRNA level. Genes with asterisks were also differentially expressed on the transcriptome level. b Binned scatterplot plotting the signed (according to the direction of the fold change) p values from differential expression analyses of protein expression (x-axis) and of phosphorylation site expression (y-axis) between CTNNB1-mutant and -WT HCCs. Phosphorylation sites >99th quantile of the unsigned p-values of the differential phosphoprotein expression analysis and within the inter-quartile range of the signed p-values of differential protein expression analysis are labeled. c Enrichment map showing the Gene Ontology biological processes enriched among proteins with phosphorylation sites at >90th quantile of the unsigned p-values of the differential phosphoprotein expression analysis and within the inter-quartile range of signed p-values of differential protein expression analysis. d Plot showing the kinase-substrate enrichment analyses z-scores ordered in increasing order, comparing (left) phosphorylation site abundance and (right) phosphorylation site abundance normalized by protein abundance between CTNNB1-mutant vs -WT HCCs. Significant kinases are labeled. e Small heatmap as (a) of (left) 399 proteins differentially expressed between TP53-mutant and -WT HCCs (FDR < 0.05) and (right) the corresponding gene expression. Large heatmap showing the subset of 14 proteins/genes for which the direction of the differential expression differed between the proteomic and transcriptomic signatures. fh as (bd) for stratification by TP53 mutation status. Source data are provided as a Source Data file.
Fig. 5
Fig. 5. Integrated phosphoproteomic classification of HCC.
Unsupervised clustering of the (a) proteome and (b) phosphoproteome data using consensus non-negative matrix factorization. c Integrative clustering of the mutation, copy number alteration, transcriptome, proteome and phosphoproteome using the iCluster method. Copy number alterations not shown in the figure as no genomic region differed between clusters. ac Barplots below show the distribution of Edmondson grade and BCLC between the clusters. Statistical comparison for each cluster was computed using the two-sided Mann–Whitney U test. Source data are provided as a Source Data file.

References

    1. Arnold M, et al. Global burden of 5 major types of gastrointestinal cancer. Gastroenterology. 2020;159:335–349.e15. doi: 10.1053/j.gastro.2020.02.068. - DOI - PMC - PubMed
    1. Cancer Genome Atlas Research Network. Electronic address: wheeler@bcm.eduCancer Genome Atlas Research Network Comprehensive and integrative genomic characterization of hepatocellular carcinoma. Cell. 2017;169:1327–1341.e23. doi: 10.1016/j.cell.2017.05.046. - DOI - PMC - PubMed
    1. Fujimoto A, et al. Whole-genome mutational landscape and characterization of noncoding and structural mutations in liver cancer. Nat. Genet. 2016;48:500–509. doi: 10.1038/ng.3547. - DOI - PubMed
    1. Fujimoto A, et al. Whole-genome sequencing of liver cancers identifies etiological influences on mutation patterns and recurrent mutations in chromatin regulators. Nat. Genet. 2012;44:760–764. doi: 10.1038/ng.2291. - DOI - PubMed
    1. Boyault S, et al. Transcriptome classification of HCC is related to gene alterations and to new therapeutic targets. Hepatology. 2007;45:42–52. doi: 10.1002/hep.21467. - DOI - PubMed

Publication types